In short, you will be creating a “network graph” visualization with your personal Facebook data. The following pen will get you started with all the necessary code. Your job is to “hack” it, modify the parameters and values in the program to make it your own.
See the Pen Facebook Network Visualization by Juan Camilo González (@1cgonza) on CodePen.8281
The goal of this assignment is for you to become familiar with web based data visualization techniques and gain deeper understanding of the issues around working with data. In order to achieve that, you will be “drawing” / visualizing your personal network of friends in Facebook. The process of actually working and visualizing your data will provide you with clues as to what this data has to say. You might want to reveal that information to us by the way you represent the data, or as we discussed during the class, you can abstract this information and present it in your own personal way.
What to turn in:
- A “pen” (from codepen.io) with your visualization.
- DOCUMENT THE PROCESS: Write a post describing your process, you might want to document (screenshots) different stages of your work. Or if you want, several pens with versions of your visualization.
- REFLECTION: Include a brief reflection on your experience working with your own data. Remember our discussions in class, the reading and artworks we analyzed.
The first step is to make a copy of the pen:
- Go to: http://codepen.io/1cgonza/pen/vHiCL
- Click the “Fork” button.
- Make sure that you are working on a pen that has a different URL than the one above ending with /vHiCL.
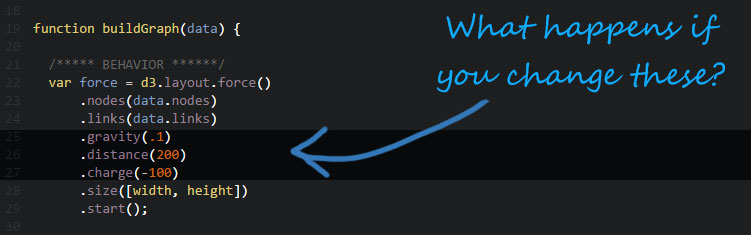
In order for you to modify this visualization to make it your own, lets focus on two parts of the program: behavior and visual representation.
Behavior
The general behavior of the network are a series of rules that control how things “animate” on the screen.
In the code you can change the behavior by adding new values to: gravity, distance and charge.
Visual Representation
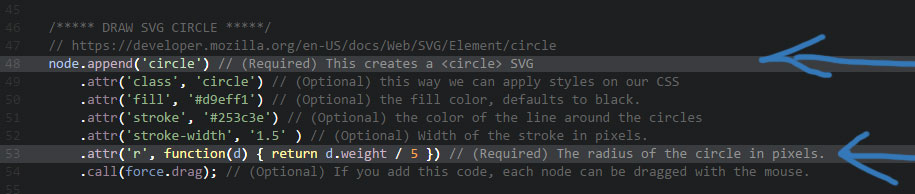
Each person in your network is a node and your job is to decide how you are going to represent each of those nodes.
We can draw with all kinds of geometric shapes, also with external images or a combination of them. Let’s see how this works on the code:
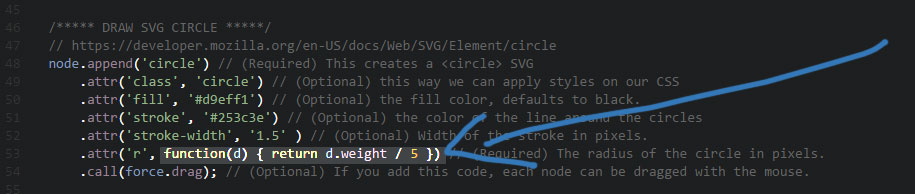
The following section is drawing each node as a circle and you can see I noted which parts of it are required and which are optional.
How did we get these values? essentially we are drawing using SVG (Scalable Vector Graphics) which let us draw all kinds of images on the browser. For a comprehensive reference of what you can do with SVG refer to Mozilla’s documentation.
Let’s take a look at their reference for how to draw a Circle with SVG: https://developer.mozilla.org/en-US/docs/Web/SVG/Element/circle
Based on their information I can extract the pieces I need and create my nodes using circles like this:
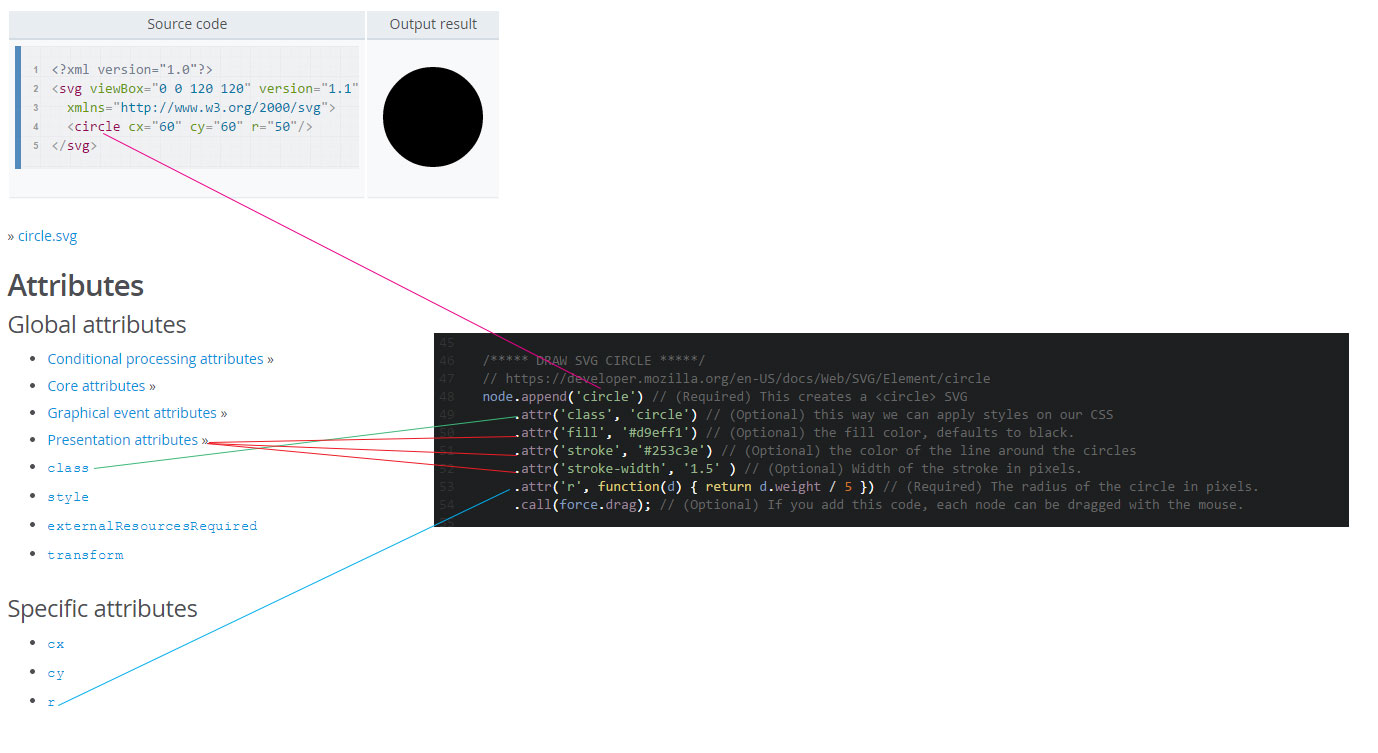
The same principle applies for any other type of graphic in SVG: <circle>, <ellipse>, <image>, <line>, <path>, <polygon>, <polyline>, <rect>
So now you can draw your nodes in any form you want.
Drawing elements using data
As you can see from the code that draws our SVG circles, the attribute ‘r’ looks different from the rest, it has a function that looks at the data we have and generates the value dynamically. There is a reason for that, in our data there is a variable for each node called “weight” which refers to the weight this node (you or one of your friends) has on the network. If we use that “weight” value as the radius size, the result is that each node’s size refers to the weight this person has on the network. A visual metaphor that helps us extract some “meaning” out of our data.
Aside from weight, there are other pieces of information that are different for each node on the network and you can use.
- index
- name
- px
- py
- weight
- x
- y
Let’s take a look at the node that represents me in the network and the values assigned to it:

If you have further questions don’t hesitate to ask, send us an email if you are stuck or need some help. The idea is that you experiment and have fun with this project. I can’t wait to see what you all come up with.
Extra Notes (in case you wonder)
Getting the data
This is how to get your Facebook data.
Instructions and more information at Give me my data website
- In the “Data” dropdown select: Mutual Friends Network Graph.
- In the “Format” select: JSON.
- Click on “Give me my data” button. NOTE: Be patient, depending on how many friends you have this might take a while.
- Copy the result on a text editor.
- Save it as: facebook_YOUR_USER_NAME.json
Parsing Data
We did not go over this process in class, but I am including it here for those of you who are curious.
For our graph visualization we are using a very powerful data visualization library for JavaScript called D3. This example from their gallery shows their force directed layout and also the format of the data. I wrote a script to transform the data we got from the givememydata application into the format D3 needs.
Embedding in WordPress
https://wordpress.org/plugins/codepen-embedded-pen-shortcode/
See the Pen Build JSON data for graph Viz by Juan Camilo González (@1cgonza) on CodePen.8281