web visuals + timeline

Screen Shot 2016-02-13 at 12.08.52 am Screen Shot 2016-02-13 at 12.09.00 am

Some sketches for the digital part of my work. It will be a longform scrolling website.

For the rest of February, I will be working on the written part of my work and begin production on the visuals from March to mid-April. As the report is the work itself, I will be working on the sketch of the visuals at the same time. Much of my process revolves around looking at all my source material and moving things around to tell a story, while keeping in mind the base concepts of my work: the bildungsroman as a framework and the tree as a metaphor for growth (visualisation).


life in pixels

Screen Shot 2016-01-28 at 10.14.04 am

acceptance childhood

strength

Worked on some digital illustrations over the past week. These are some visuals to go along with my visualisation, highlighting some significant moments in my digital life.

I started with the floral illustration on ‘acceptance’, which is more of a symbolic piece on what blogging means to me. Throughout the past month of making such a personal work that involves me to sieve through writing I’ve made in weird, difficult periods of my life, I feel that acceptance is something that I’ve been trying to achieve. Accepting others, having others accept me, and accepting myself. I feel that this is a very important realisation, but I might not want to just make one illustration about it. Maybe small drawings that add up to this concept.

I am not sure if I want to be very explicit in expressing the significance of these illustrations. I feel that a lot of meaning is taken away if I say everything clearly and I would also like to give audience space to form their own meaning and experience when they see the work for themselves. That said, for clarity’s sake, I will include a brief essay on the significance of these illustrations in my formal report.

I have also decided to cut down the entries that I am looking at. Realistically, I can’t do them all. So I will be selecting a fraction of entries that I feel are more important.

I have been behind work for a few weeks because I was feeling stuck, but I think that now I have a better idea of how to work things out. Some things to accomplish this week:

– FYP Report (draft)
– Selecting entries
– Visualisation drafts
– Share more updates and reflections

wordpress theme update

Screen Shot 2015-12-08 at 6.05.42 pm

Over the past week I’ve been working for long hours on WordPress. I think it’s safe to say that I am able to put together the functions that I need to create my virtual work later next year.

This theme is created for my personal website, as a practice. These are some progress screenshots of many trials and errors of creating the layout. I jumped from 2-column, 4-column, before settling on a 3-column layout, using a basic table structure.

Screen Shot 2015-12-17 at 2.36.29 pmScreen Shot 2015-12-17 at 2.35.42 pm

Screen Shot 2015-12-18 at 7.29.13 pm

Had plans for a fancy looking theme, but settled on an imageless/simple theme to look professional. The typeface is Roboto, a Google Font that I installed in the theme. It’s quite a basic and lovely typeface that I might continue to use. I realised that adding a custom font instantly makes my site look less dated, after being used to my standard choices of Georgia and Courier New.

The middle column are WordPress pages – I used a code that generates the pages in a list format, according to the order I specified in WP dashboard. The homepage displays a static page (my bio), defined by this character (·̇·̣̇̇·̣̣̇·̣̇̇·̇). I didn’t want a line of text like ‘home’ to appear there. Having a special character gives the layout an accent.

For links, I created two classes of links: one for body text (pink ones) and a dark grey one for the navigational links.

Screen Shot 2015-12-18 at 7.44.02 pm

For content, they are all WordPress posts. I removed all the functions that comes with a typical post so that it showed the title only.

Still in the midst of getting everything up, and will share the completed theme soon.

visualisation concept


Photo 18-12-15, 6 48 28 PM

This was my final work for Facts & Fictions. I made this booklet on the day of the exhibition… it was a really packed month for all of us. It’s not the most refined piece of work I’ve ever made, but I am quite happy with the concept for visualisation and this is something I will work on next semester, after I am finished with making the dataset.

A group critique made me consider a lot more about what would best capture the nature of my blogging journey. I have also received comments that it would be great if I can incorporate some illustrations too. I came up with the germination process as a metaphor, not the most original, surely, but the concept is pretty basic and there is a lot of room to play with.

Photo 18-12-15, 6 48 40 PM

Photo 18-12-15, 6 48 45 PM

Screen Shot 2015-12-18 at 6.47.41 pm

This page was made using the sketch I created on Google Sheets, using a radial treemap as a reference. (Google Sheet is able to generate a treemap chart too – very cool)Photo 18-12-15, 6 48 53 PM

I think having this overarching concept to go along with the visualisation will make my work more relatable and meaningful to others, rather than being this abstract data vis-y thing that people just look at with no clue what it is about.

google sheets

Screen Shot 2015-12-18 at 6.47.30 pm

In the past month, I’ve worked a lot with Google Sheets. It helps me to organise my categories and tags easily.

Due to the scale of the project and the personal, arbitrary nature of journal entries, it can be tedious and tricky to build the database of tags and categories. Here’s how I tagged my entries.

– Tags: subject matter, activity, event, names

After a review of my Sheets, I am on the fence about using Categories as part of the database narrative. Categories are more general than tags, which can be very specific, and as a rule, I categorised my entries based on the general tone/subject matter of the entry, which can be quite tricky because as I’ve said, entries can be arbitrary. I thought about how my dataset could work for me and I find that tags may offer a better solution. A combination of say, tags + time, will project quite interesting visualisations, and definitely more effective as well. Categories would become an extra set of variable, and because they can look rather similar to tags, it would be really confusing too.

Here’s an overview of my Sheets. This is from January 2005 – 2015. There’s a lot of cleanup to be done, for sure.

Screen Shot 2015-12-18 at 6.47.34 pm

Sorting of Categories.

Screen Shot 2015-12-18 at 6.47.37 pm

All the tags, before they are sorted. Tags in the colour columns belong to a bigger category, while those on the left side are more specific.Screen Shot 2015-12-18 at 6.47.39 pmScreen Shot 2015-12-18 at 6.47.41 pmFor my Facts & Fictions final, I narrowed down the categories and tags and worked with these.Screen Shot 2015-12-18 at 6.47.43 pmScreen Shot 2015-12-18 at 6.47.48 pm

Sketches of my visualisation, using Google Sheets.


writing a wordpress theme

Spent the last few days working on making a WordPress theme. Progress could be better if I am not interrupted periodically… but I am quite pleased with where I’ve gotten so far. The screenshots don’t really show much, but I am getting better at understanding how a theme comes together. Also, doing this is a real refresher course on working with PHP again.

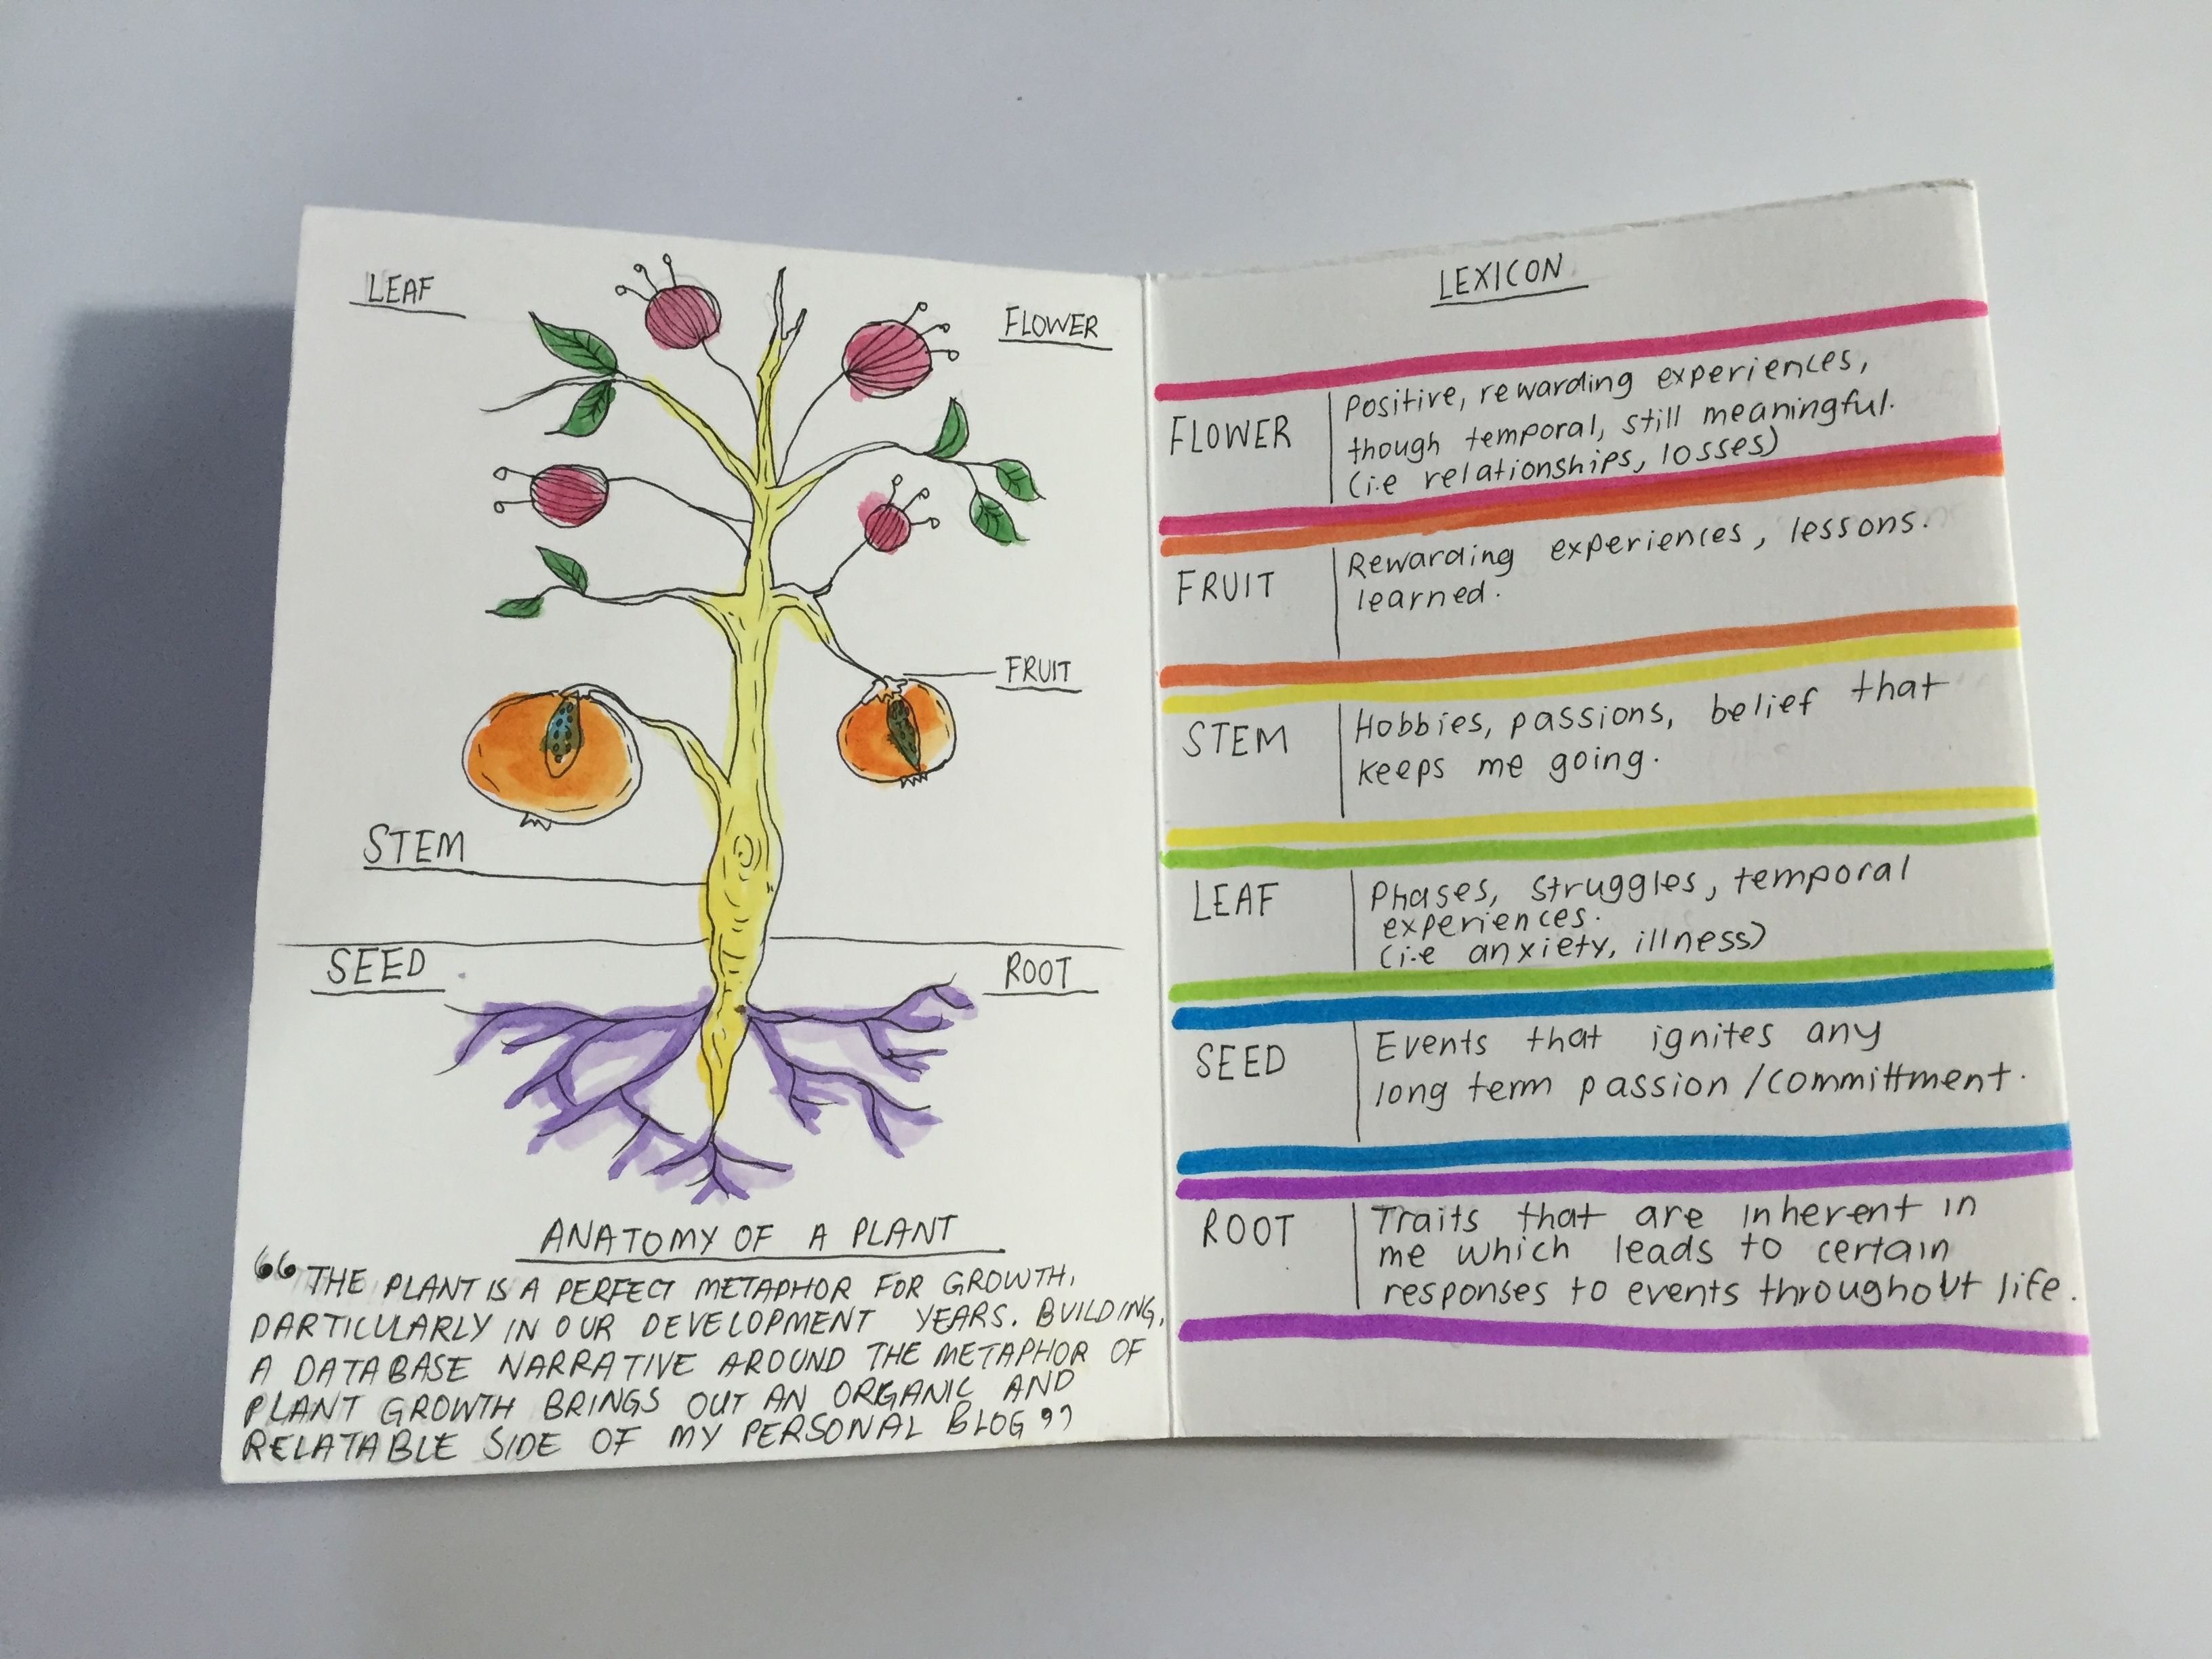
I used the WordPress Codex for help on theme development. Having imported a good percentage of my blog posts for my Facts & Fiction project (the january project) gives me a good base to work with, in terms of theme development. It is definitely useful to have some posts there rather than working on an empty blog. This December, I’ll be working a couple of things: developing the dataset for my blog, create a skeleton theme for the final, and think of a meaningful way to make the data visualisation. The dataset is created by tagging and categorising all my blog entries and forming the database narrative. More on this part on my next entry — I am also excited to show the progress of that part of my project as well as my outcome for Facts & Fictions. All of this will come in the next few days. So many things to do, and I’m eager to share along the way.

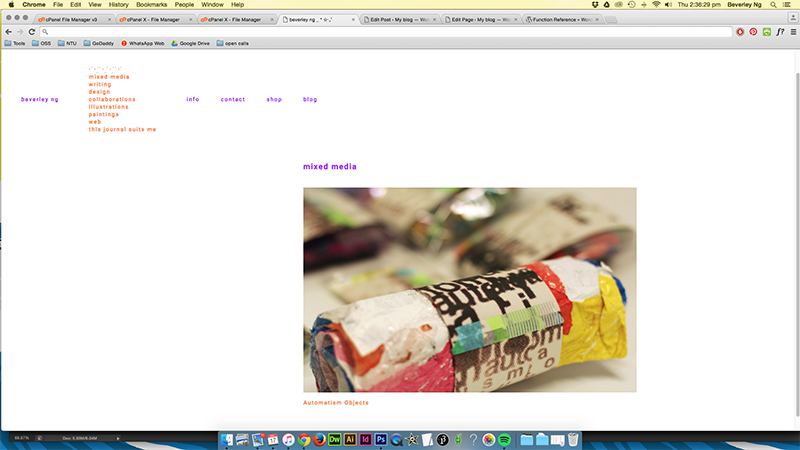
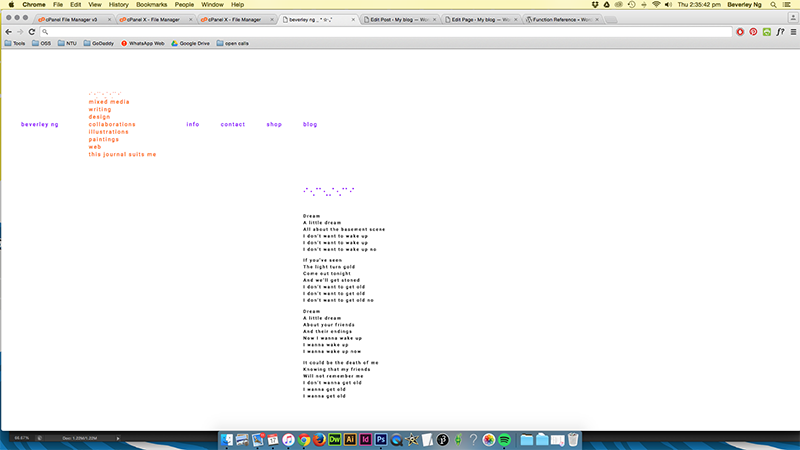
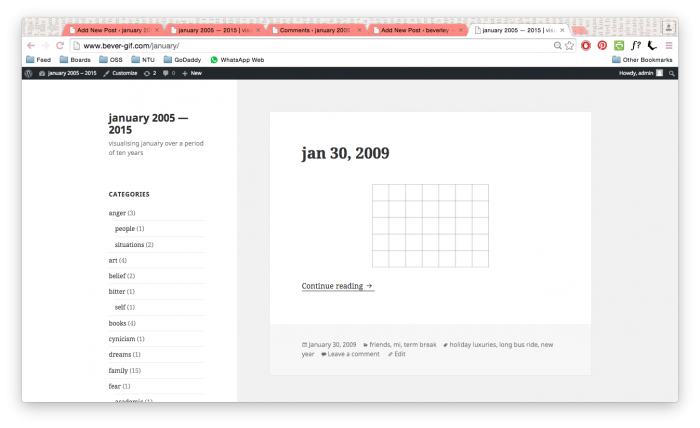
In this screenshot, you can see the very basic skeleton of a theme. At this point, I felt a sense of achievement. Getting the posts and categories to show up. I also added the tag cloud (didn’t have a screenshot), and I could see something developing there, with just January’s worth of entries. I’ve mentioned before that it’s not my intention to share the blog posts, but to use meta data to tell the story. By developing my own theme, I can get down to the specifics, and decide what part of the blog I want to show on the front page. I am able to hide the posts, and work with just the tag and categories.

Screen Shot 2015-12-08 at 6.23.51 pm Screen Shot 2015-12-08 at 6.23.57 pm

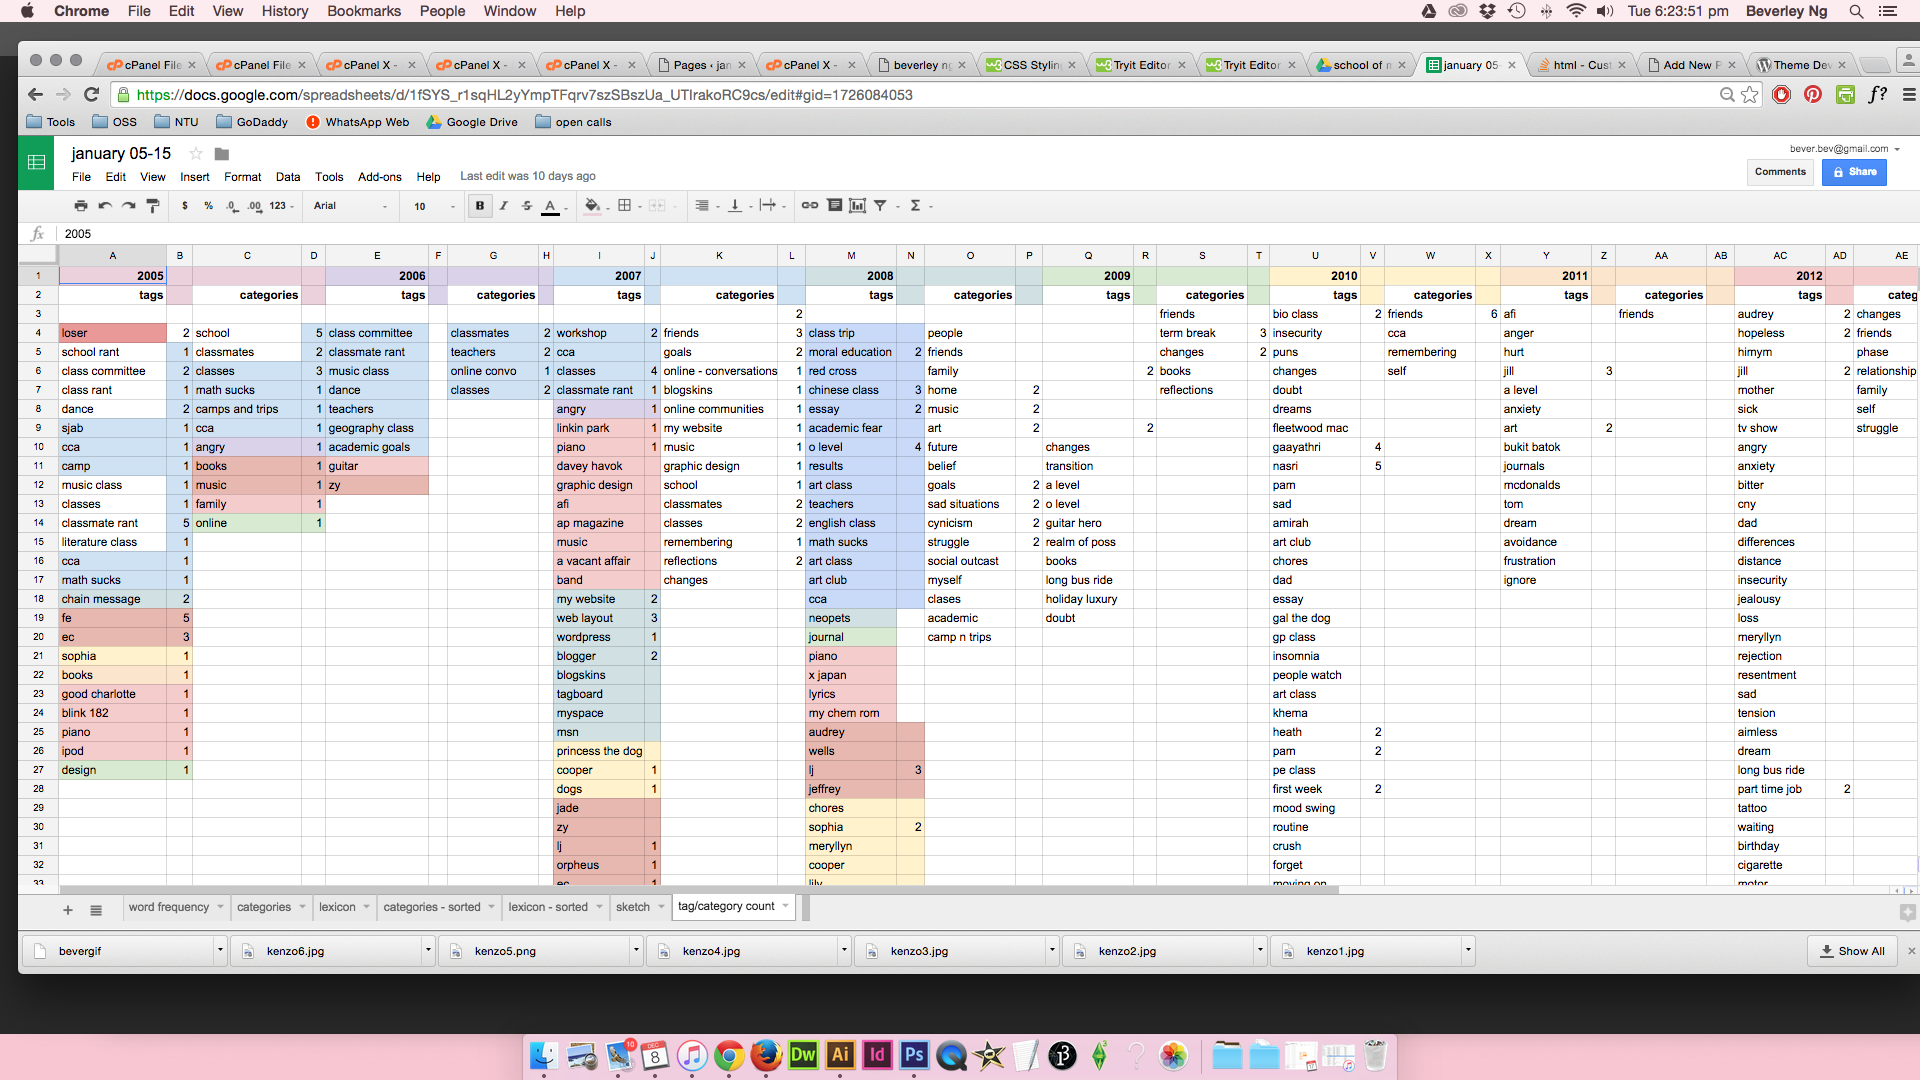
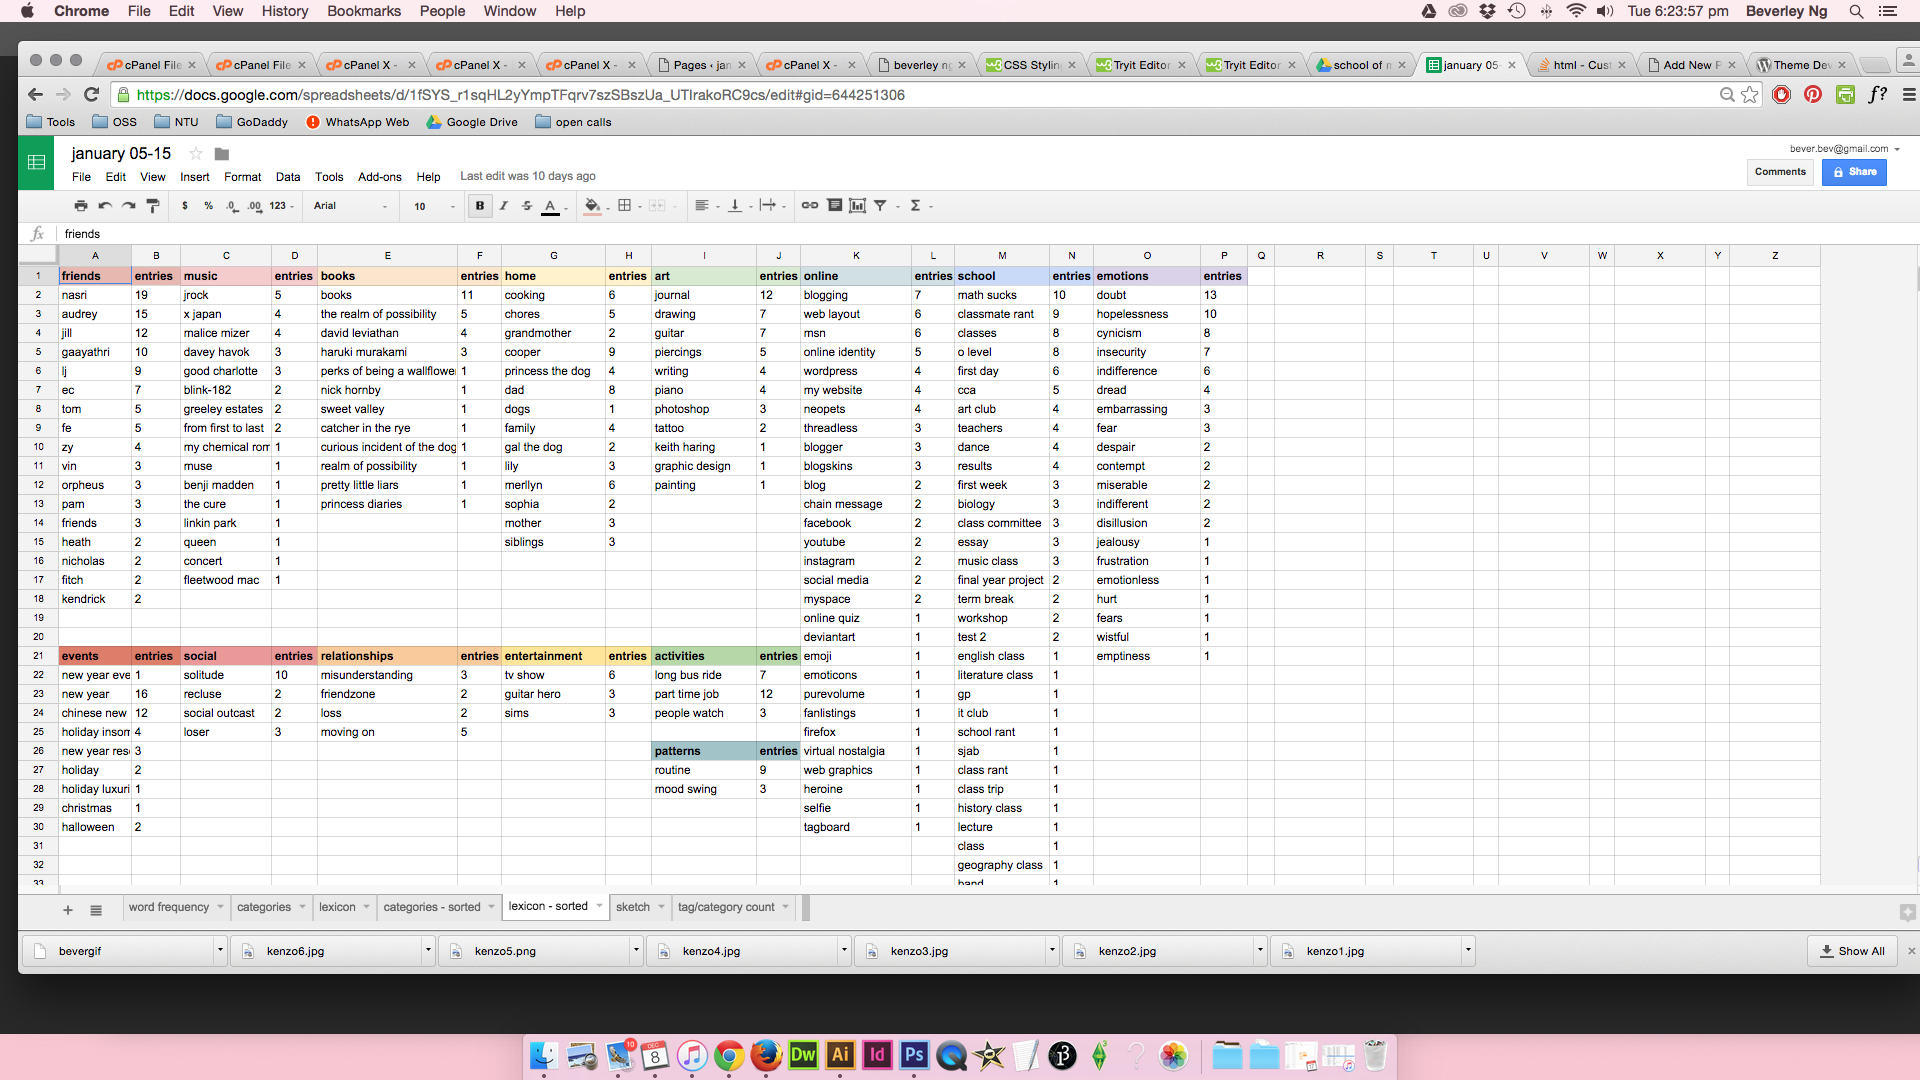
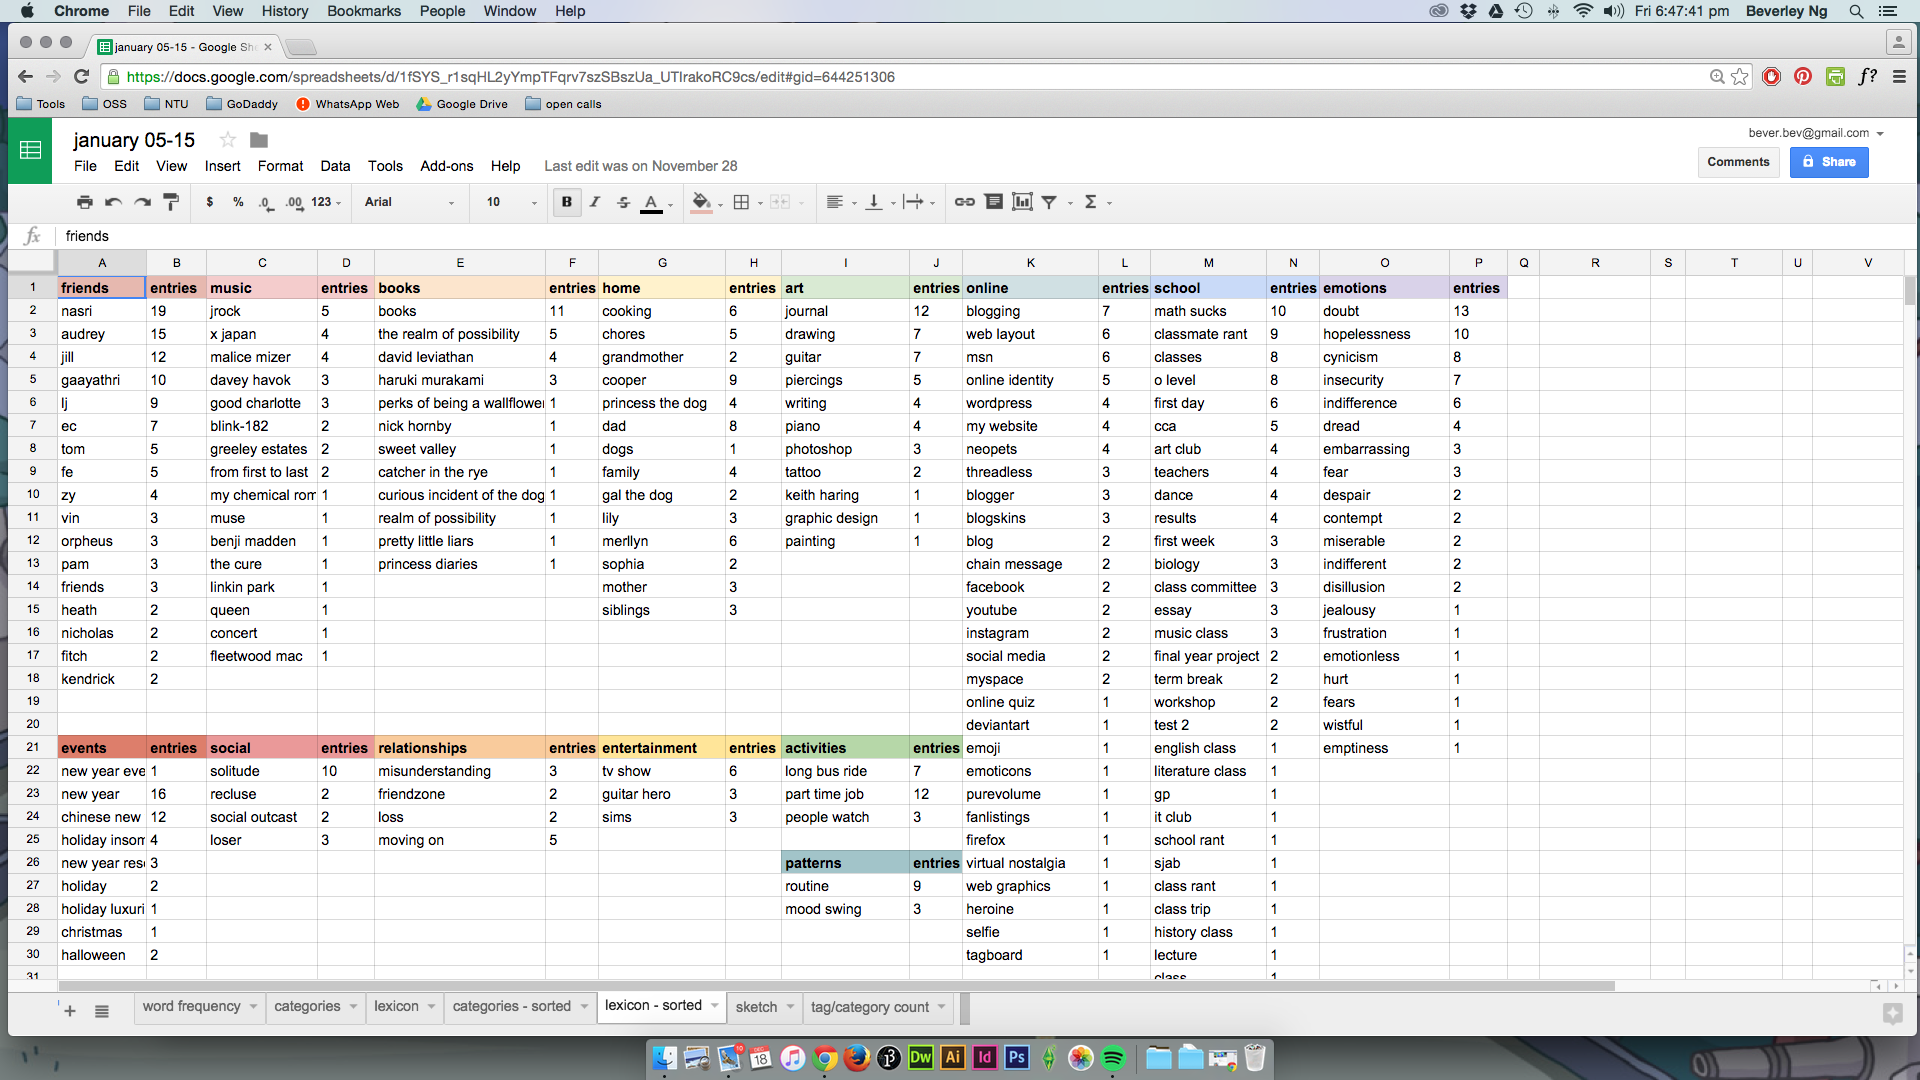
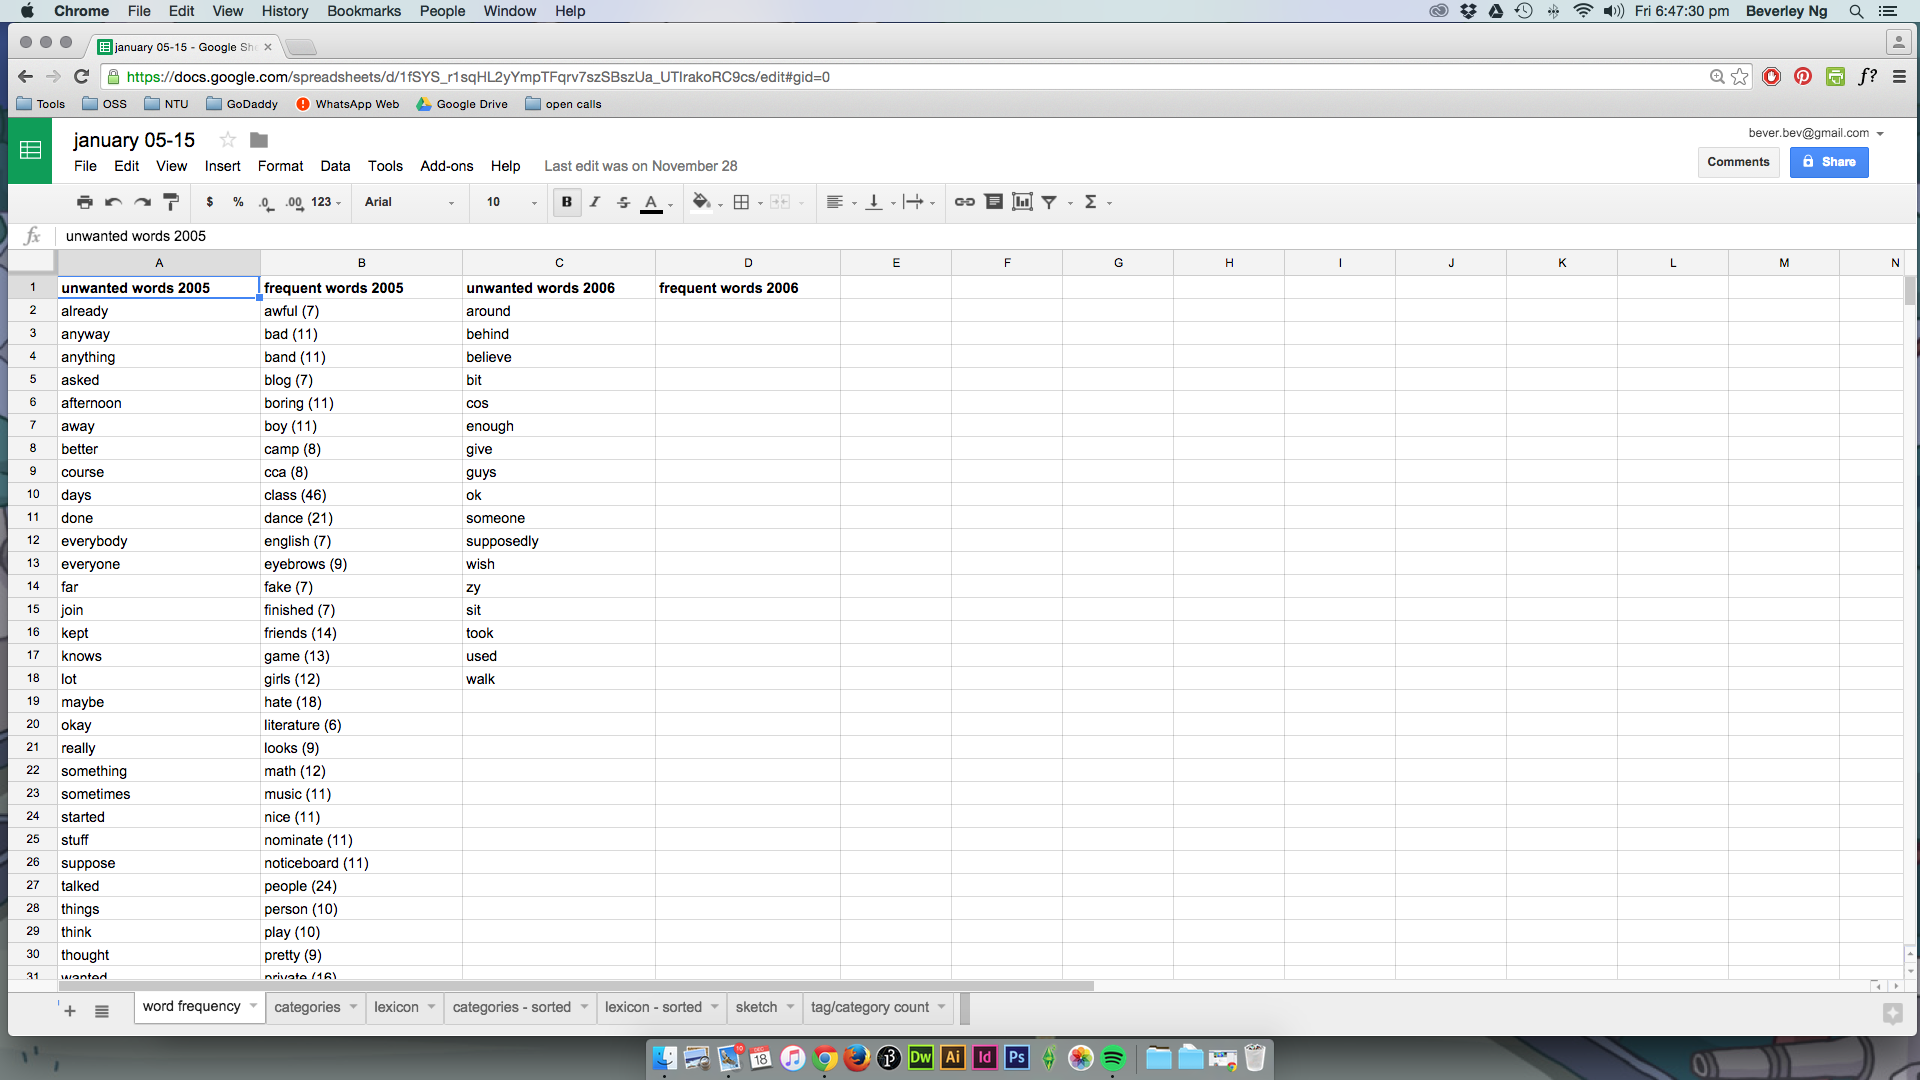
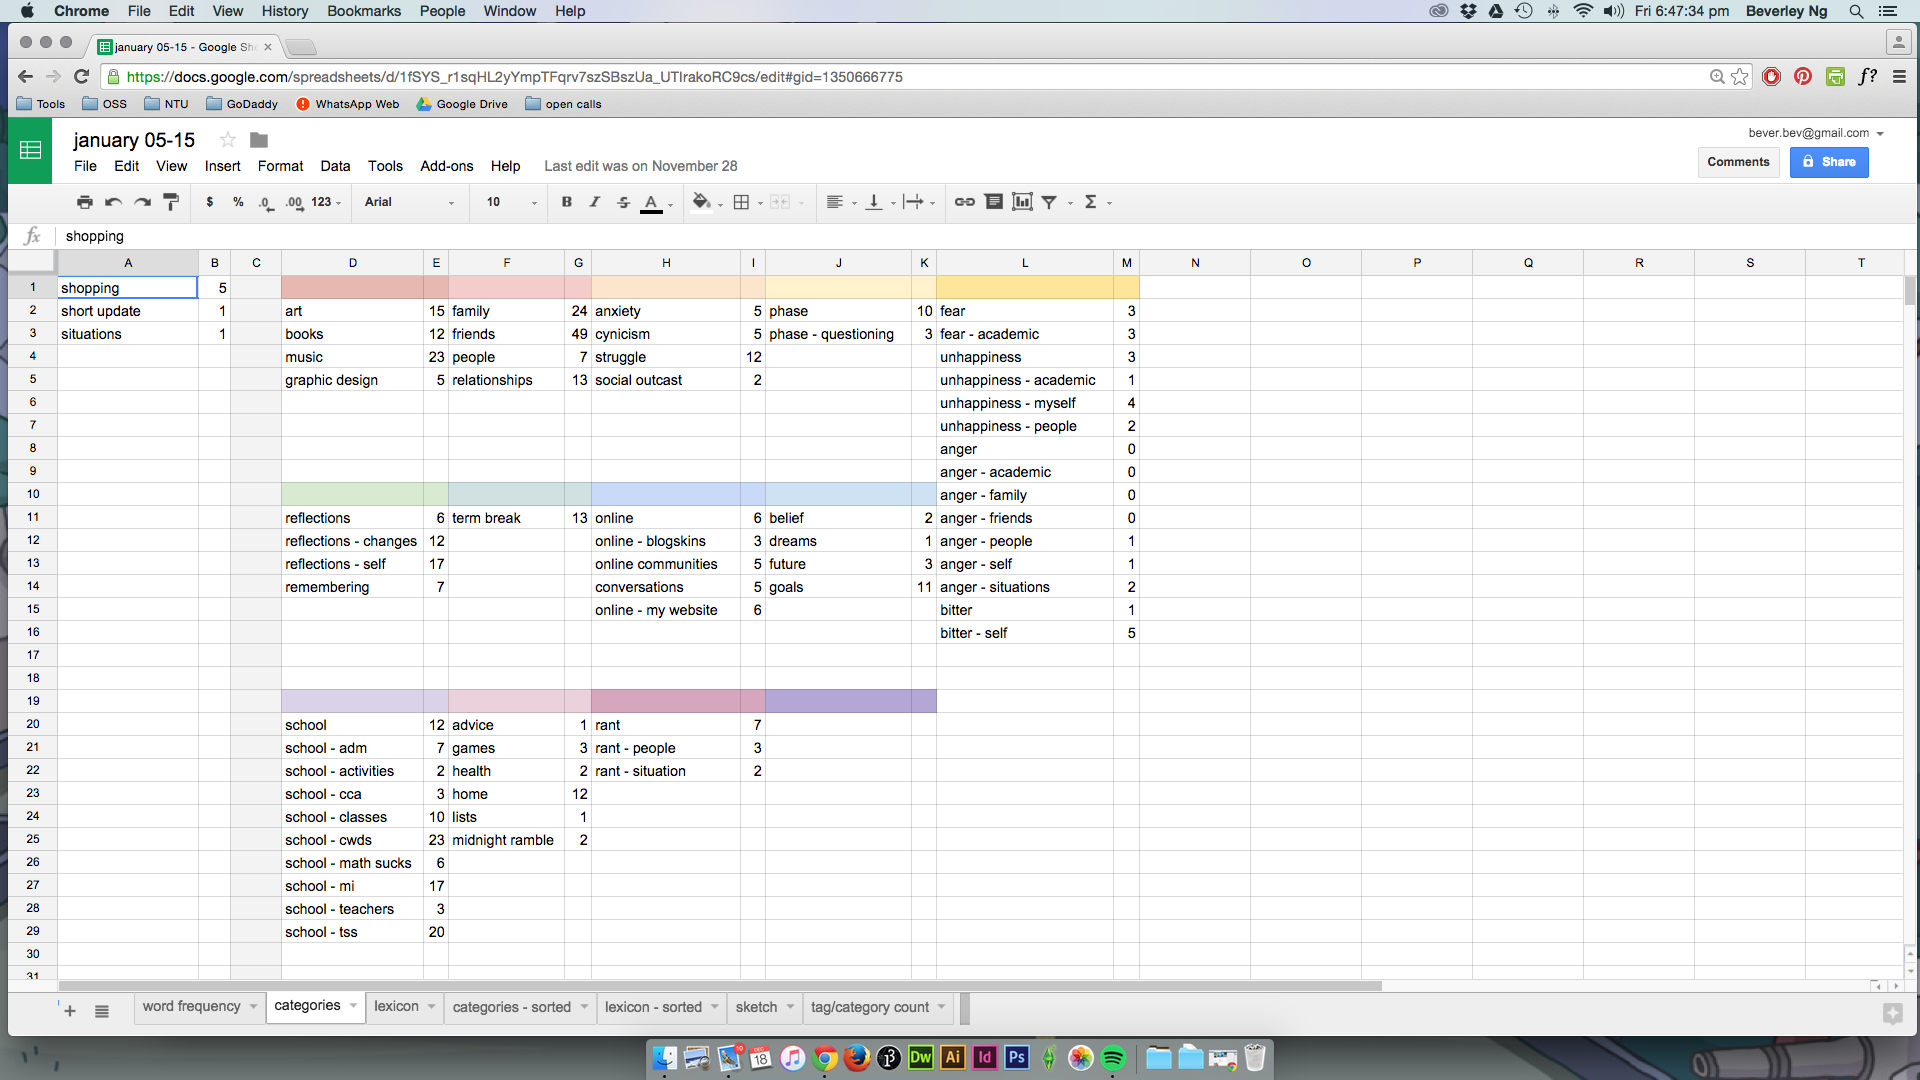
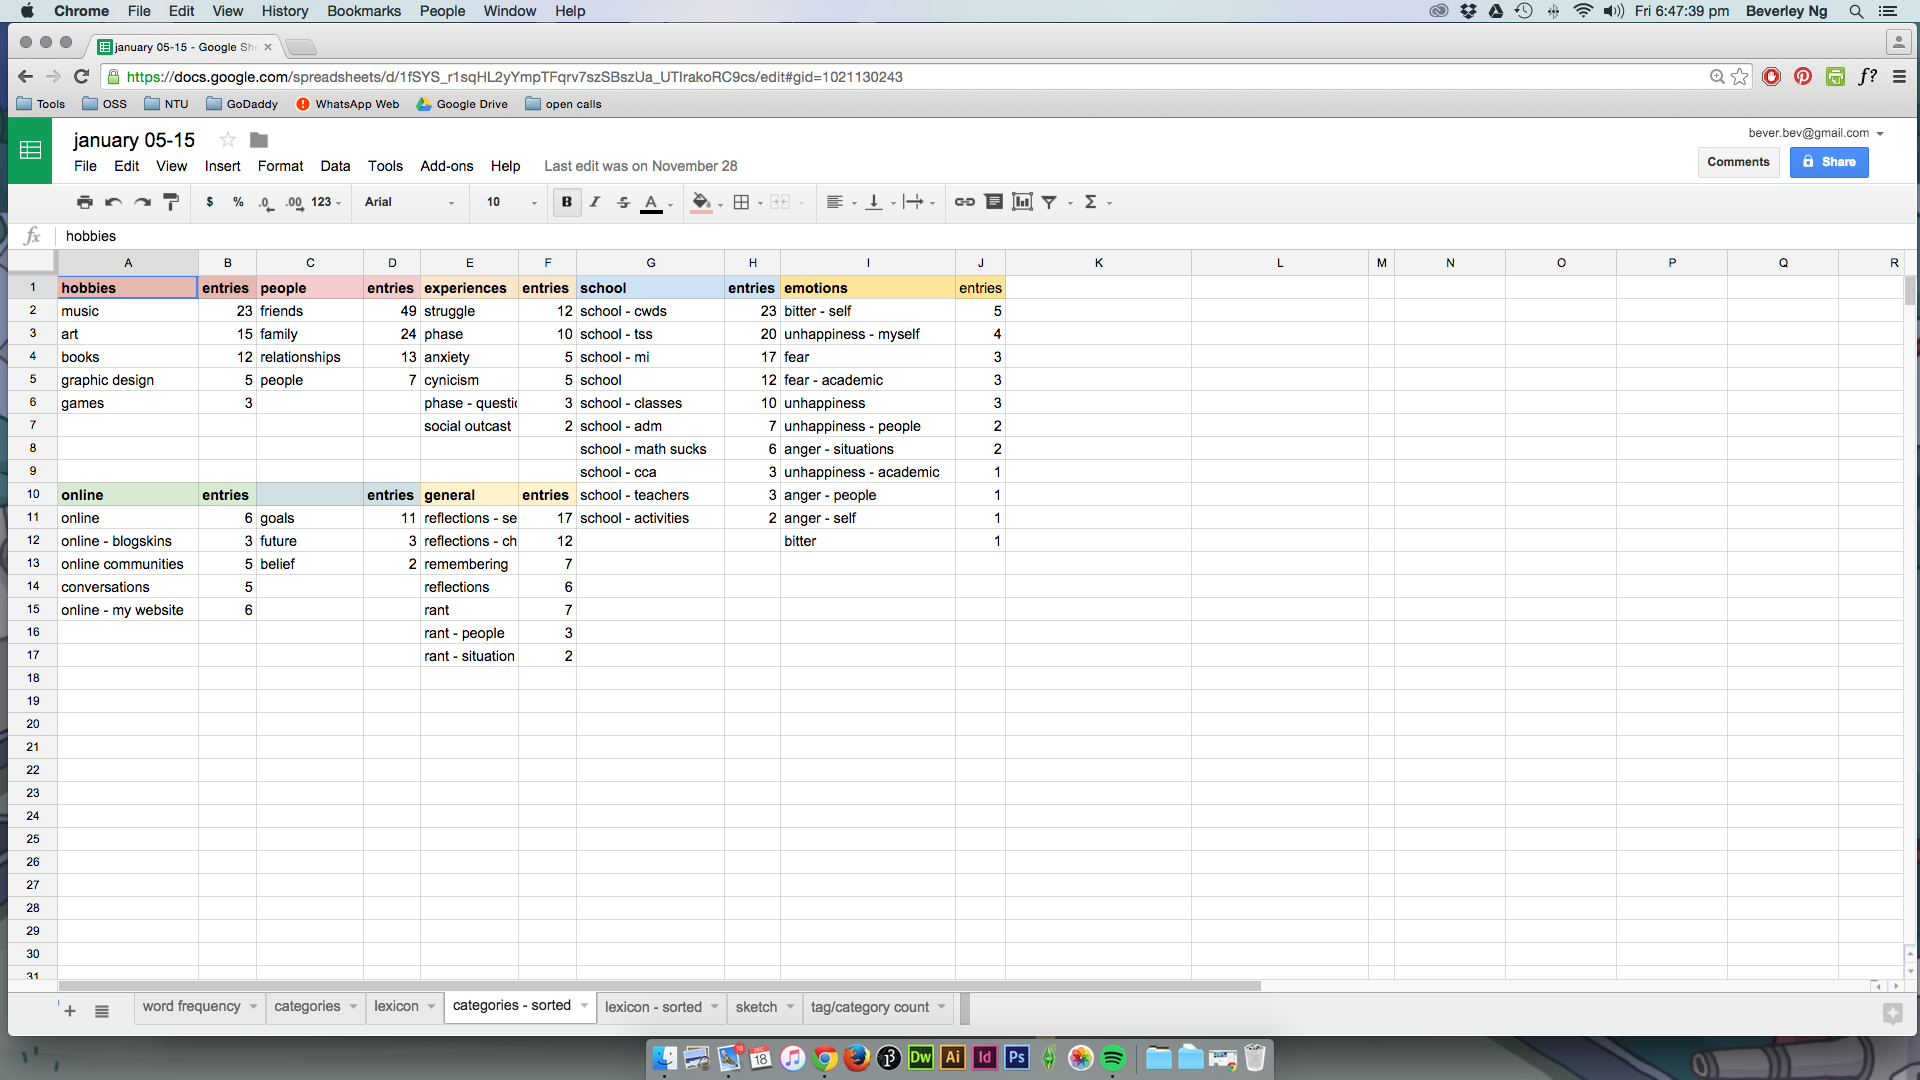
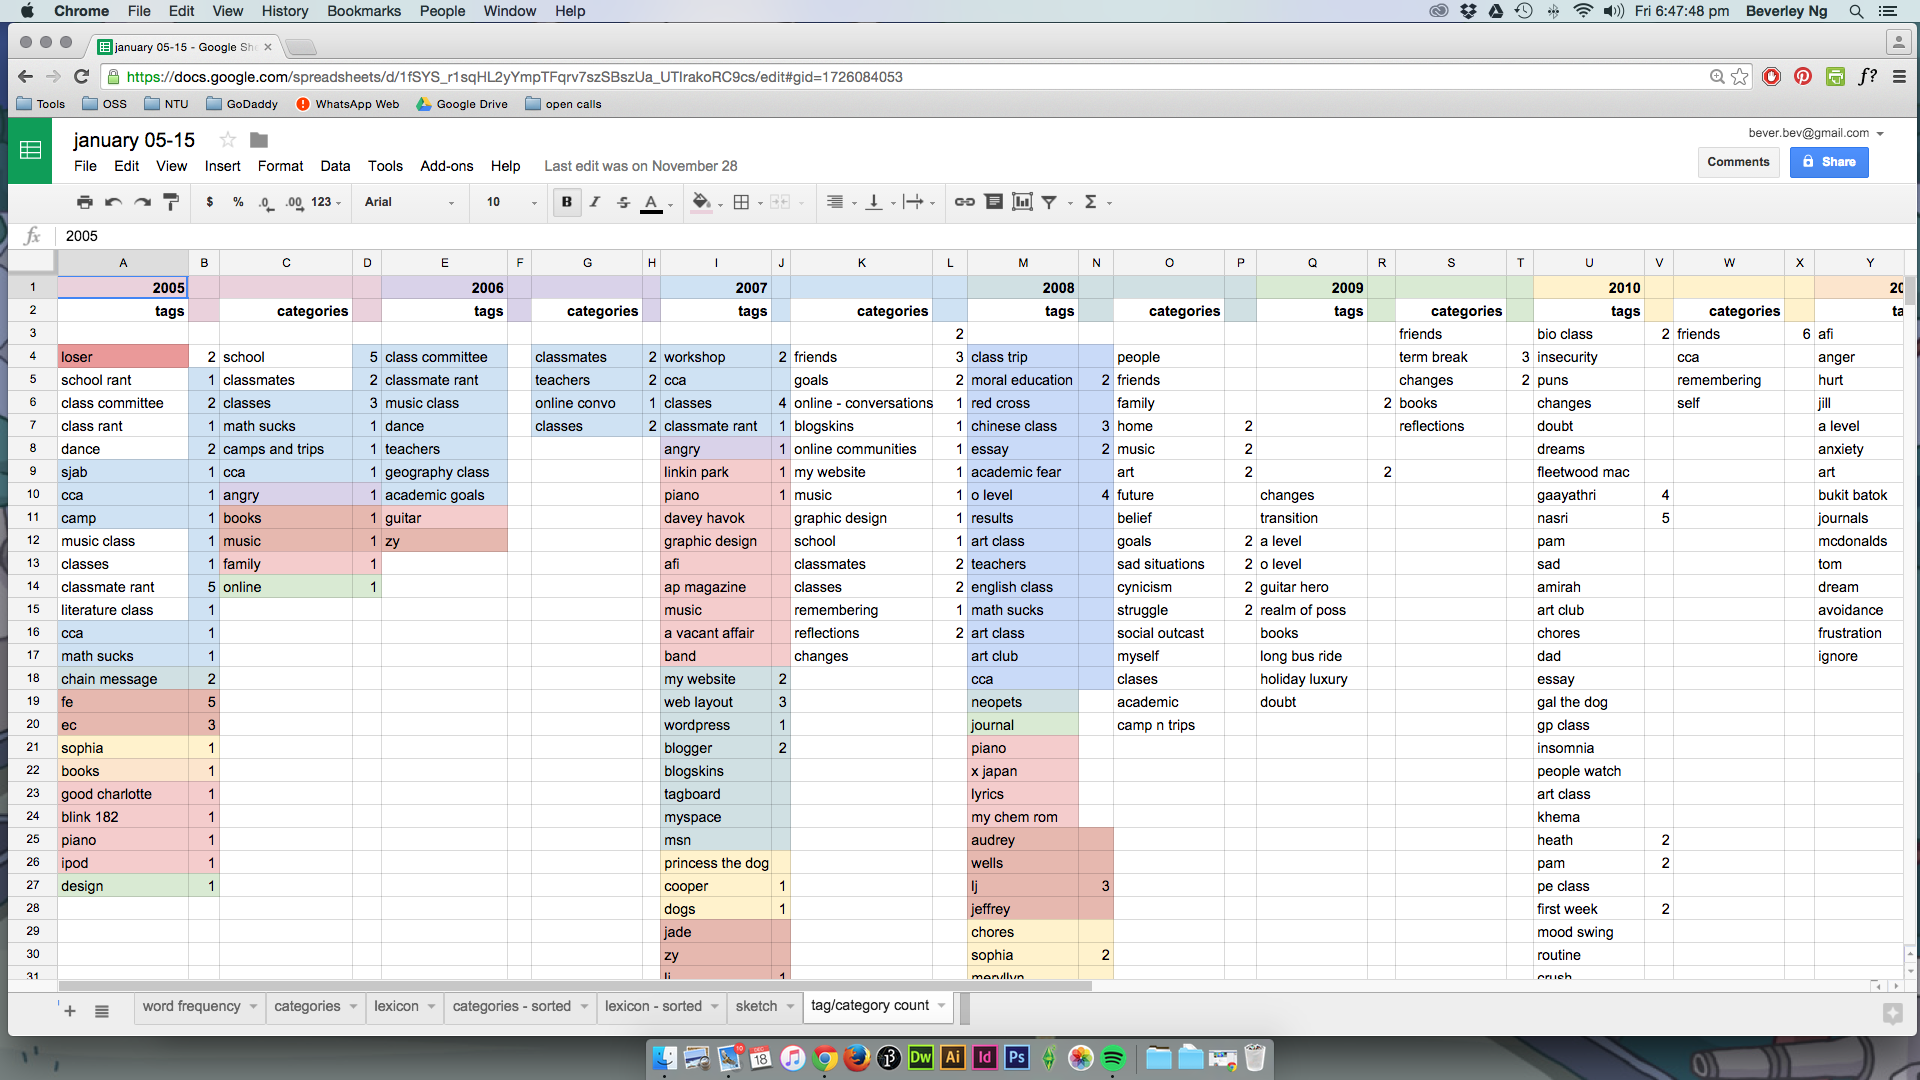
Here are a couple of screenshots from my Google Sheets, which I’ve used for my final project in my data vis course. More on that for the next post. These are the information that I get from important my entries into WordPress. Using WordPress and Google Sheets in tandem is really useful for my process. With this in mind, I am also considering how I would like my physical outcome to look like as well. I’ll think about it as I go along.

Screen Shot 2015-12-08 at 6.05.42 pm

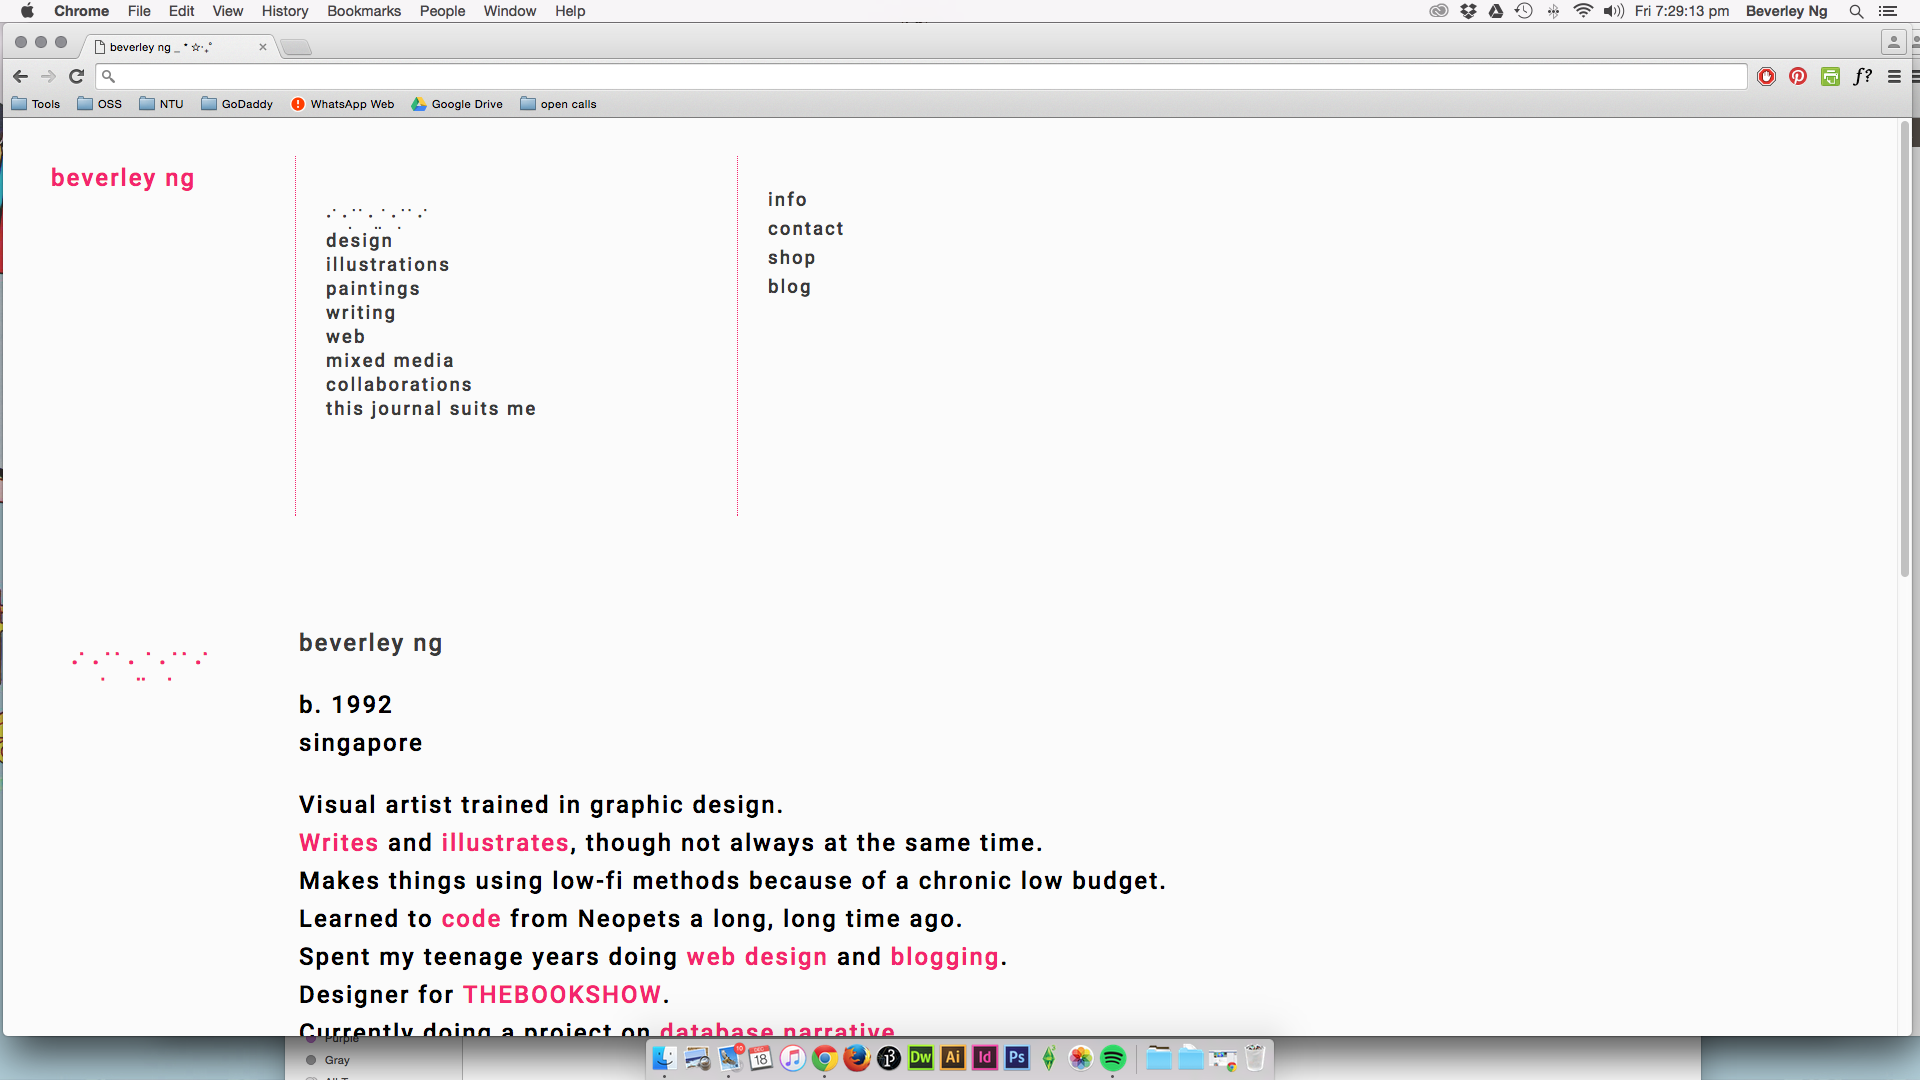
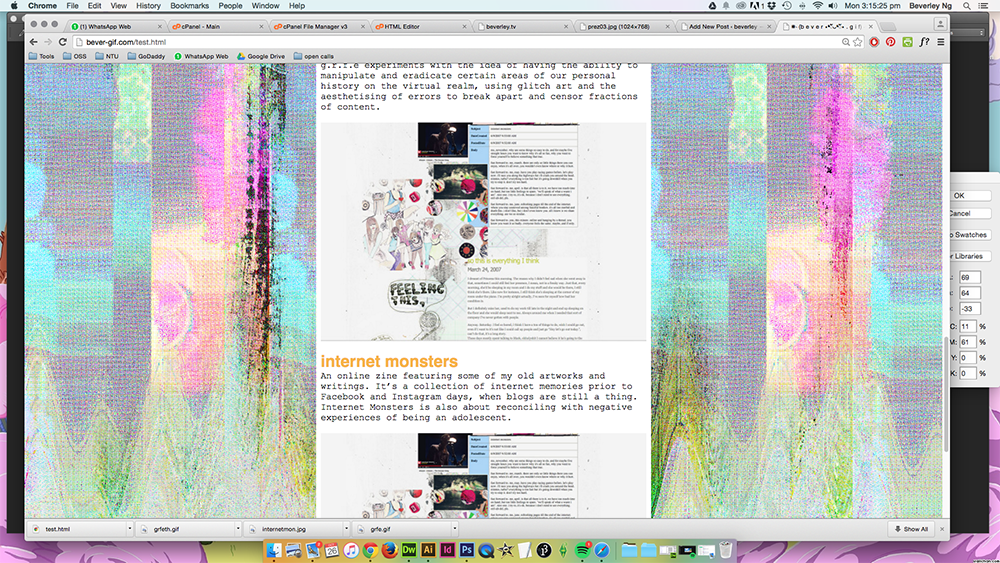
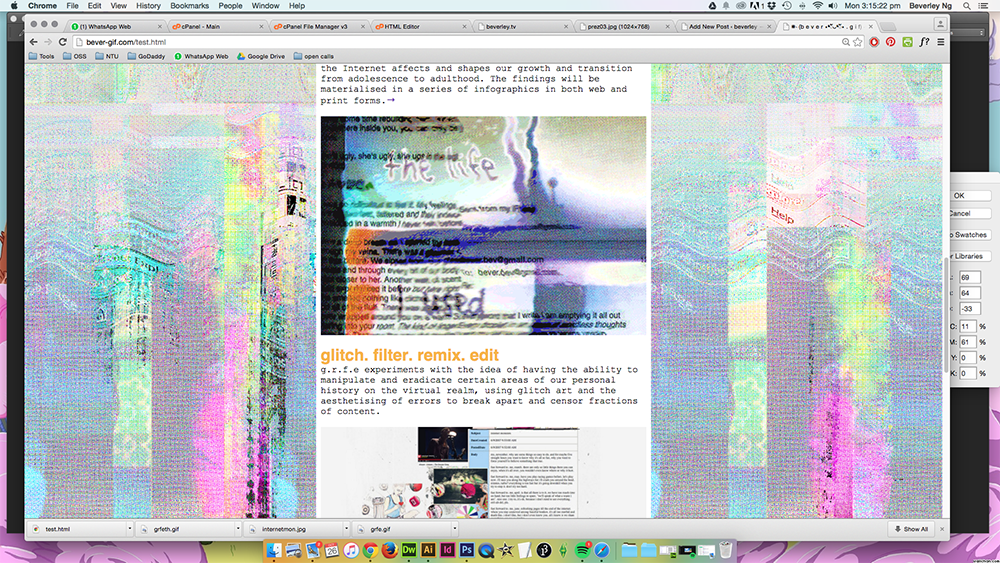
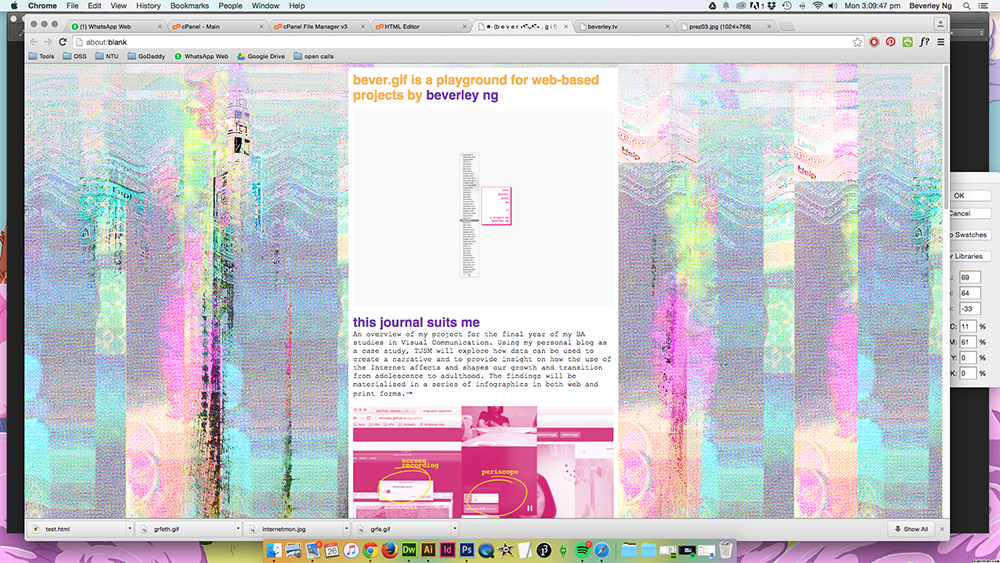
Having built a skeleton theme, I made a copy and installed another blog on my server. As I am also working to revamp my own personal website, I am taking the opportunity to learn more about what I can do with WordPress themes. All of this is good practice for my virtual outcome, and I am trying my best to do as much as I can over this break, while not letting anything I do go to waste. This screenshot shows a WordPress blog with no posts, just pages. What I am doing with this WordPress theme is to put all my content in WordPress pages, which would be a breeze for updating. The php function allows the pages to be displayed as they are on the wp-admin, which is a fantastic option – you can see the various things nested under the parent page of ‘works’ It’s been useful to work on these two sites for now as I explore what I can do with both posts and pages and consider how I can best incorporate their key functions together in my final theme development.

“january” progress

no noo

I’m finished with tagging entries up till 2010, although only entries up to 2009 have been uploaded on the site so far. The rest are on the Textedit file on my computer. I’ve been working with really unstable network connection and it’s driving me up the wall. I think this is one of the drawbacks of moving your work around and doing it on the go.

Also, I am quite frustrated with the amount of spam comments that are generated by my blog, even more so with the fact that Akismet offers the service for a ‘minimal fee’. I went with the free option anyway, but it does not make sense to pay to get rid of spam comments.

On the website, you will see a grid image. It’s meant to be a filler image at the moment. I will be writing a WordPress theme for this website, something close to a sketch I made a while ago. The entries are available for viewing (under the read more tag). I am still interested to have the metadata as the narrative. You can see that my tag cloud is quite specific.

The next step for my project is to plot in the number of entries per category/tag into Google sheets and creating a skeleton for a visualisation using the charts.

I am also paying attention to how I feel as a result on embarking on this project. It didn’t make me feel good to look at my own writing and experience in such close detail. I have the same feelings when I worked on the ‘dictionary’ project last semester. At that point of time, I felt mortified at some of the entries. I become more aware of myself, and that some of my flaws have been apparent for a long time, and I may not have looked into them or addressed them at all. But this are more personal reflections of my project that I think I’m not ready to share right now, without going through a long story about the roots of my angst, etc. I’ve been writing down some of these reflections as I do my work, and I hope to put them together as part of the conclusion for the project. All of this is a work in a progress, my personal self, the project… at the end of the day, I would like to be able to look at this project and know that I have made something good out of what I’m not proud of.


virtual playground

To help provide a more comprehensive overview on what I am interested to explore as an artist, I’ve put together a webpage with links and details to the various small-scale projects I’ve made related to my theme on how the Internet is used to shape our growth as individuals. I call my website a virtual playground. Still in the works, but I think I can put this together quite quickly and be finished by tonight.

Screen Shot 2015-10-26 at 3.17.12 pm

beverley.tv is my final project for Internet Art & Culture where I will share my art-making process via self-broadcasting tools like Periscope and Quicktime screen recording.

Screen Shot 2015-10-26 at 3.15.25 pmScreen Shot 2015-10-26 at 3.15.22 pm

Some projects that I made last semester that led me to explore my concept in finer detail for FYP.

Screen Shot 2015-10-26 at 3.09.46 pm

Lastly, I have a page for my FYP, which is a web version of my presentation.

I hope to make use of my website to convey what I am doing in a more interesting and self-explanatory way. Through this website, I hope to showcase a combination of my skills as well as my interest in long-form storytelling. Each project page is made in a continuous scroll format, which I find very useful in explaining something in detail while maintaining some kind of linear form. The seamless nature of this web layout enhances the viewing experience by omitting any clicking or external functions which I feel is disruptive to the experience.

You can see the work in progress as I update it here.


Processing

I just got my book Design for Information by Isabel Mereilles and some of the data visuals featured in the book makes use of the program Processing. Yesterday I also came across this while looking through Nicholas Felton’s work.

Processing is an open source program that allows one to experiment with coding. It’s like a coding sketchbook, with a particular emphasis on how coding can be used in visual arts. In the next two months, I hope to educate myself with some programming, and really just doing some crash course with online tutorials.

I followed an introduction tutorial on Processing.org, and here’s what I’ve got!

Screen Shot 2015-10-25 at 9.02.35 pm

What I’ve made was a looping circle that follows the mouse’s movement, so by dragging the cursor around, this interesting pattern is made. This is all very exciting, and I hope to pick up on more scripts that will help teach me to creating exciting and interactive visuals.

a bit of reflection

Thoughts about last Friday’s presentation:

Some of the feedback I received from my presentation last week:

  • Add in more images of my own work
  • Add in examples of Dear Data.
  • Add my own questions at the end of my presentation to facilitate Q&A

Some personal feedback:

  • I didn’t practice talking about my project, so at some parts, I might sound clueless, but I was trying to form sentences in my head. I can’t sound too nervous or anxious.
  • Didn’t know I had so much to say, so I need to work on showing what really needs to be shown.
  • Time to edit down!
  • Practice talking about the work to someone. I can write about it, but I get so tongue-tied while talking about it.

I’m currently working to make my FYP presentation online. Not really a presentation, but something that tells people immediately what I am doing.

What I’m doing for FYP review:

As I will be missing the review, I will be making a prerecorded presentation. Q&A will be done via a live skype session.

What I will do when I’m away:

I have some plans to document my journey there, especially the workshops and what I’ve learned from the artists during the program. In addition to posting here, I will also be doing vlogs. I think these can be a more enticing way of recording my process. I do enjoy making videos with Periscope, so I think I will definitely be doing more video documentations when I am in Berlin.

Hope to post my FYP online tomorrow!