virtual playground

To help provide a more comprehensive overview on what I am interested to explore as an artist, I’ve put together a webpage with links and details to the various small-scale projects I’ve made related to my theme on how the Internet is used to shape our growth as individuals. I call my website a virtual playground. Still in the works, but I think I can put this together quite quickly and be finished by tonight.

Screen Shot 2015-10-26 at 3.17.12 pm

beverley.tv is my final project for Internet Art & Culture where I will share my art-making process via self-broadcasting tools like Periscope and Quicktime screen recording.

Screen Shot 2015-10-26 at 3.15.25 pmScreen Shot 2015-10-26 at 3.15.22 pm

Some projects that I made last semester that led me to explore my concept in finer detail for FYP.

Screen Shot 2015-10-26 at 3.09.46 pm

Lastly, I have a page for my FYP, which is a web version of my presentation.

I hope to make use of my website to convey what I am doing in a more interesting and self-explanatory way. Through this website, I hope to showcase a combination of my skills as well as my interest in long-form storytelling. Each project page is made in a continuous scroll format, which I find very useful in explaining something in detail while maintaining some kind of linear form. The seamless nature of this web layout enhances the viewing experience by omitting any clicking or external functions which I feel is disruptive to the experience.

You can see the work in progress as I update it here.


Processing

I just got my book Design for Information by Isabel Mereilles and some of the data visuals featured in the book makes use of the program Processing. Yesterday I also came across this while looking through Nicholas Felton’s work.

Processing is an open source program that allows one to experiment with coding. It’s like a coding sketchbook, with a particular emphasis on how coding can be used in visual arts. In the next two months, I hope to educate myself with some programming, and really just doing some crash course with online tutorials.

I followed an introduction tutorial on Processing.org, and here’s what I’ve got!

Screen Shot 2015-10-25 at 9.02.35 pm

What I’ve made was a looping circle that follows the mouse’s movement, so by dragging the cursor around, this interesting pattern is made. This is all very exciting, and I hope to pick up on more scripts that will help teach me to creating exciting and interactive visuals.

Research Critique: Feltron Annual Report

FAR07_02 FAR07_03 FAR07_05 FAR08_02 FAR08_03 FAR08_04 FAR12_02 FAR12_03 FAR12_04

(images from Nicholas Felton’s website)

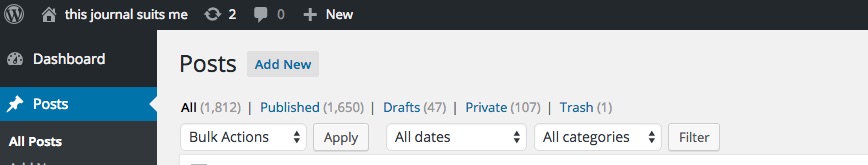
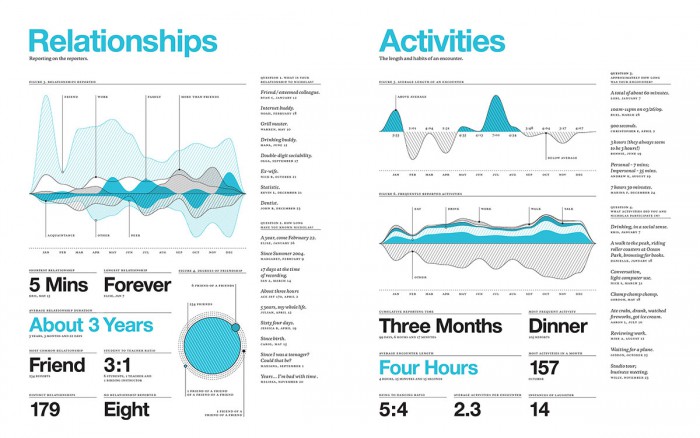
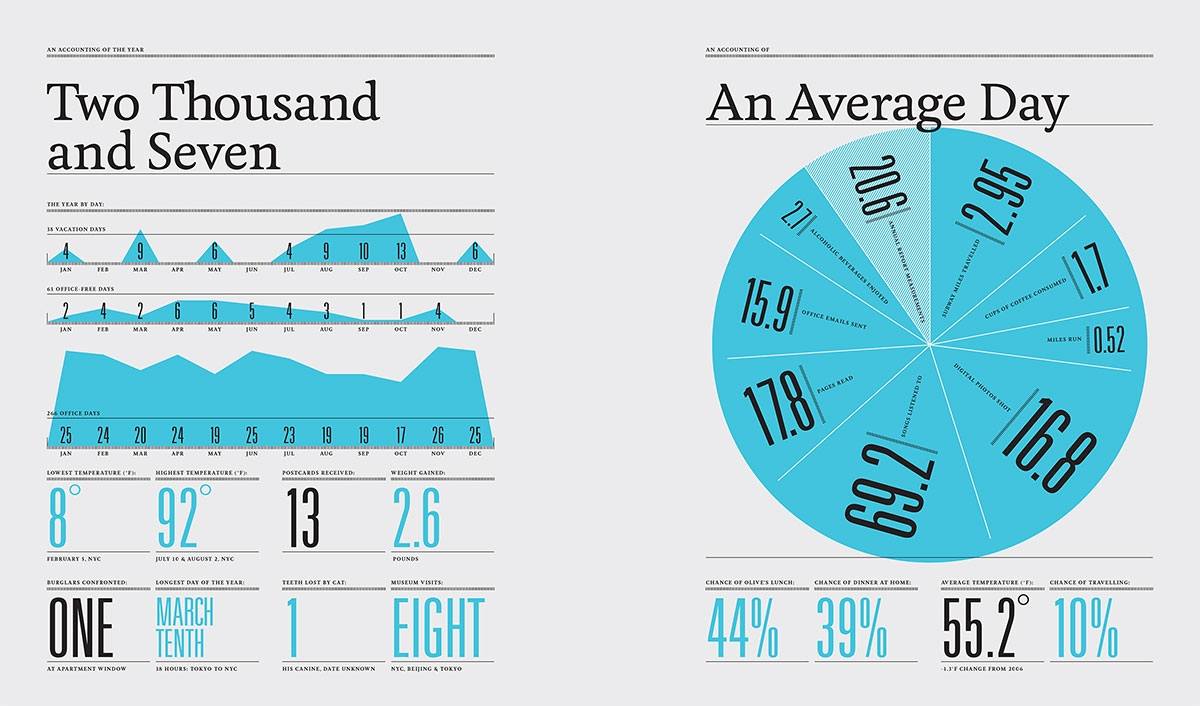
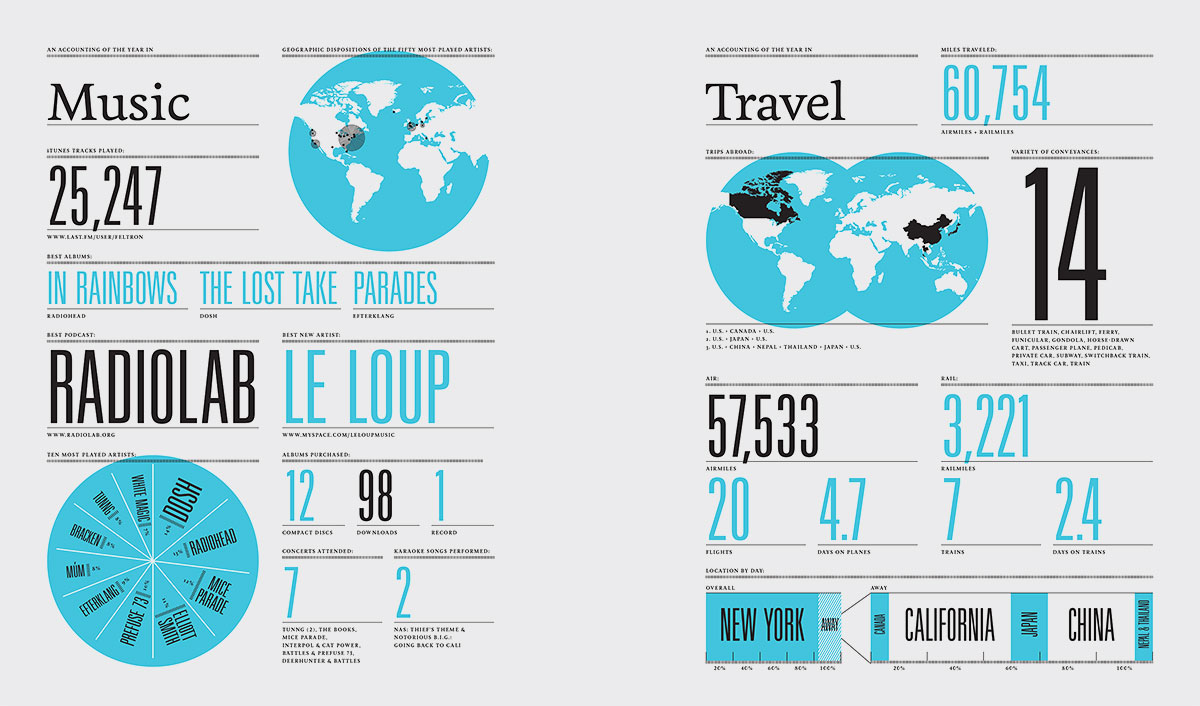
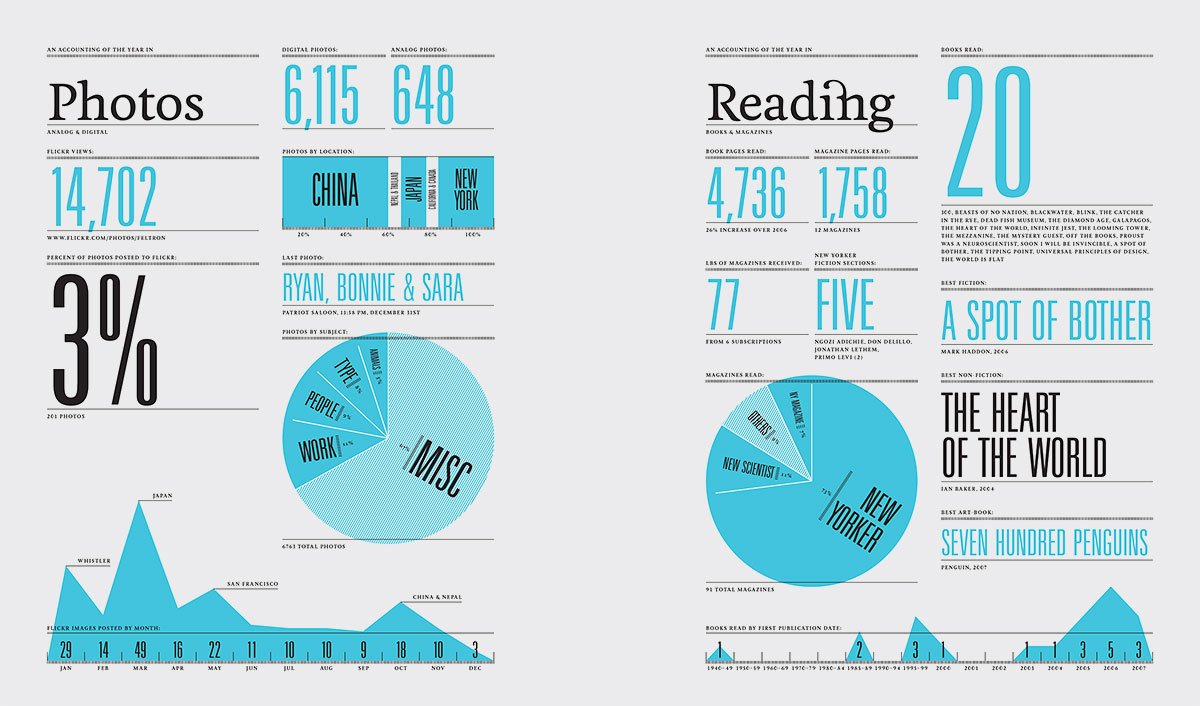
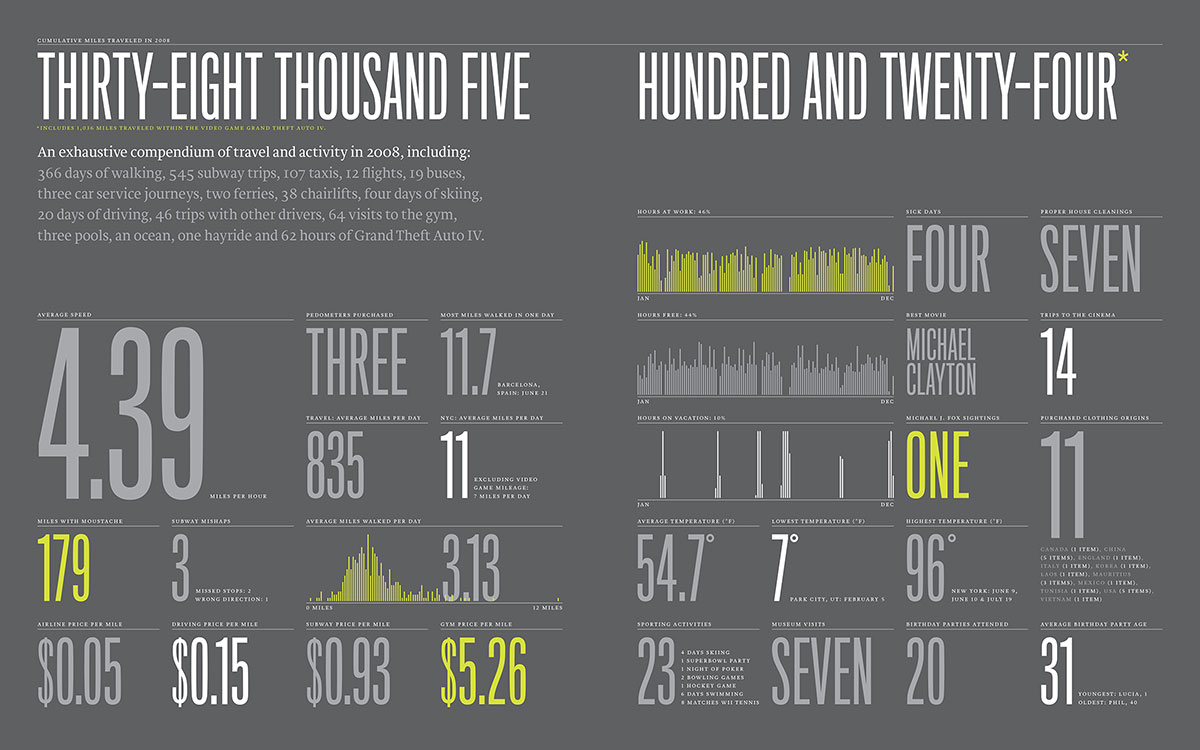
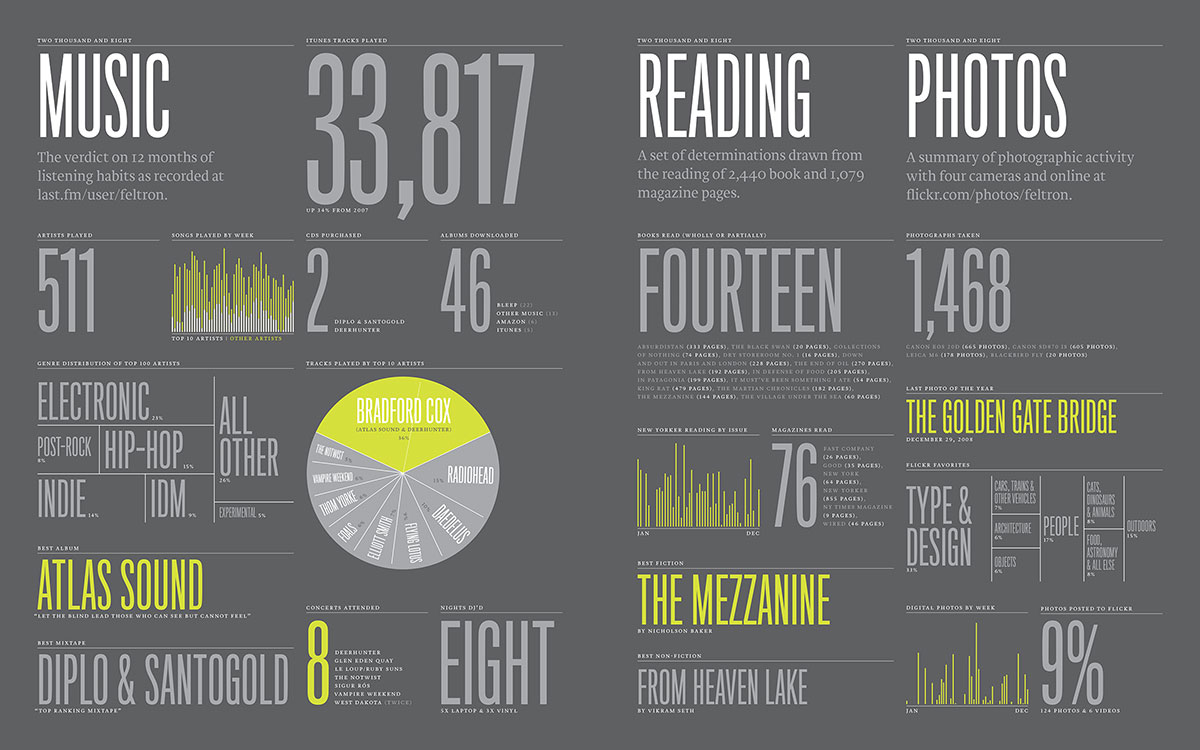
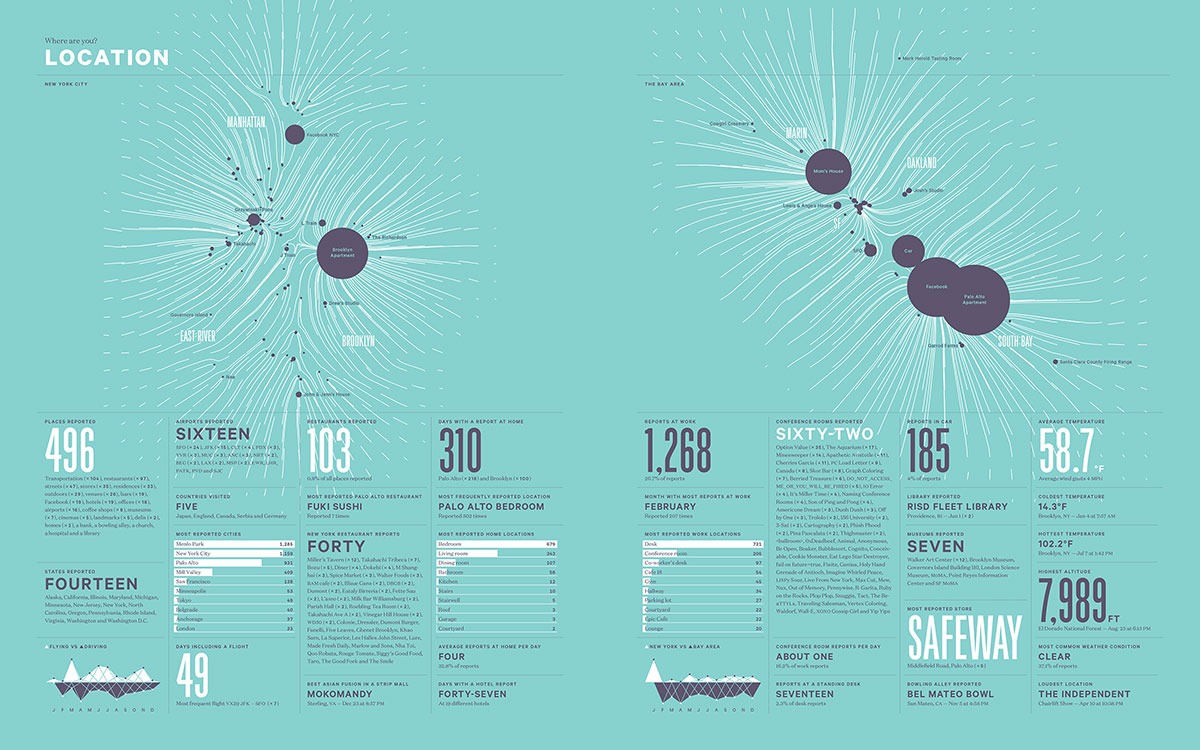
Since 2005, Nicholas Felton have been collecting data on almost every facet of his life and presenting his findings in a series of beautiful graphical posters. Each poster focus on the statistics that makes up a topic. For example, while looking in to his relationships, he breaks down the frequencies he meet people, who he communicates with most often, the amount of time he spends socialising and more. All of these data is presented in a variety of graphs and charts. Through this project, Felton hopes to explore how to graphically encapsulate a year.

Felton is inspired by the concept of annual reports, which are often generated by corporate companies at the end of each business year, as a comprehensive document that charts the company’s activities, earnings and progress. The Feltron Annual Report project is a very refreshing and humorous take on a typically corporate documents. Through my part-time job, I’ve had the opportunity to work on annual reports before, and truth be told, they are not the most interesting project to work on. Looking at Feltron’s Annual Reports really made me think of the annual report in a totally new way.

Felton’s approach to making these personal reports is exactly what I hope to do with my own blog, conceptually. He pairs the impersonal, corporate style of annual reports with personal details of his life, and through the various infographics embedded in each poster, we piece together activities and life in each year. It is a really brilliant example of how data can be used to tell a story.

FAR09_03

What I also observe in this work is that Felton weaves in his sense of humour in this work, which you can see from the titles he give to each statistic group. “Most Common Relationship? Friend.”

Felton uses a variety of tools to help him log in data: some are apps which are available commercially, and some he built himself. He also acknowledges that while it is possible to collect data on almost everything, what can be done with the data is almost endless.

“The data set itself was messy and overwhelming, and filled with enough information for several more reports. There are inherent shortcomings (like the unrepresentative amount of water recorded), and endearing strong suits (like the exploration of mood).”

Felton on report 2009

In the span of this ten year project, each report progressed from collecting information about everything to focusing on just one area. For example, in the report 2013, Felton explores his communication data, which breaks down his usage patterns from sources like texting, calling, emailing and being on social media. In the report 2011, he explores how his personality varies in different settings or with someone.

Overall, I find the Feltron Reports a very inspiring way for me to look at how I can work with the data from my blog for each year, by highlighting some of the more interesting details and experiences. I also observe that he each year, his infographics take on a fresh, new style. This also inspires me to use graphic design as a way to sum up my year, and to include (in a subtle way) my graphic influences along the way. I think it can be part of my narrative as a visual artist.


Project Hyperessay #1: Concept


The title of my project is beverley.tv.

Through this project, I’ll like to rethink the concept of webcam in our everyday lives. All of us now have access to an inbuilt webcam on our laptops, but few of us use the webcam to broadcast or record the nitty gritty details of our lives. Instead, we use our mobile phones to capture these details. We turn to social media to share every part of our lives, through text updates and pictures, and more often than not, we gain validation through comments and likes. We willingly give ourselves up to surveillance and allow the portraits of ourselves to be painted by other people when they view our carefully curated profile. Most of us use social media enough to notice the patterns and behaviours we take on when we go online: we share a lot, but we also conceal a lot, all to build and curate an online persona or what we hope others perceive us as.

For my project, I would like to open up my process of making art public to the audience in an unrepressed and informal manner, while making use of social media platforms and its functions to aid my project.

My broadcast will combine two kinds of filming and recording to document my artistic process: using the mobile application Periscope and Quicktime player’s screen recording function. The two filming methods is a contrast against each other, inspired by the concept of private vs public. Periscope works by using your mobile camera to film live footage of your surrounding and sharing it with an international audience, whoever happens to be online and tuning into your channel. It also includes a live commentary function, where you can see viewers responding to your broadcast and giving “hearts” in appreciation. Quicktime’s screen recording is an in-built function that records your actions on the screen. The screen recording records all the actions that take place on the screen. I use it as a form of broadcast as it offers a private and genuine way of documenting the art process, as it records all the subtle actions I do on-screen as part of the work: whether it’s a pause during typing, backspacing, deleting — these are all little details that offer a glimpse of the thought process, and how everything comes together to form a final piece of work.

As an artist, I find that documenting the process is just as important as making the work. I am a firm believer in the saying that it’s the journey that’s important, and not the destination. Documenting my process at each step of the way is akin to making sketches in a notebook: it allows me to go back and see what I have done, what works and what didn’t.

The concept of private vs public is rarely explored in the realm of art, particular the relationship between the artist and the viewer. Little interest in shown towards getting to know the artist and the process, and often the attention is on the work itself. Through my work, I also want to highlight that making mistakes is part of the process. A lot of times, most creatives tend to keep this part of the art-making process hidden and not shown to the public. There are also other habits that creatives keep hidden because they feel embarrassed about it. Through my work, I offer an uninhibited view into the process of making a piece of work.

The project is also influenced by the reading ‘Webcams: The subversion of Surveillance’ by Steve Dixon. The article explores the use of webcam as an electronic eye to our personal lives, and potential exploitation of privacy and intimacy. The reading also uses an example of a group of artists who use the webcam to document their processes, turning their studio into a Web installation. The webcam is also described as a camera which produces “low-resolution, grainy” footage and it’s static effect also lends it a stern, surveillance quality.

jen02 jen01

Jennicam (1997)

Jennifer Ringley’s work Jennicam is an inspiration for my project. She lives her life out in front of the camera, and it records her activities from the mundane to the intimate. My takeaway from the work is that her documentation of her life is definitely realistic. Her setup of her cameras also provide insights to her life through various perspectives, by setting up cameras in every room and from all angles.


a bit of reflection

Thoughts about last Friday’s presentation:

Some of the feedback I received from my presentation last week:

  • Add in more images of my own work
  • Add in examples of Dear Data.
  • Add my own questions at the end of my presentation to facilitate Q&A

Some personal feedback:

  • I didn’t practice talking about my project, so at some parts, I might sound clueless, but I was trying to form sentences in my head. I can’t sound too nervous or anxious.
  • Didn’t know I had so much to say, so I need to work on showing what really needs to be shown.
  • Time to edit down!
  • Practice talking about the work to someone. I can write about it, but I get so tongue-tied while talking about it.

I’m currently working to make my FYP presentation online. Not really a presentation, but something that tells people immediately what I am doing.

What I’m doing for FYP review:

As I will be missing the review, I will be making a prerecorded presentation. Q&A will be done via a live skype session.

What I will do when I’m away:

I have some plans to document my journey there, especially the workshops and what I’ve learned from the artists during the program. In addition to posting here, I will also be doing vlogs. I think these can be a more enticing way of recording my process. I do enjoy making videos with Periscope, so I think I will definitely be doing more video documentations when I am in Berlin.

Hope to post my FYP online tomorrow!


data visualising references + progress

datavis01 datavis02 datavis03

Here’s a good link that I am going to bookmark for when I get a hang of javascript. This gallery on Github displays a great variety of data visualising scripts. I have not figured out how they work, specifically, but they all come with some very handy tutorials.

I find this to be a wonderful alternative to building a WordPress theme from sketch. I mentioned in my previous entry that I have trouble importing all of my blog posts to my own server, so I cannot make use of the WordPress plugins anyway, as a large percentage of my entries will not be accounted for.

I spent the day drawing out some general statistics from January 2005 – May 2005. Here’s a sample:

word01

I did this for each month.


My main purpose for doing this is to sieve out the metadata so that I can tell a story with these figures and tags. I don’t intend to show any of my blog entries, as I feel that they don’t necessarily describe my relationship with blogging. Also, working with metadata helps to build my work around the bildungsroman theme by offering a bird’s eye view of the topics that I write about, taking into account the frequency of details like exclamation points (which I later renamed to “emotional punctuation”) after I notice that I used to end my sentences with lots of !!!!! and !?!!?!??!? whenever I feel frustrated. Words can also be associated with certain kind of lingo which will define some of my hobbies, like ‘skin’ and ‘layout’, for example. These words were used to describe the my blog themes then.

I find some of the examples of data visualising techniques on the Github gallery are pretty engaging. They also look really amazing. I think that I can definitely work the script to my advantage and incorporate my illustrative style to make my work more engaging.

wordpress process


Yesterday I wrote down a basic list of statistics that I want to compile for every month. I googled for some WordPress plugins that might help do the trick, although another problem I face is that my blog is hosted free on WordPress, which doesn’t grant me the capability to run open source plugins. So I migrated my site to my own existing server, but I ran into another problem: the number of posts on both the free WordPress site and my own site does not tally.fk01

Above: My hosted site WP admin.

I’ve exported all the necessary files and some of the posts got missing, and not just some… but over a thousand. I would probably give and take a bit, but I think that with over a thousand missing posts would affect the work. (a thousand posts is roughly 3.5 years worth of entries)


fk02

And this is my free blog on WordPress.

I downloaded a plugin to install on my site, called Word Stats, it’s a pretty nifty tool, it displays expanded information on your entries. For example, while typing an entry on OSS, you can see the word count at the bottom of the post window. Word Stats would provide character count, length of sentences, average number of words per sentences etc. I think it’s not a complete waste to download the script and not having all my posts on my own site, but I think I can use the script for mass gathering of data, like copy and pasting a month’s worth of entries to see the stats being generated.


fk03

For the post frequency per day, I’ve put back the calendar widget on my own site to help me find out.

reframing concept

thisjournalsuitsme examines growth and self-discovery in the age of the Internet, particularly in the period before the advent of social media. The concept of deconstruction and the literary genre bildungsroman comes together to form the framework for this project. The method of ‘remixing’ will be used to explore and manipulate my archive of digital and virtual journals, summing up these data in web and print forms.


At the start of the semester I wrote a short introduction to my FYP, before I decided to analyze just my blog content only and going with data visualisation. I think that even though my current desired outcome might be very different from what I had envisioned at the start, I don’t think the concept will change drastically, perhaps I just need to rephrase or reframe certain ideas. Even though I am totally new to data visualising and infographics and not completely knowing where to begin scares me a little right now, I think I am able to find my way around it, and to eventually make something I will be proud of. I feel that this learning process is particularly important to me at this point because I want to graduate knowing that I’ve made something completely unexpected and new, combining what I’ve already known/can make, with something that I have learned.

These are some ideas that I want to make clear about my project currently:

  1. Using bildungsroman as the main framework for storytelling with my data. The outcomes of visualising my blog data is a look at the psychological transition from youth to adult.
  2. The web part of my project will be an interactive way of looking at data visualisation. Glitch aesthetics will be used as metaphor for the topics that I write about in my blog (various kinds of experiences as transient errors that seek to resolve by themselves).

That’s all for the moment. Writing about it helps a lot, kind of refreshes my mind.


data visualising techniques

data03

I found this website with a gallery of beautiful data visualising techniques, which (at last) gives me some ideas on how I can break down my data. I haven’t done much since recess week and am struggling with how to make use of my data. Tagcrowd is particular useful as I can take a look at the taxonomy of my blog posts, at a glance, from any period that I pick. So I don’t have to go through every single post to draw it out. It can be done, although it will be a feat because I’m not looking at book.

I think I have been putting it off for a bit because I got started with highlighting the text according to categories I made up and at one point I was like WHAT ?!?!?! and it was rather scary and overwhelming and I think I might not be able to continue doing for each and every post (I have 2,700 entries), and the content might become way too arbitrary to fit into just one or two categories. Also, going through what I have written when I was 13 was particularly embarrassing at times, even though I do take a step back and look at the text from a systematic point of view… still can be a struggle, because I did write them after all, and I’m not analyzing something that’s written by someone else or something that is purely fictional. I find this psychological part of doing this project something that I can also expand on, perhaps later, or as part of the process journal. The act of going through one’s journals and looking it from a third-person point of view.

Anyway, this is where Tagcrowd comes in handy for just sieving out words like “school”, “people”, “art”, just to highlight some broad categories immediately, and then under these umbrella of terms, I can then go into the entries and pick out some of the significant words I use to talk about these things.

I might start with some numbers for example, just to get me started. Just plain old figures. I got here a quick list I made just now:

  1. Number of words in my archive
  2. Total number of entries
  3. Post frequency
  4. Day of the week with highest posts
  5. Day of week with lowest posts
  6. Longest entry
  7. Shortest entry
  8. Number of exclamation marks used (Thought of this when I saw some particular angsty entries… ha ha)
  9. Number of swear words used (After the above)

Please let me know if you have more ideas 🙂

I can’t believe it took me a week to get this entry out. I’ve been feeling quite stuck and I have been bumming around. I should have just written this out. It got me out of the rut a little.

collecting data

data01

It’s not easy to work with data, I think, especially when I have absolutely no experience with it. Here’s what I got so far. I highlighted the text according to categories (school/self/etc). I’m not sure how I might go about deconstructing the text. I got a book about data visualising, so I’m currently reading through it.