visualisation concept


Photo 18-12-15, 6 48 28 PM

This was my final work for Facts & Fictions. I made this booklet on the day of the exhibition… it was a really packed month for all of us. It’s not the most refined piece of work I’ve ever made, but I am quite happy with the concept for visualisation and this is something I will work on next semester, after I am finished with making the dataset.

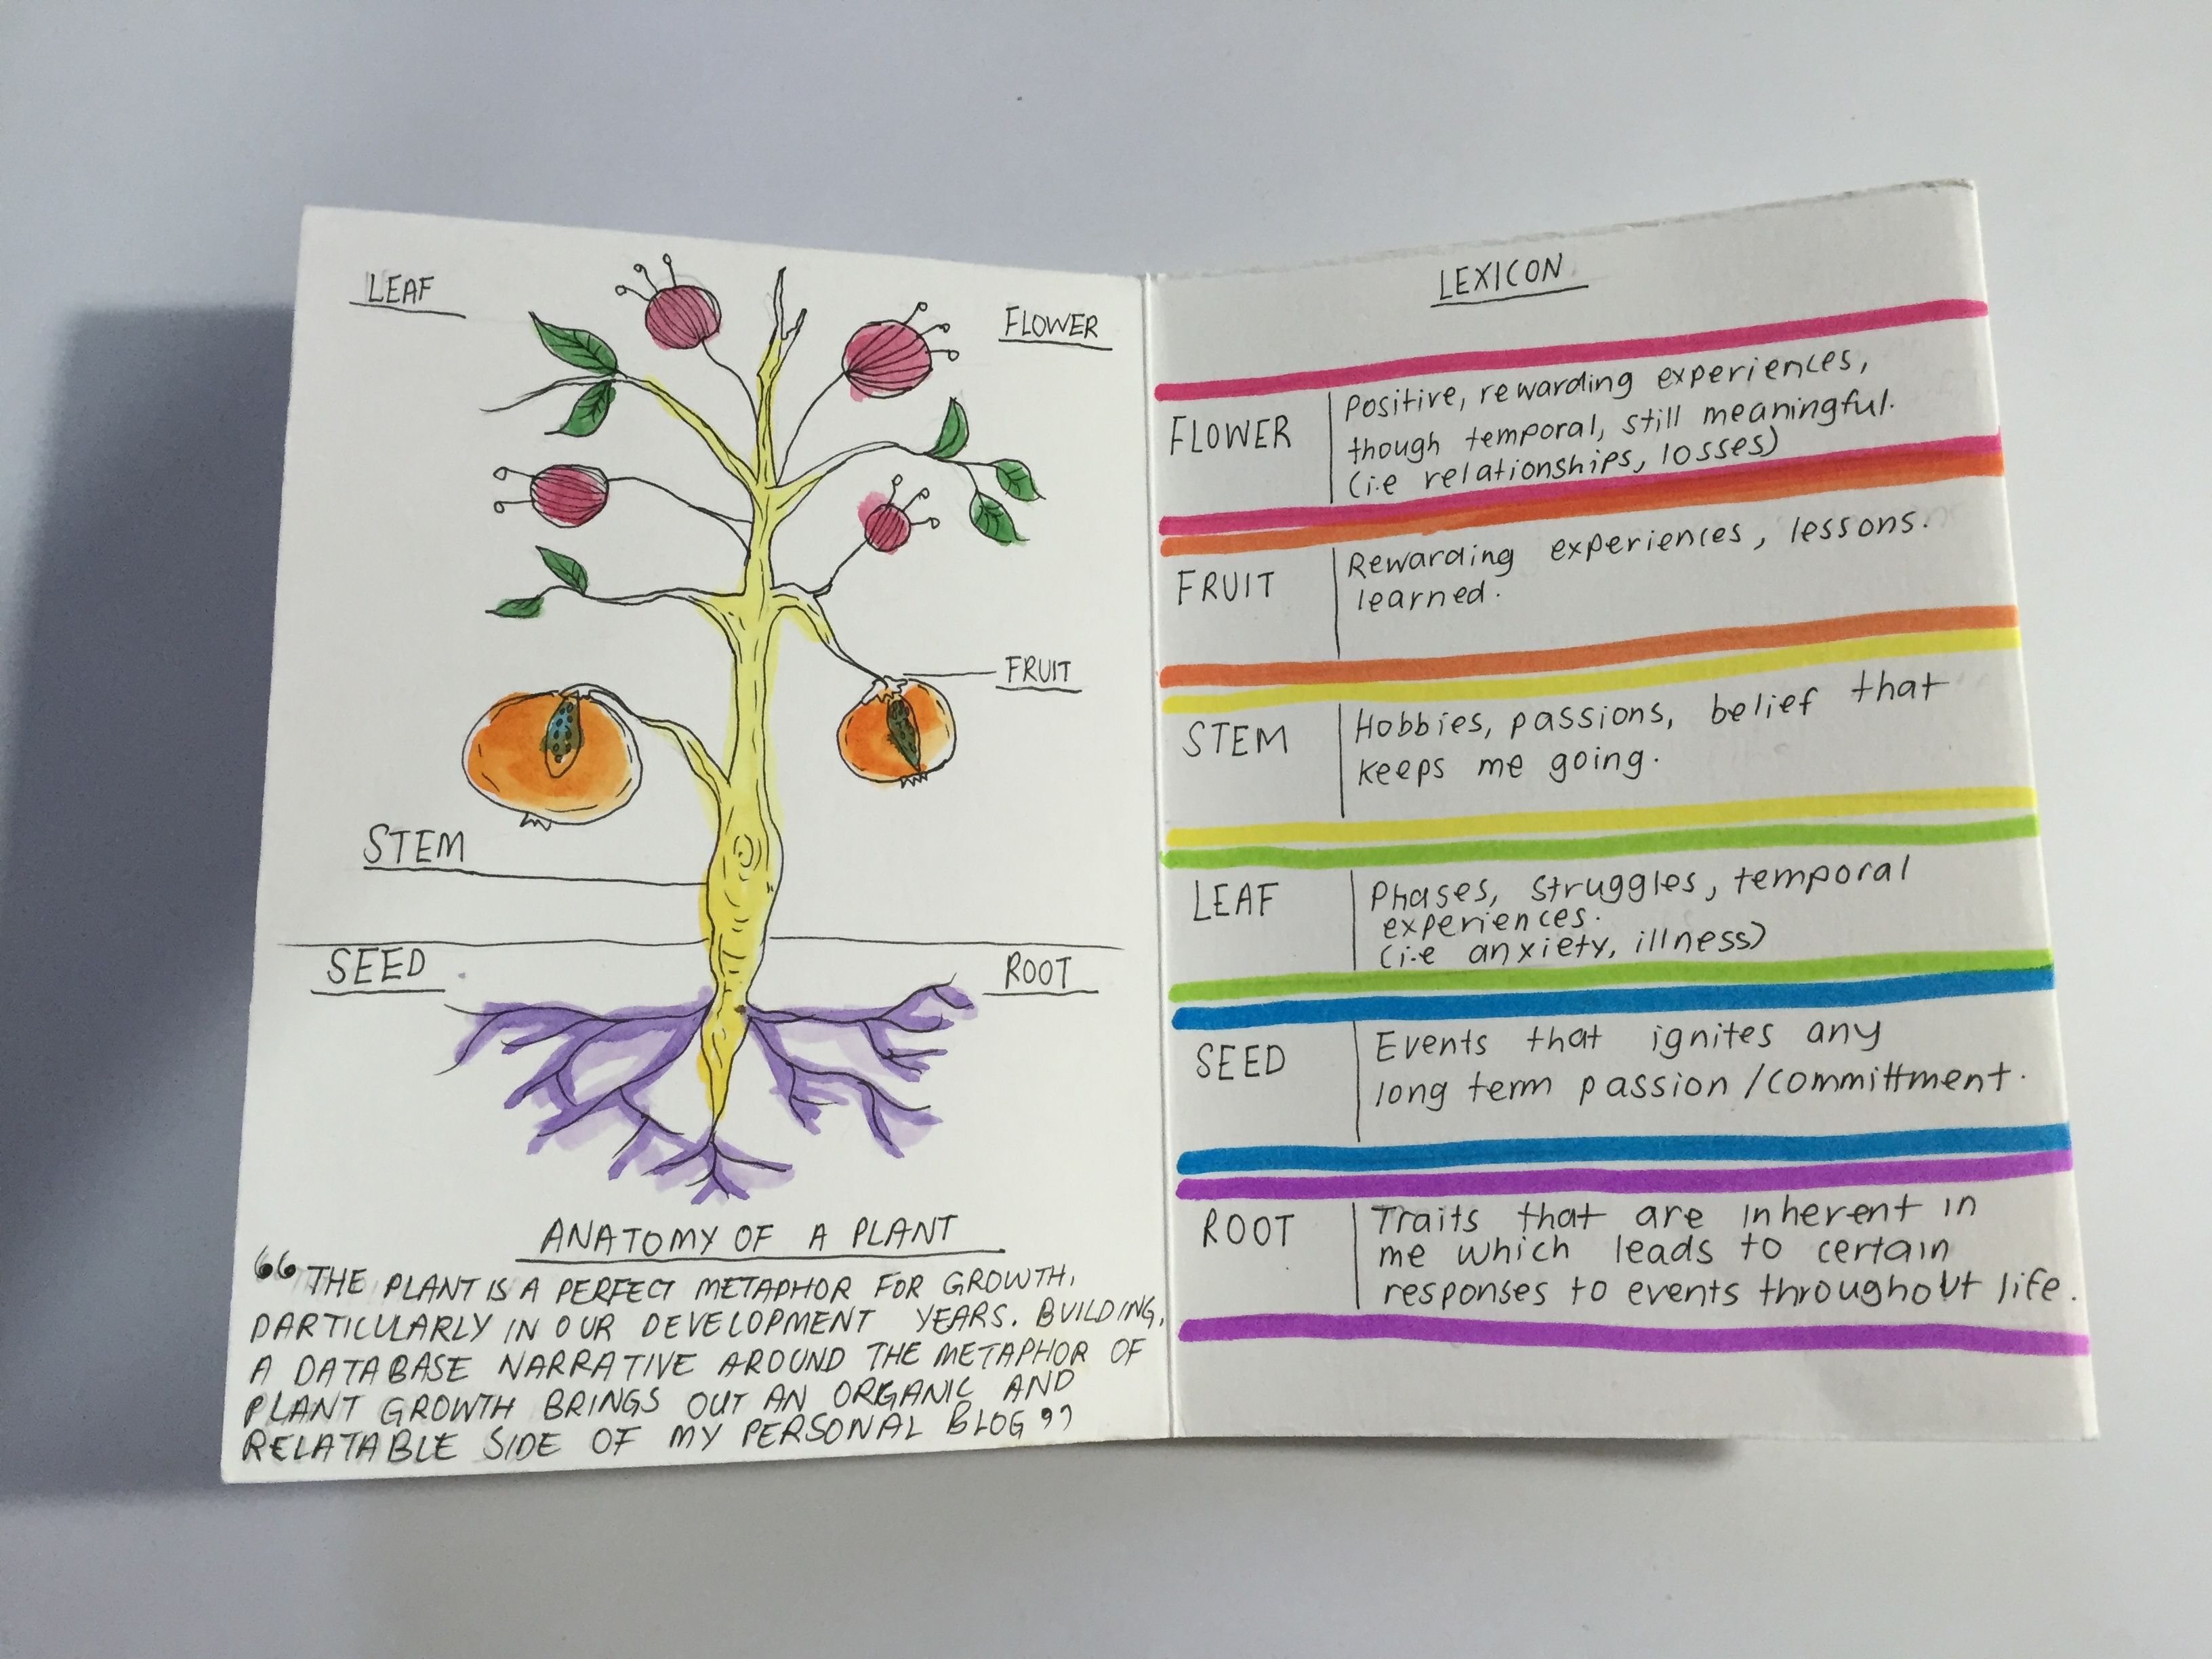
A group critique made me consider a lot more about what would best capture the nature of my blogging journey. I have also received comments that it would be great if I can incorporate some illustrations too. I came up with the germination process as a metaphor, not the most original, surely, but the concept is pretty basic and there is a lot of room to play with.

Photo 18-12-15, 6 48 40 PM

Photo 18-12-15, 6 48 45 PM

Screen Shot 2015-12-18 at 6.47.41 pm

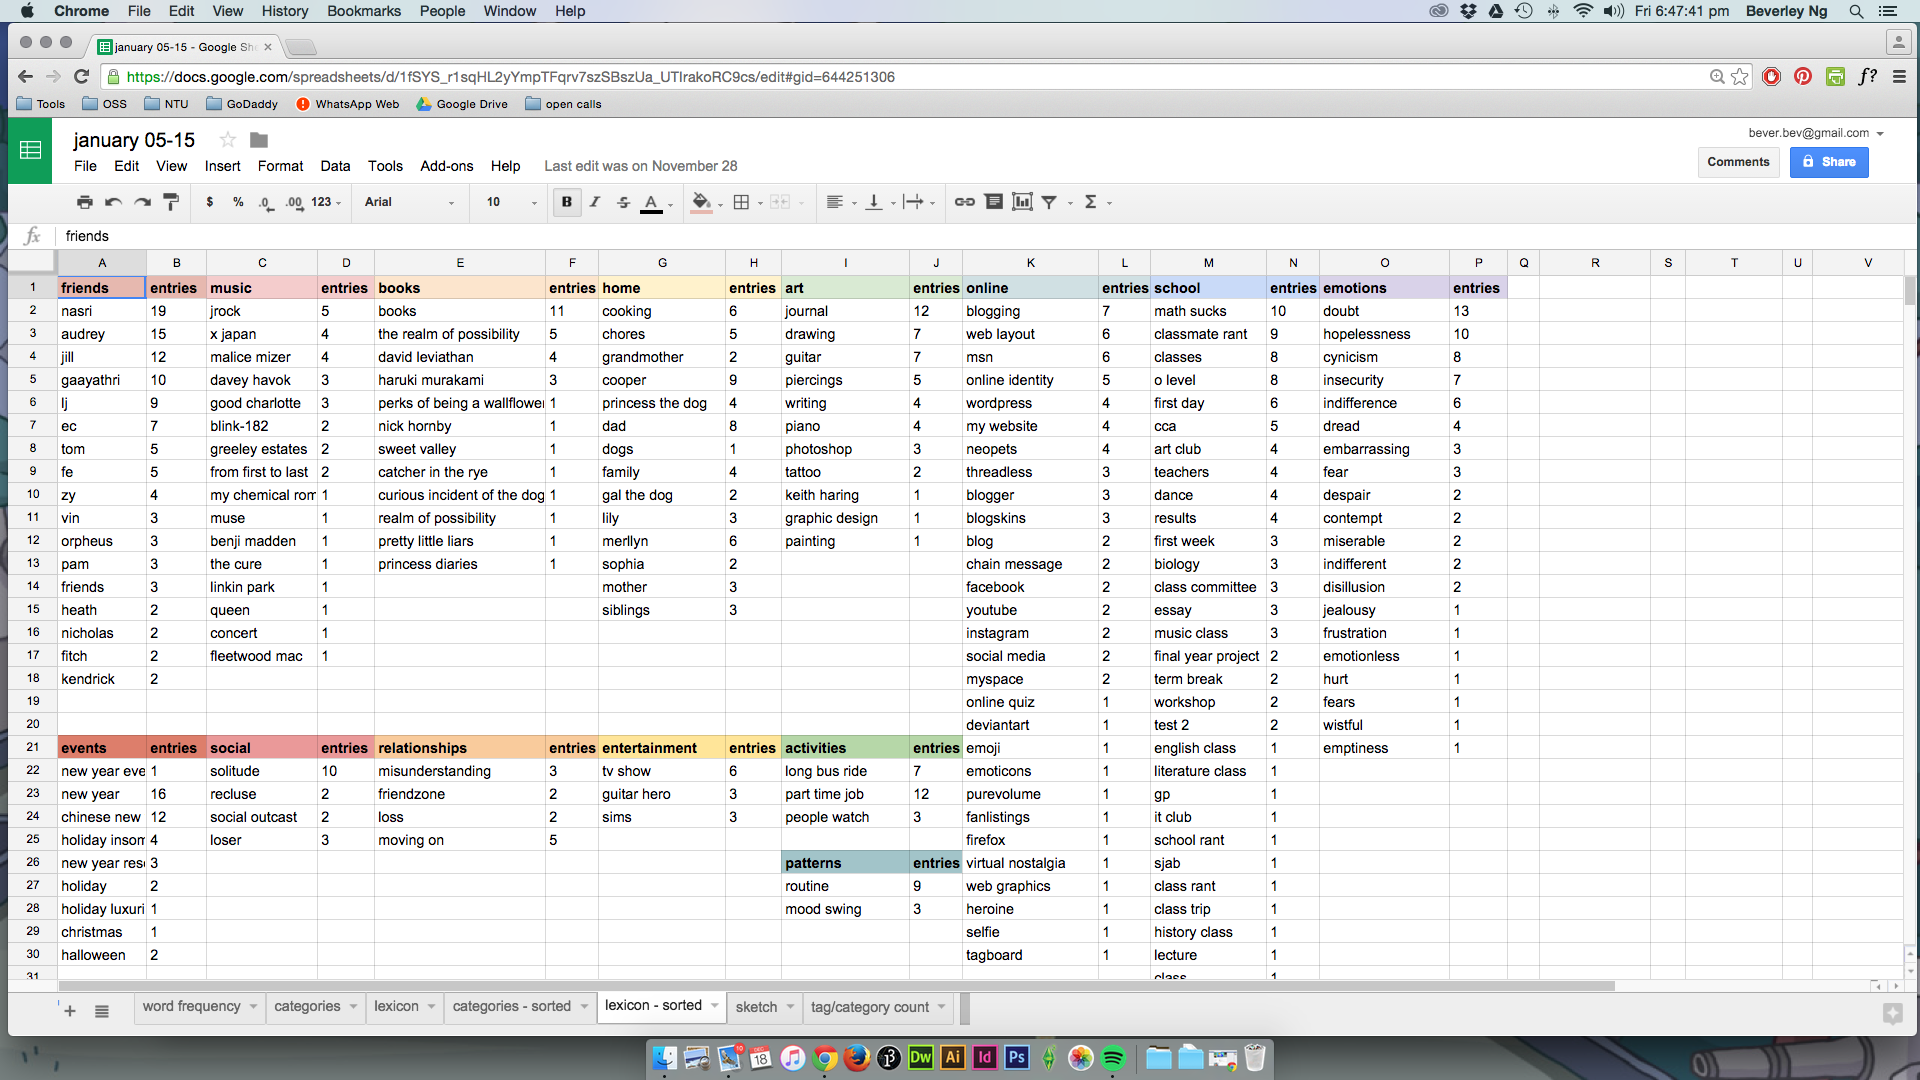
This page was made using the sketch I created on Google Sheets, using a radial treemap as a reference. (Google Sheet is able to generate a treemap chart too – very cool)Photo 18-12-15, 6 48 53 PM

I think having this overarching concept to go along with the visualisation will make my work more relatable and meaningful to others, rather than being this abstract data vis-y thing that people just look at with no clue what it is about.

“january” progress

no noo

I’m finished with tagging entries up till 2010, although only entries up to 2009 have been uploaded on the site so far. The rest are on the Textedit file on my computer. I’ve been working with really unstable network connection and it’s driving me up the wall. I think this is one of the drawbacks of moving your work around and doing it on the go.

Also, I am quite frustrated with the amount of spam comments that are generated by my blog, even more so with the fact that Akismet offers the service for a ‘minimal fee’. I went with the free option anyway, but it does not make sense to pay to get rid of spam comments.

On the website, you will see a grid image. It’s meant to be a filler image at the moment. I will be writing a WordPress theme for this website, something close to a sketch I made a while ago. The entries are available for viewing (under the read more tag). I am still interested to have the metadata as the narrative. You can see that my tag cloud is quite specific.

The next step for my project is to plot in the number of entries per category/tag into Google sheets and creating a skeleton for a visualisation using the charts.

I am also paying attention to how I feel as a result on embarking on this project. It didn’t make me feel good to look at my own writing and experience in such close detail. I have the same feelings when I worked on the ‘dictionary’ project last semester. At that point of time, I felt mortified at some of the entries. I become more aware of myself, and that some of my flaws have been apparent for a long time, and I may not have looked into them or addressed them at all. But this are more personal reflections of my project that I think I’m not ready to share right now, without going through a long story about the roots of my angst, etc. I’ve been writing down some of these reflections as I do my work, and I hope to put them together as part of the conclusion for the project. All of this is a work in a progress, my personal self, the project… at the end of the day, I would like to be able to look at this project and know that I have made something good out of what I’m not proud of.