
In the past month, I’ve worked a lot with Google Sheets. It helps me to organise my categories and tags easily.
Due to the scale of the project and the personal, arbitrary nature of journal entries, it can be tedious and tricky to build the database of tags and categories. Here’s how I tagged my entries.
– Tags: subject matter, activity, event, names
After a review of my Sheets, I am on the fence about using Categories as part of the database narrative. Categories are more general than tags, which can be very specific, and as a rule, I categorised my entries based on the general tone/subject matter of the entry, which can be quite tricky because as I’ve said, entries can be arbitrary. I thought about how my dataset could work for me and I find that tags may offer a better solution. A combination of say, tags + time, will project quite interesting visualisations, and definitely more effective as well. Categories would become an extra set of variable, and because they can look rather similar to tags, it would be really confusing too.
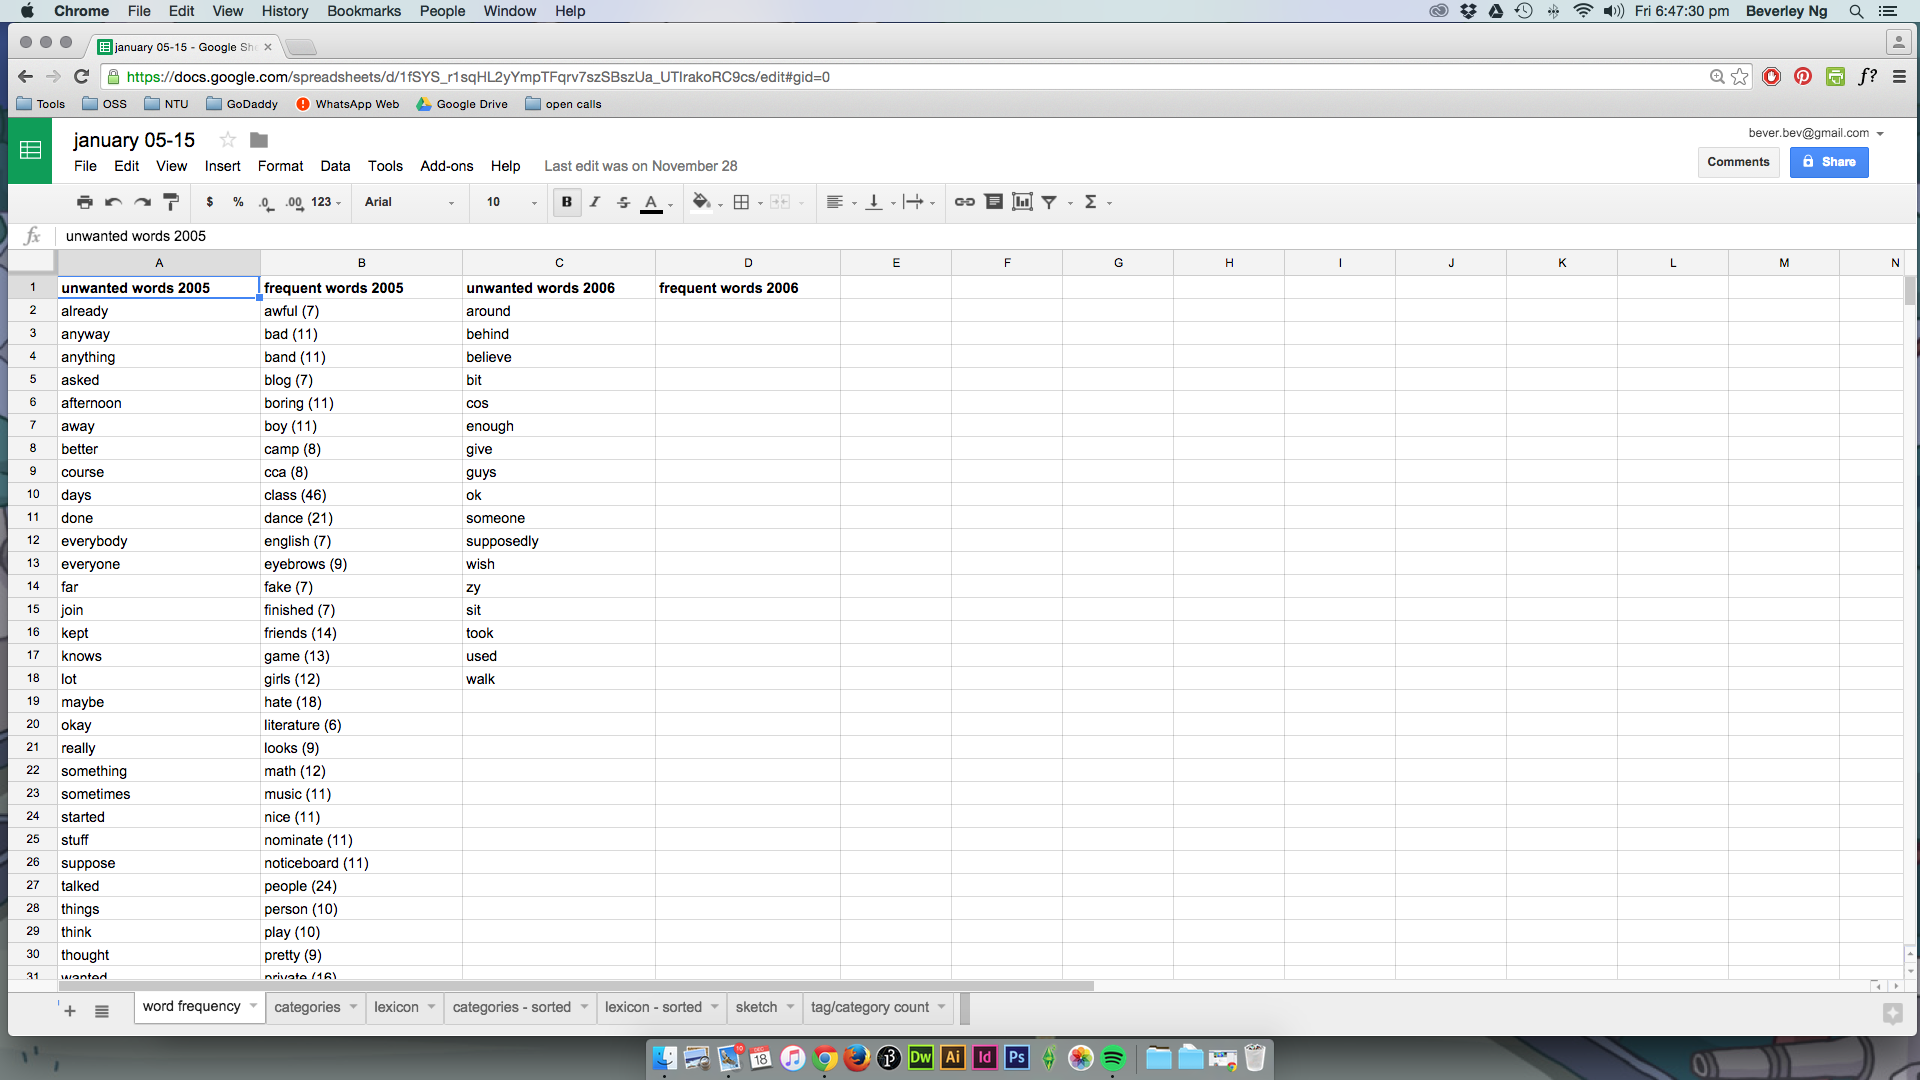
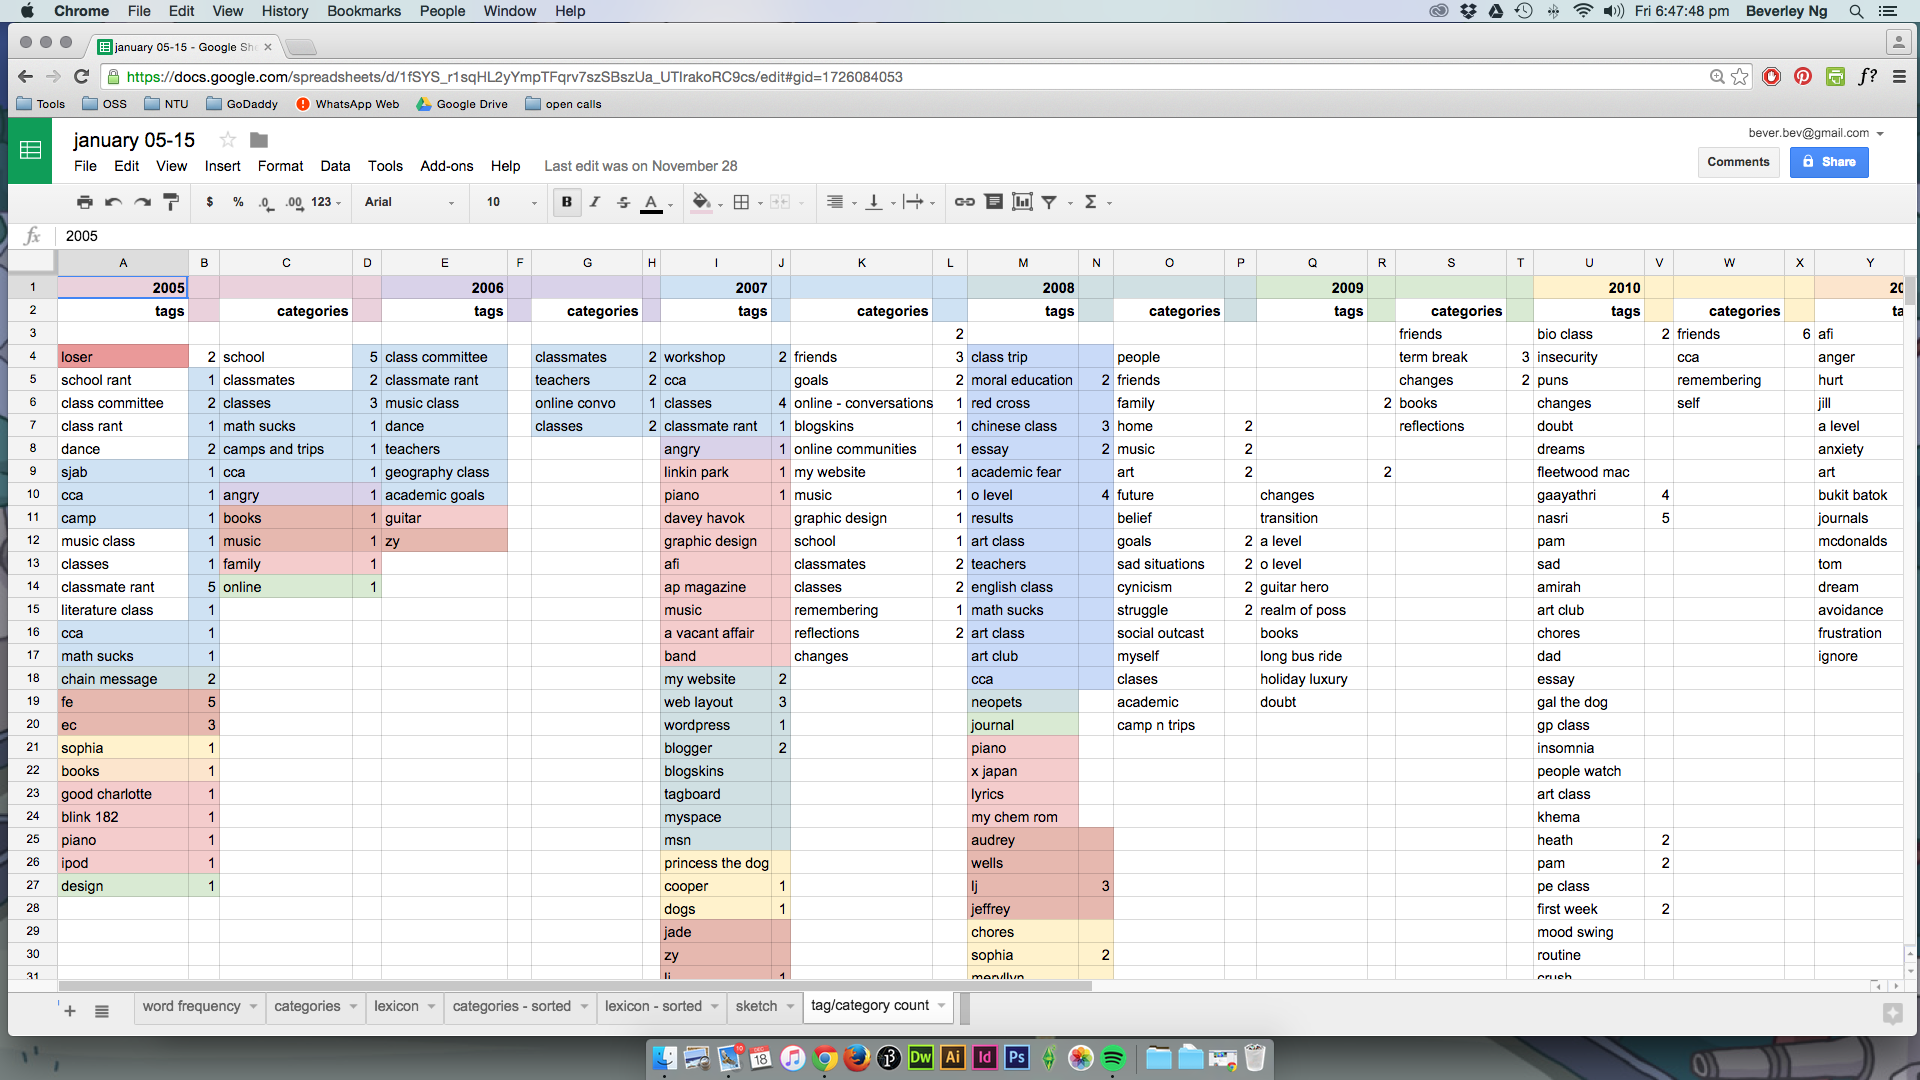
Here’s an overview of my Sheets. This is from January 2005 – 2015. There’s a lot of cleanup to be done, for sure.
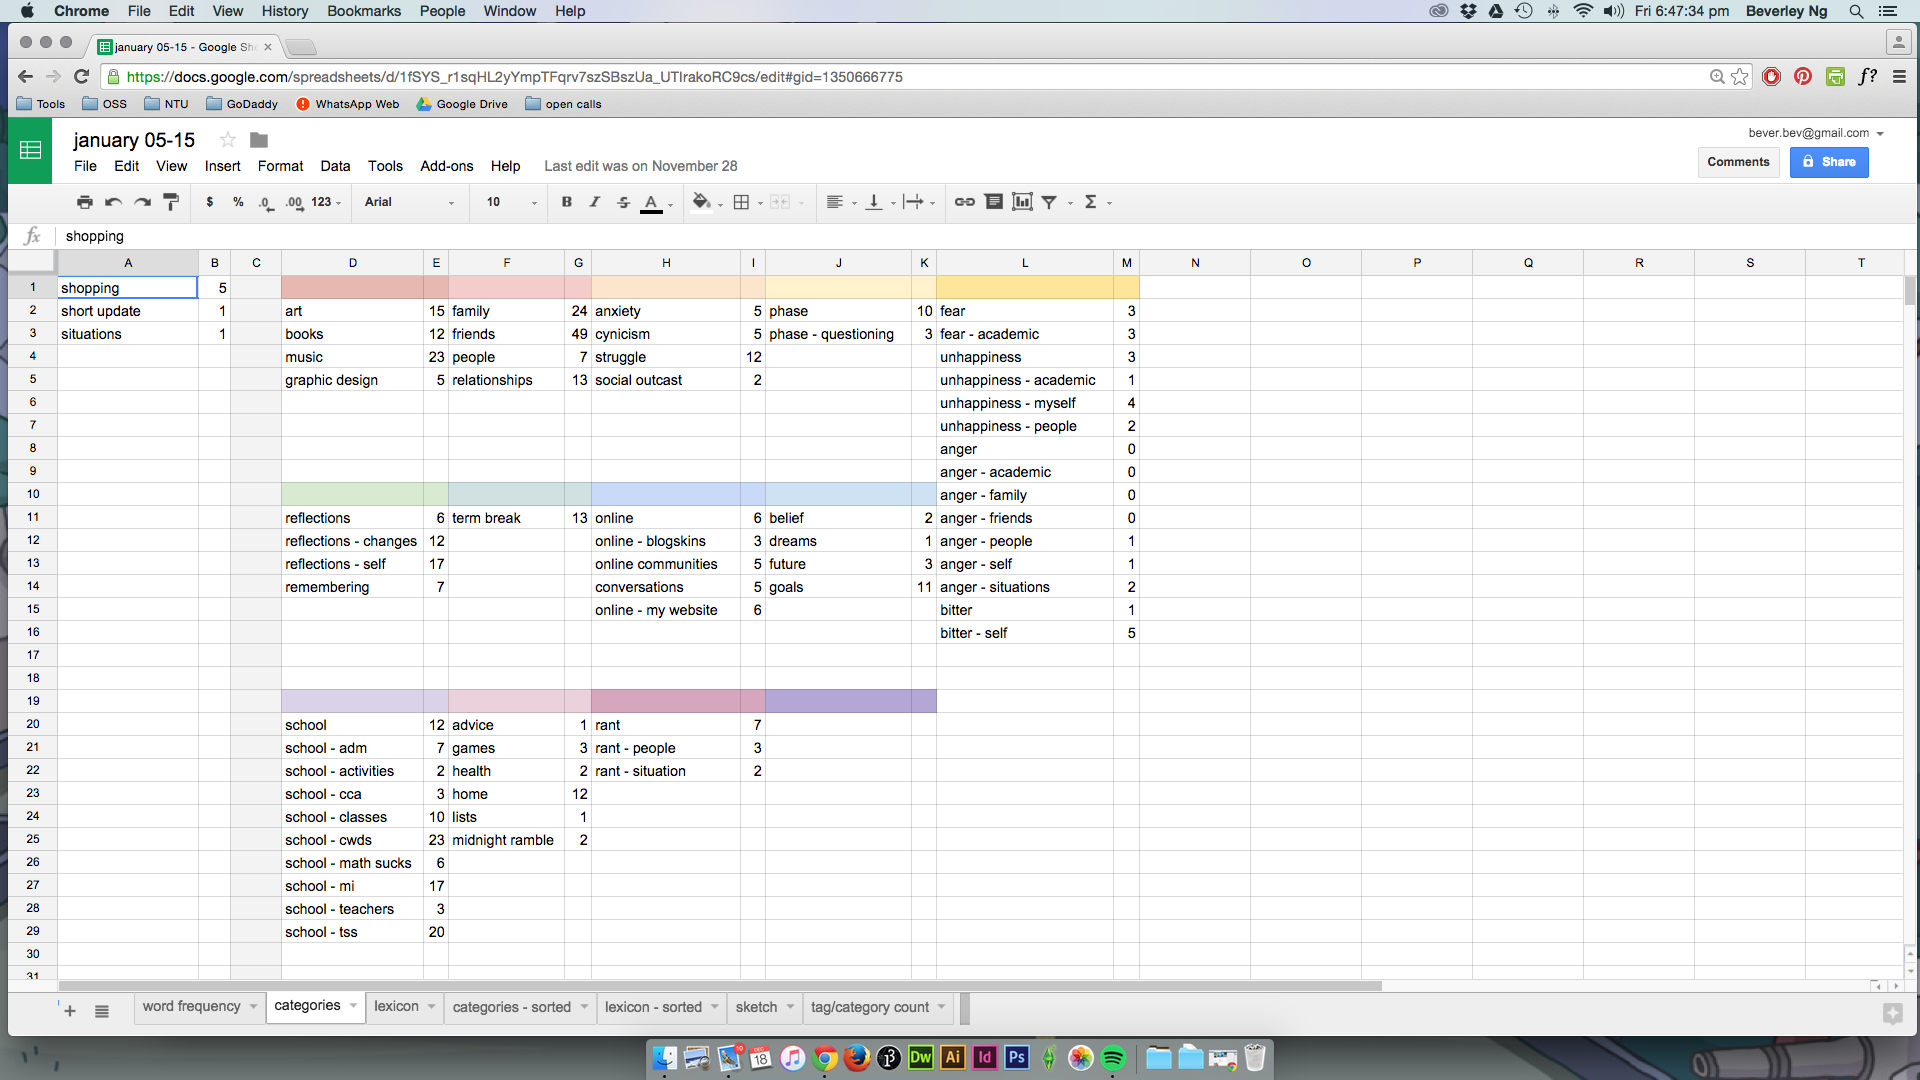
Sorting of Categories.

All the tags, before they are sorted. Tags in the colour columns belong to a bigger category, while those on the left side are more specific.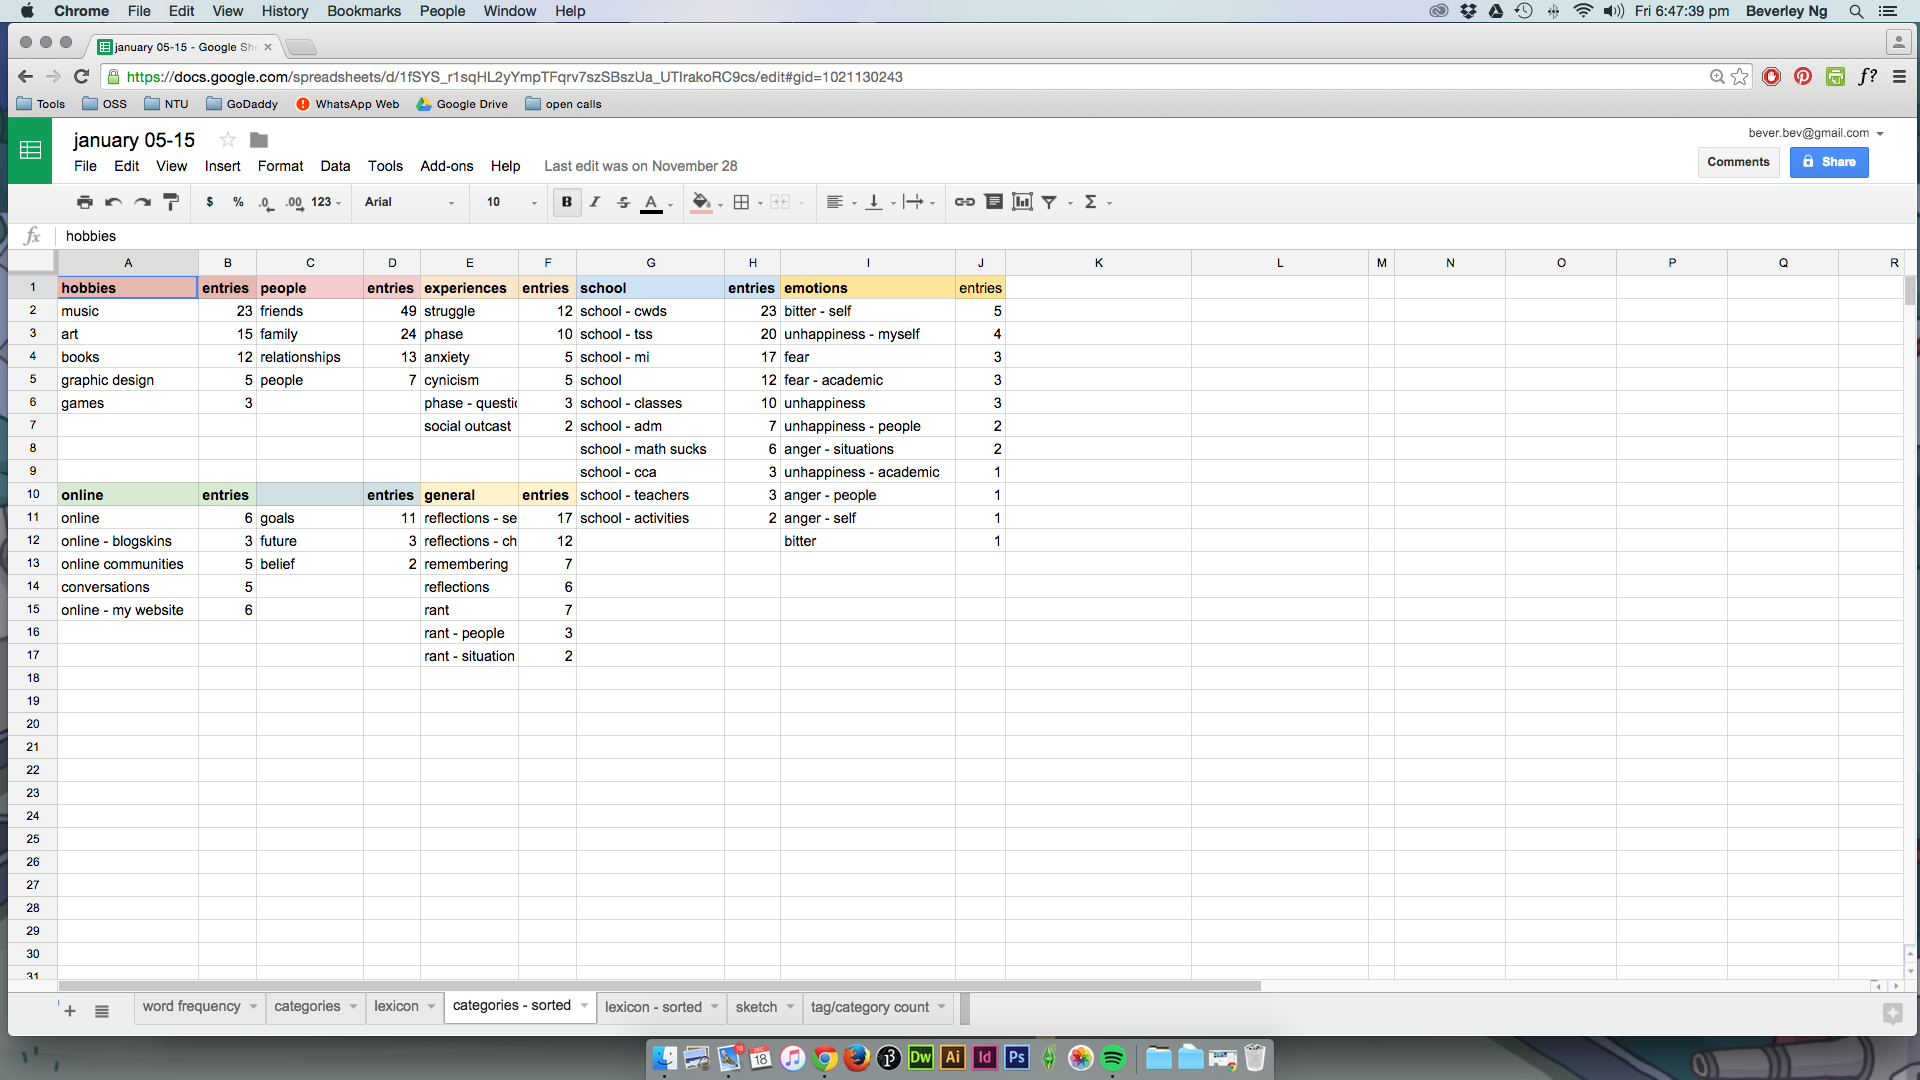
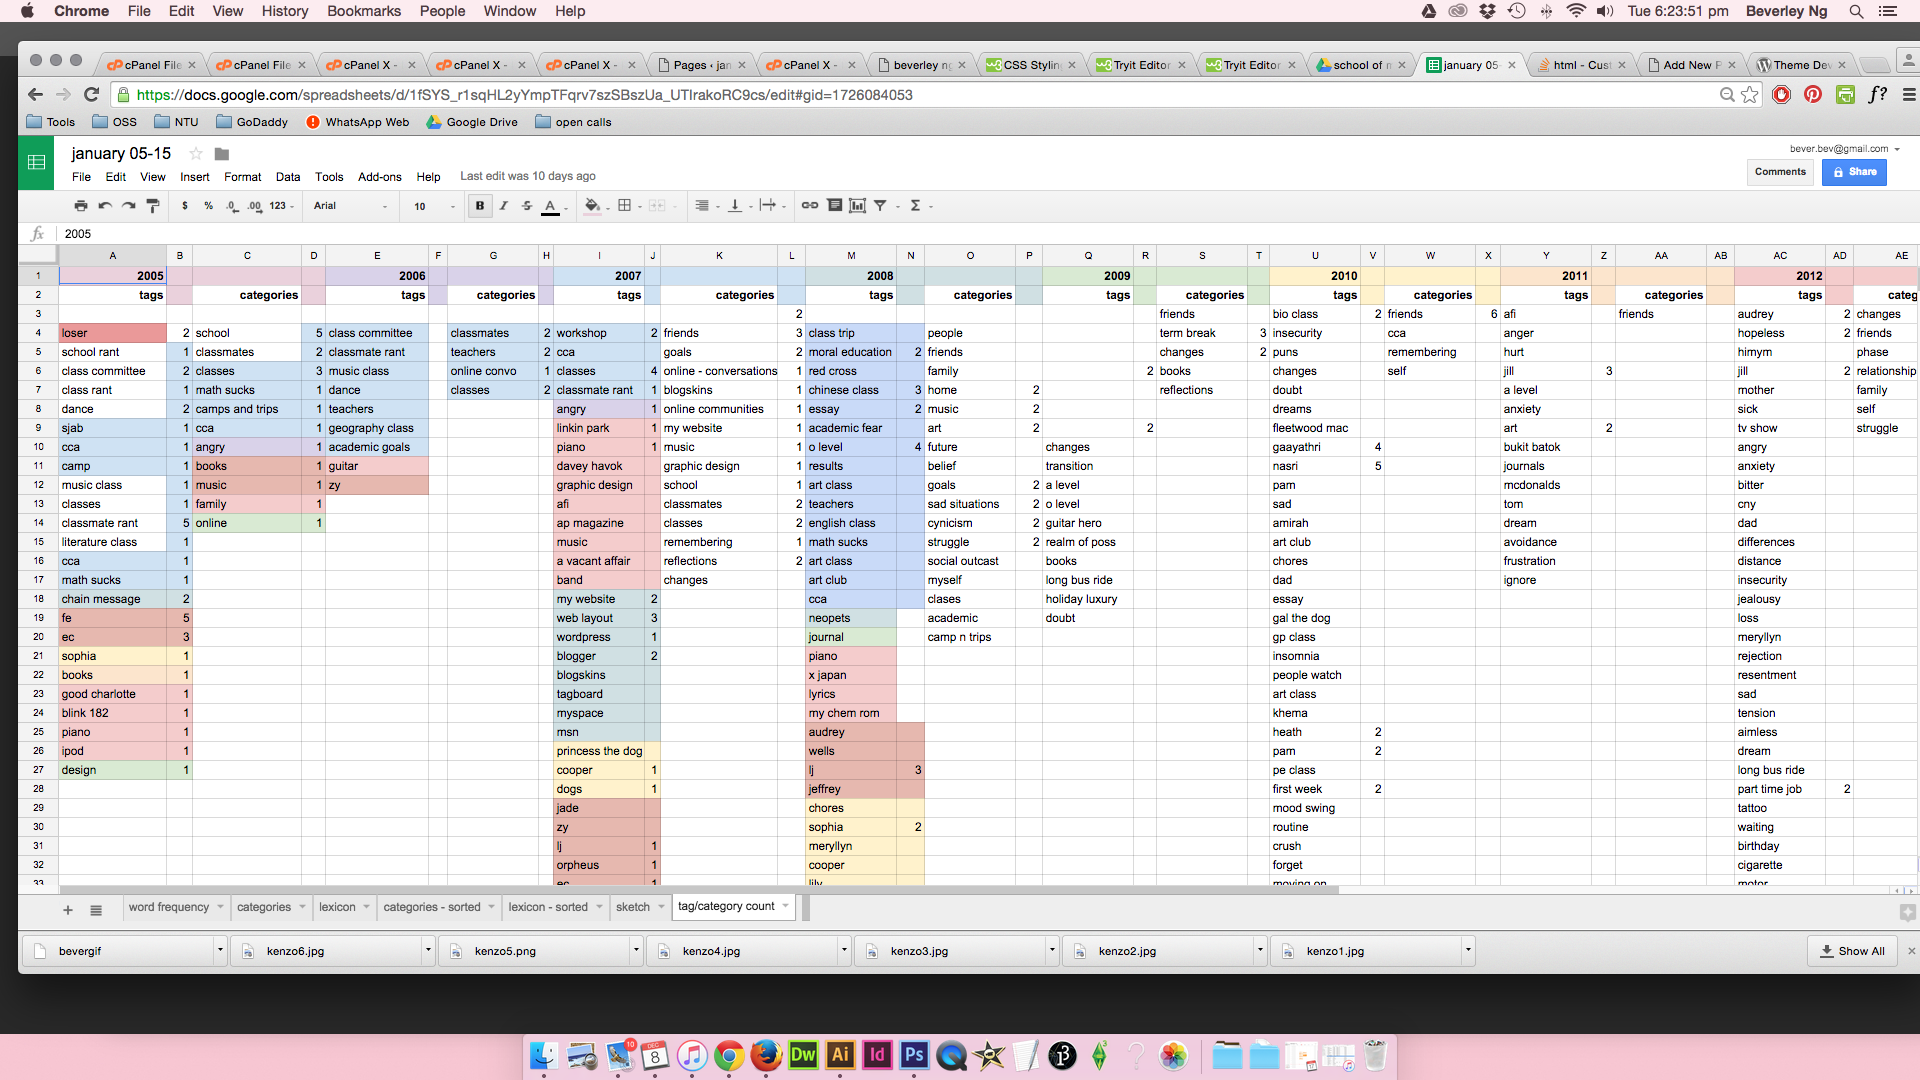 For my Facts & Fictions final, I narrowed down the categories and tags and worked with these.
Sketches of my visualisation, using Google Sheets.