It’s been a really packed and intensive week! I have so much to share, and it’s amazing how much I’ve learned about data visualisation in just these few days alone. Here’s a quick recap of what I’ve learned over the week.
First, we have Stefanie Posavec, who was with us Monday to Thursday. On Monday, we gathered a dataset that represents the spirit of Berlin. I went to a local supermarket to collect some information on the products sold there. We learned how to make a physical visualisation out of the data we collected.
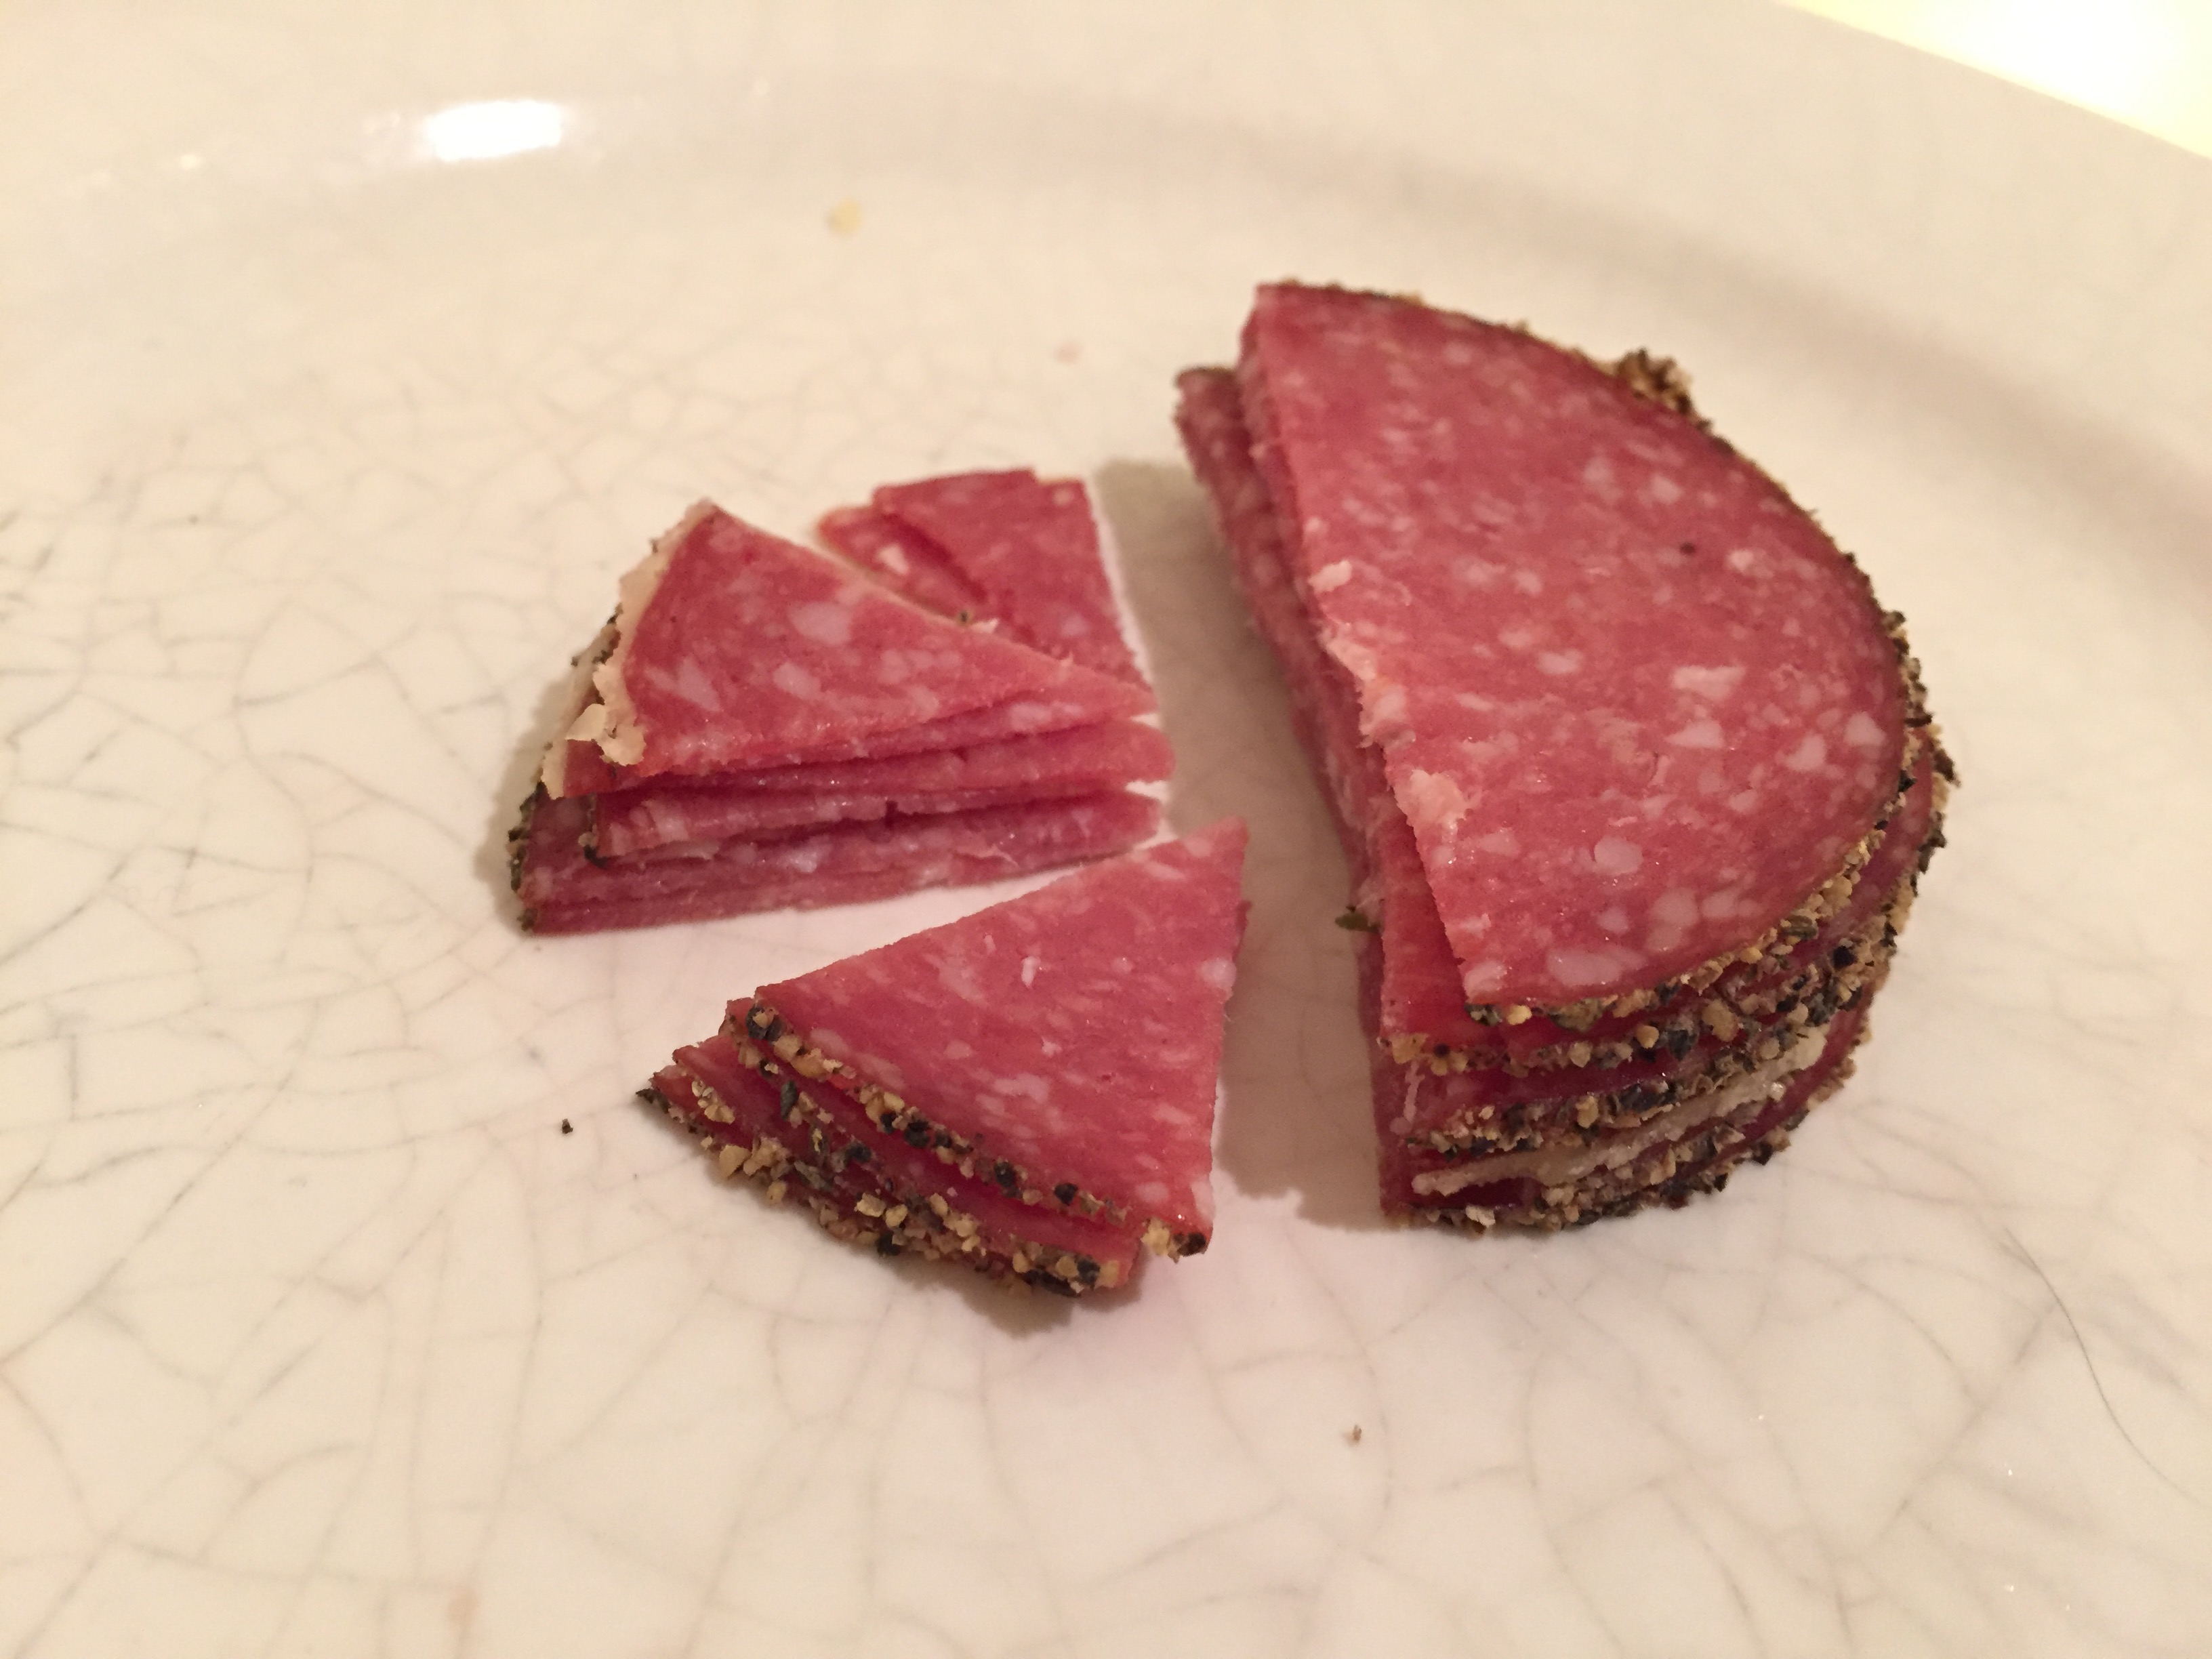
I made this pie chart out of salami, to represent the different kinds of wursts that can be found in a typical German supermarket.
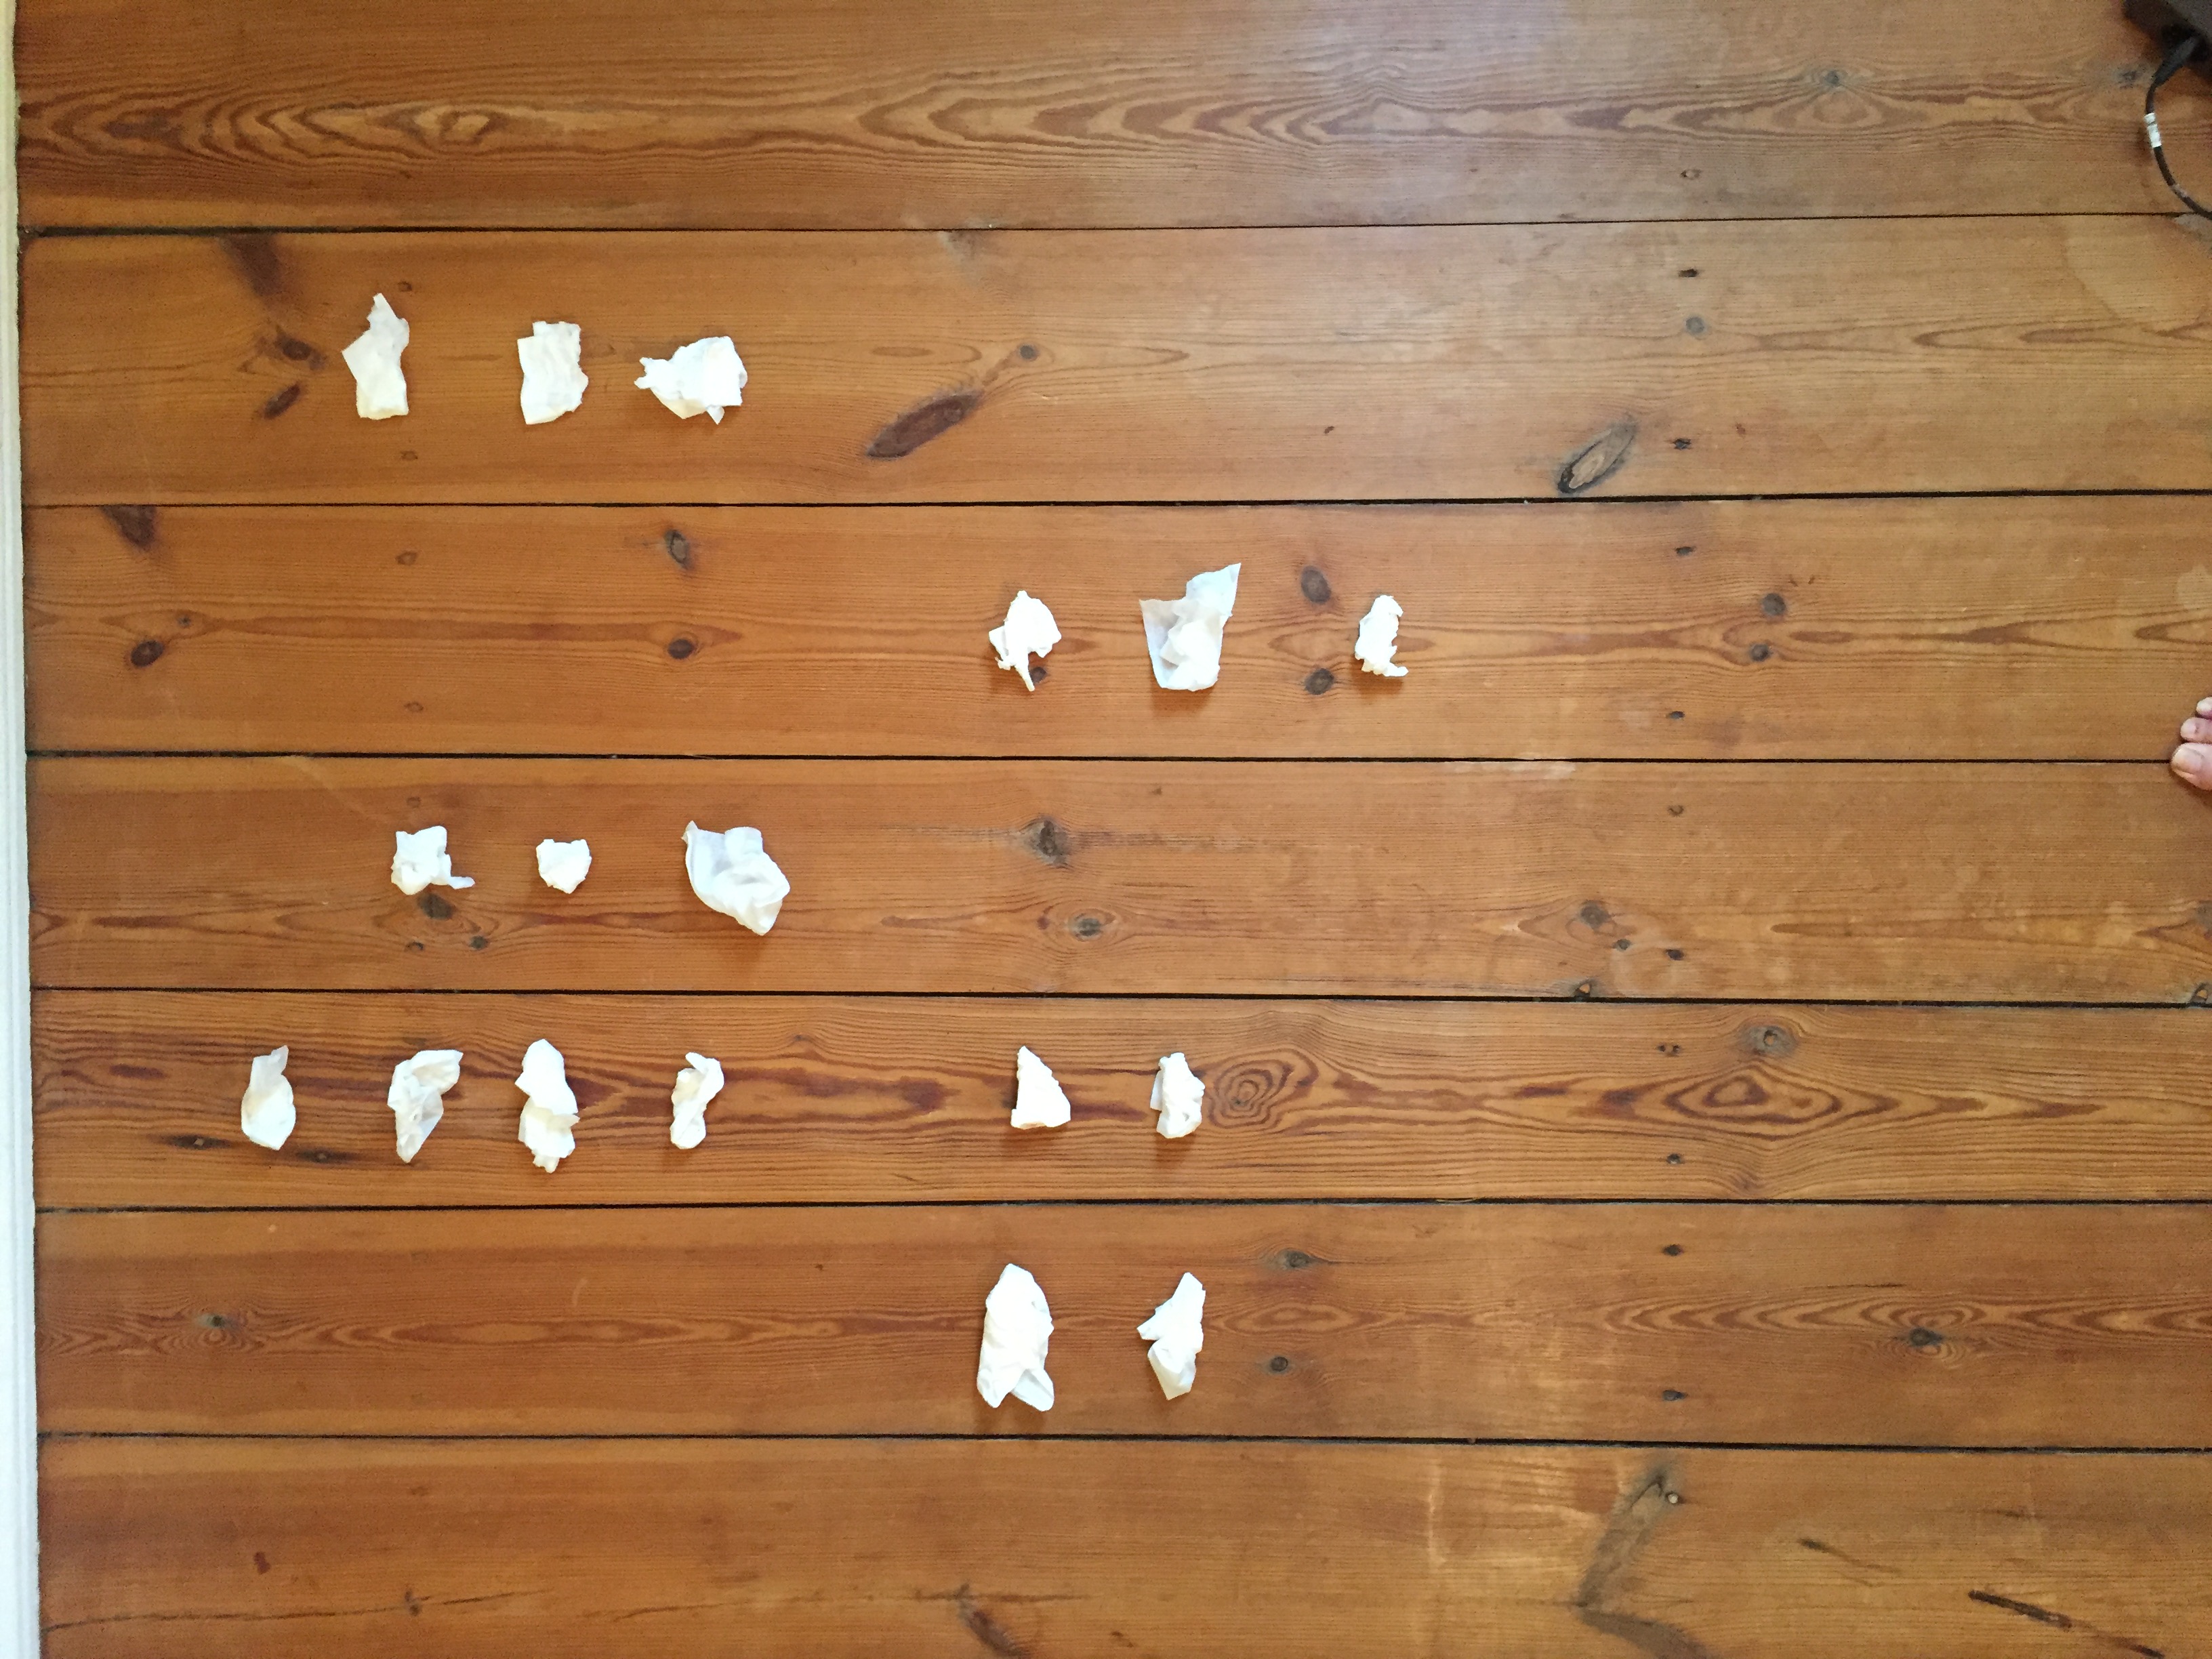
I also collected another data set on the number of times I checked in with my family and friends over the week. I was having a cold this week, and the tissues were used as a form of visualisation.
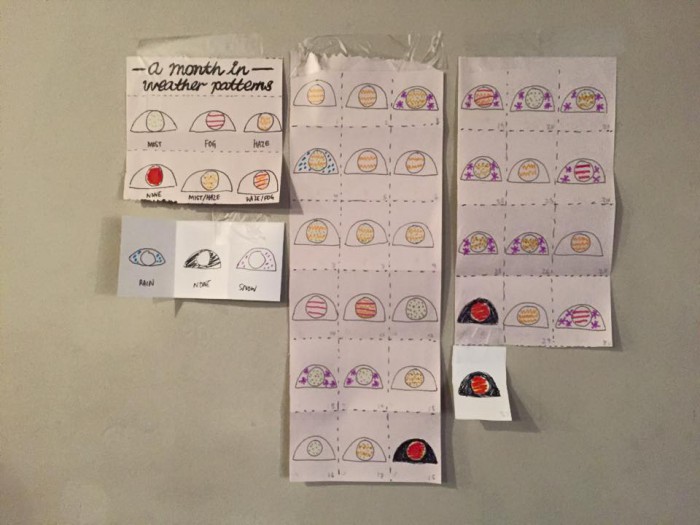
Stefanie’s approach to data visualisation is very hands on: she does not do programming. Instead, she draws everything by hand. Her process is very well documented, and her slides contain many photos of her sketches from her notebook. She encourages us to try this approach on our last day with her, where she gave us a set of data on the weather patterns in a month.
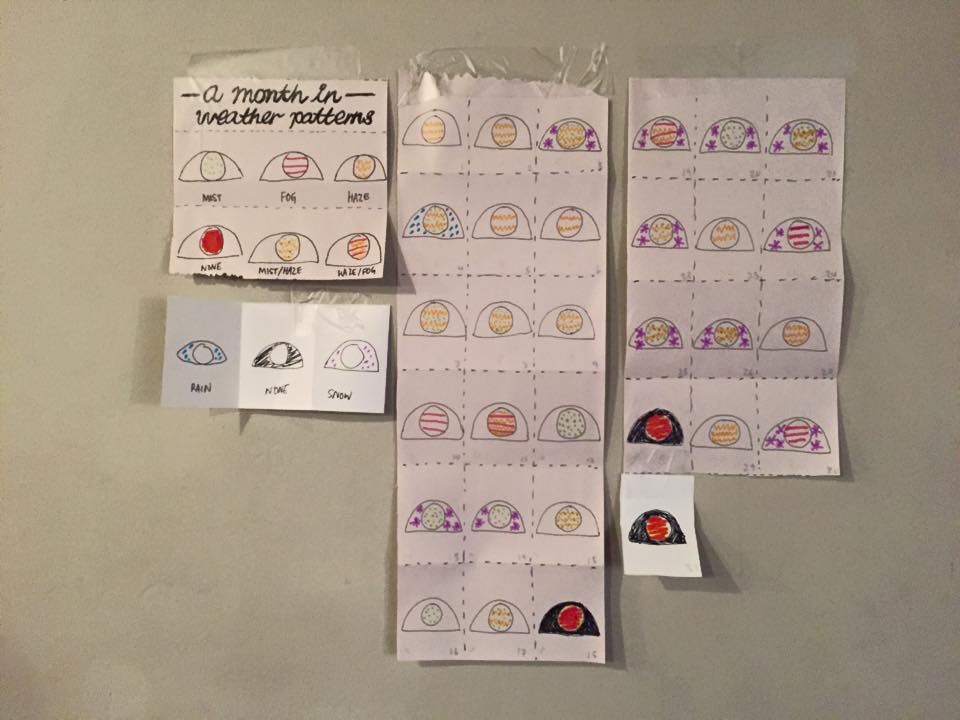
This is my outcome.
Key things we learned with Stefanie: find a pattern in your data, select your focus, and always remember than form follows function. Set up rules. Create hierarchy within your focus helps to make your visualisation even clearer. Always create a scaffolding before inputting your graphical elements. Think sequentially, incrementally.
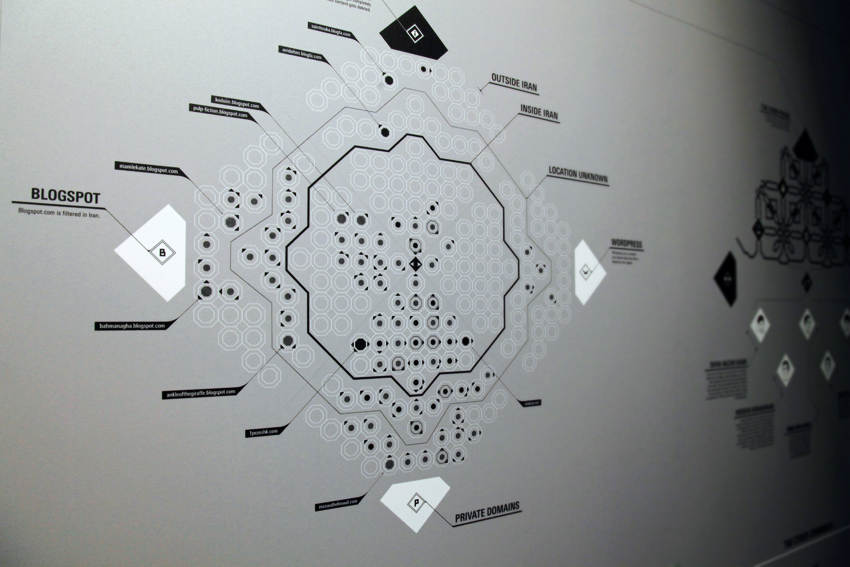
(this-is-maral.com)
On Thursday evening, we had an artist talk by Maral Pourkazemi. Maral is a very passionate designer. She has Iranian roots, which shapes most of her design work. She calls herself a design activist, where she uses her data vis skills to create powerful works to highlight the issues faced by Iran. This is one of the most interesting talks I’ve ever heard, as she shares the potential threats that surround her as a designer, because her work involves politics. Like Stefanie, her master thesis was the work that propel her to the world of data vis, and offered her many opportunities and led her to where she is today. For her masters, she made a work about censorship of Iranian internet.
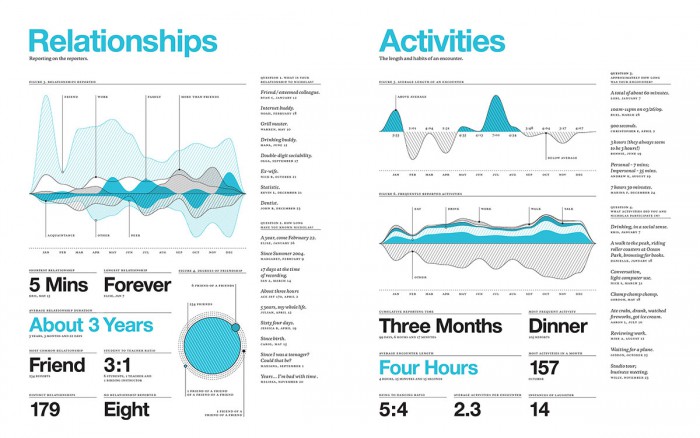
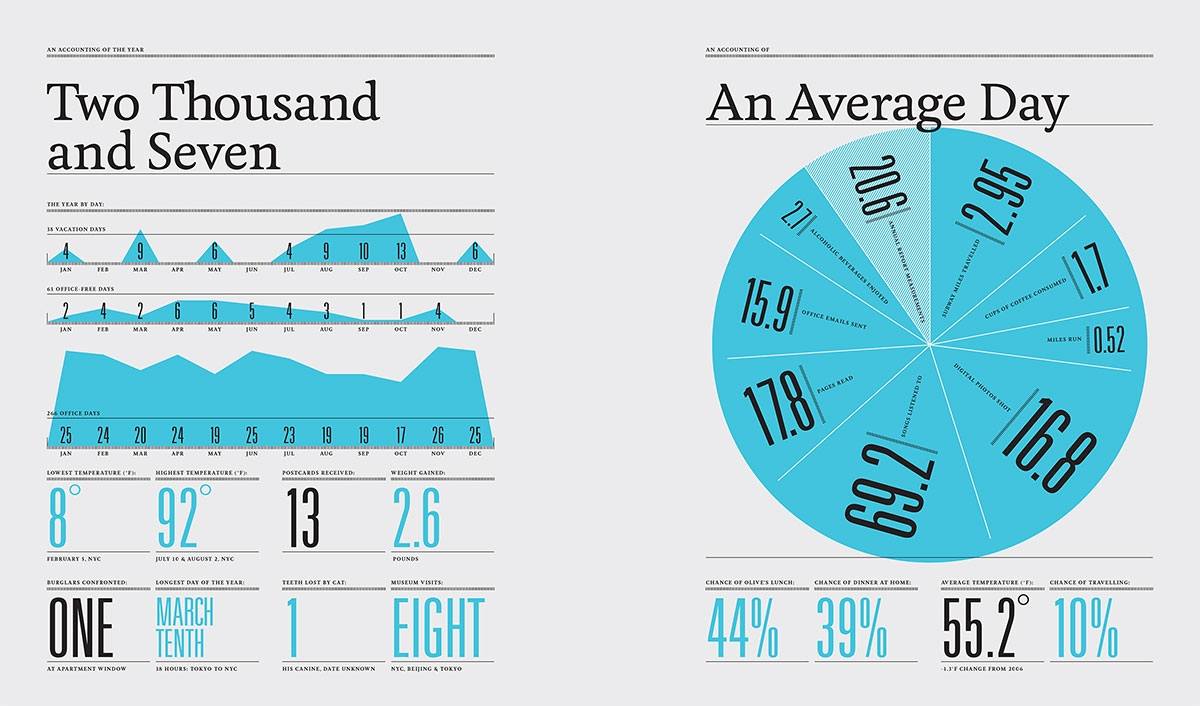
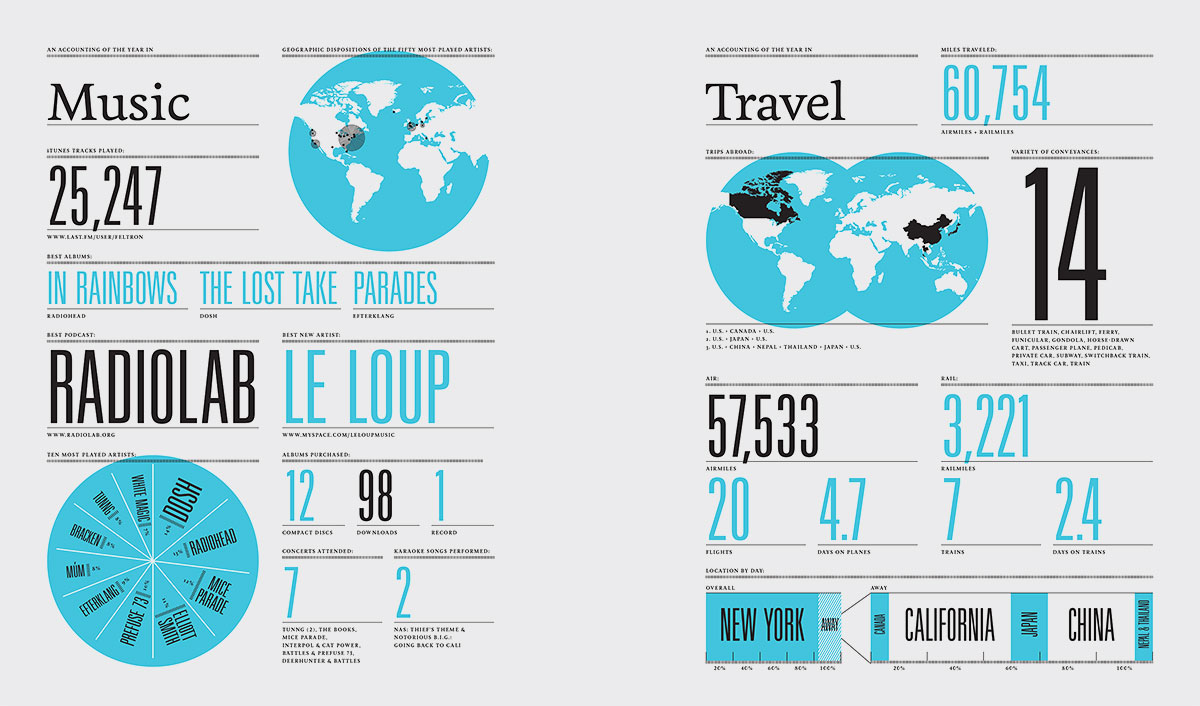
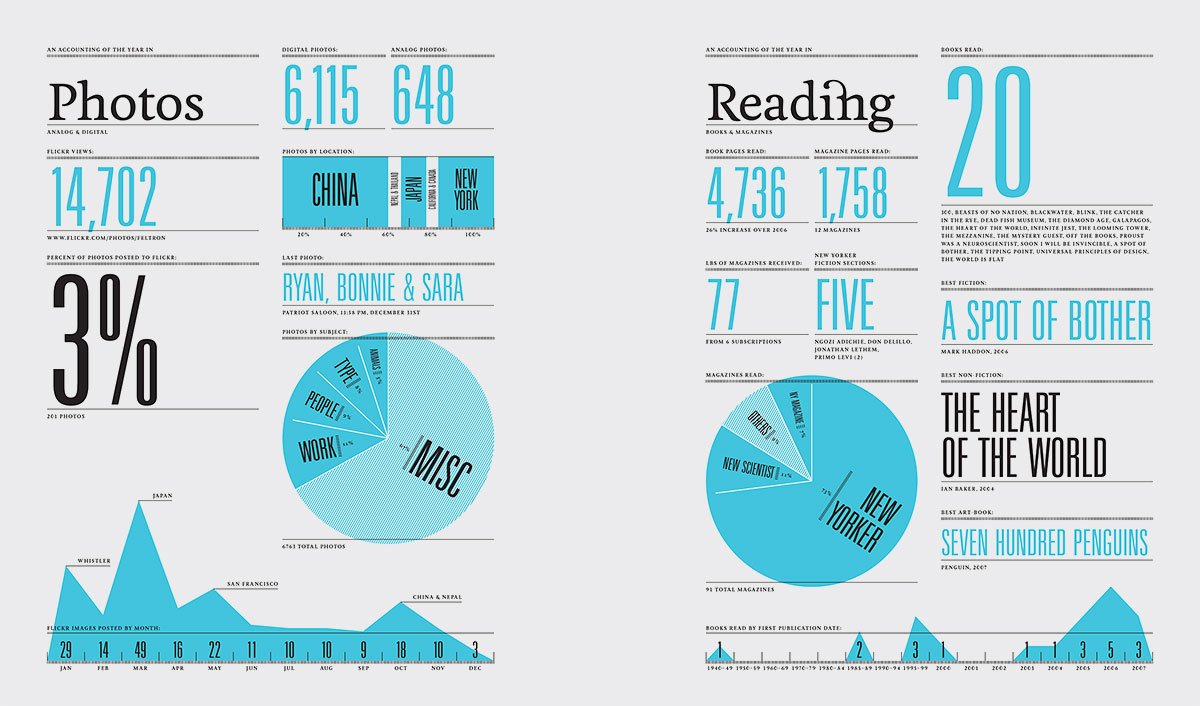
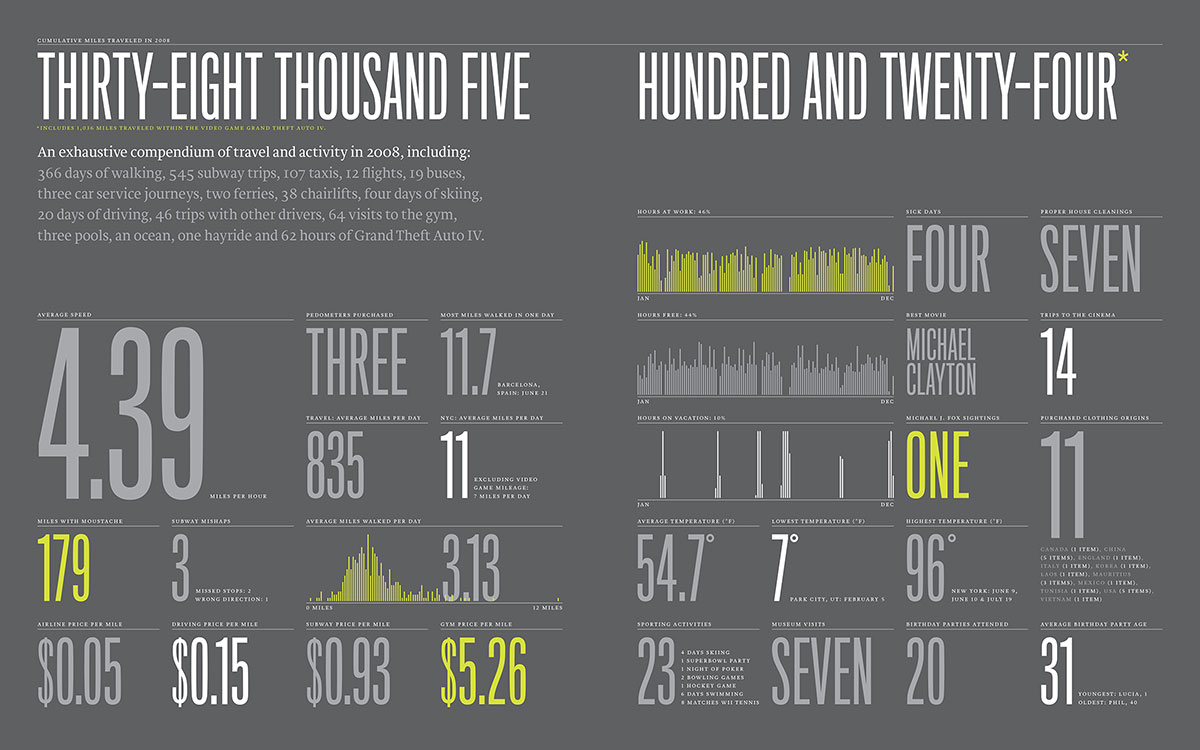
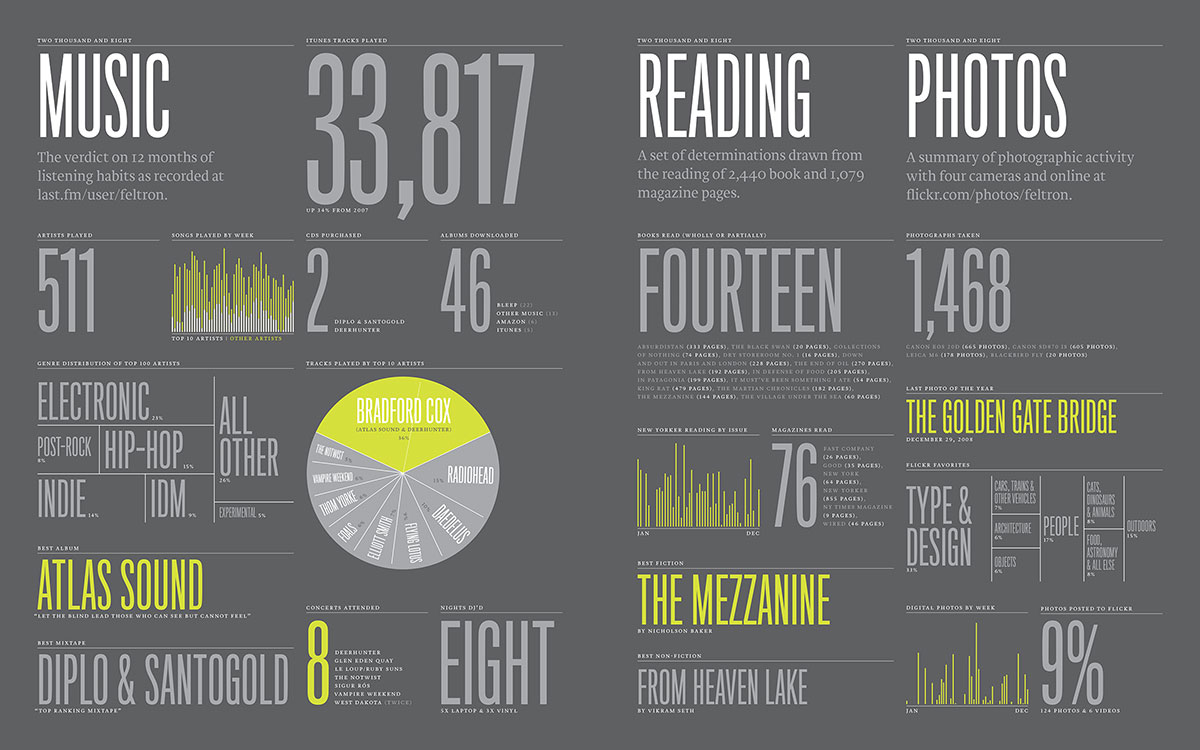
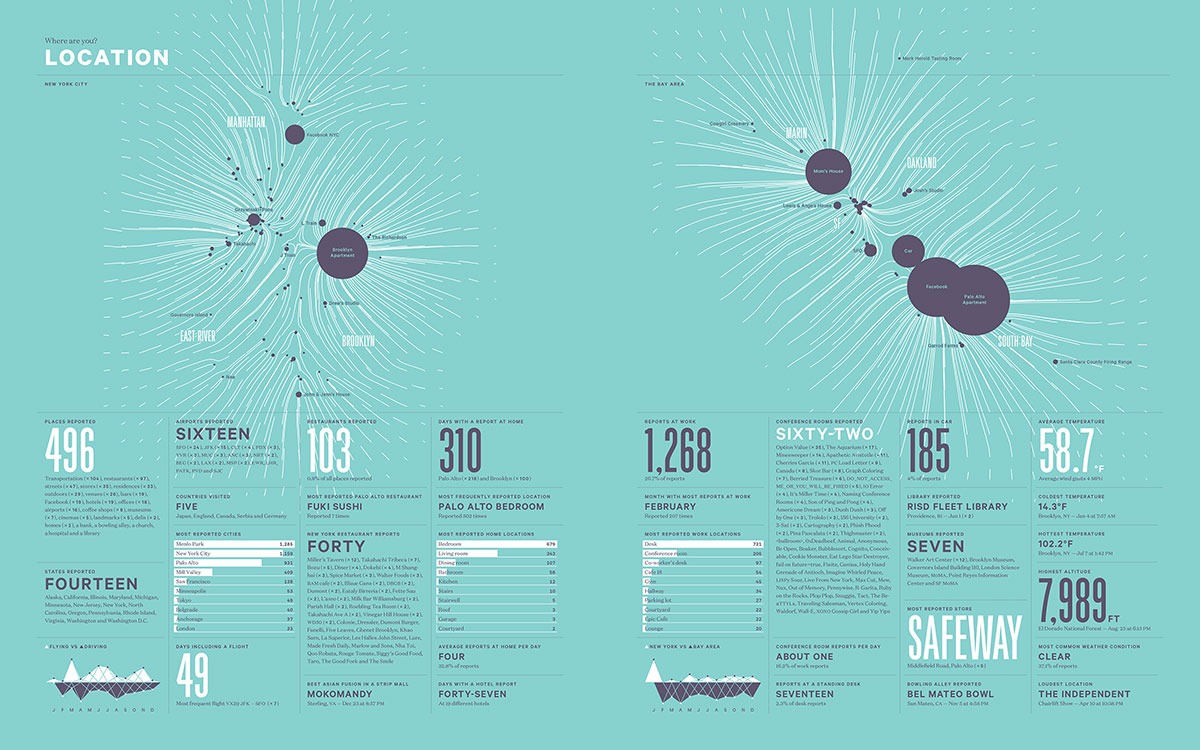
We ended the week with Nicholas Felton, who shared with us the programming side of data visualisation. I was very interested to hear how he made all his Annual Reports, and everyone was curious about this whole effort of collecting data actively, consciously, for ten years and putting them together in his report. Each year, he challenges himself to make a better report than the last. His last few reports were made with the help of applications, a few that he developed by himself.
This weekend, Nicholas walked us through the program Processing. I’ve gone through a beginner’s tutorial the week before I came, so thankfully I was no stranger to this. Having just a bit of introduction and some background in coding helped me a lot in picking up Processing as I go along.
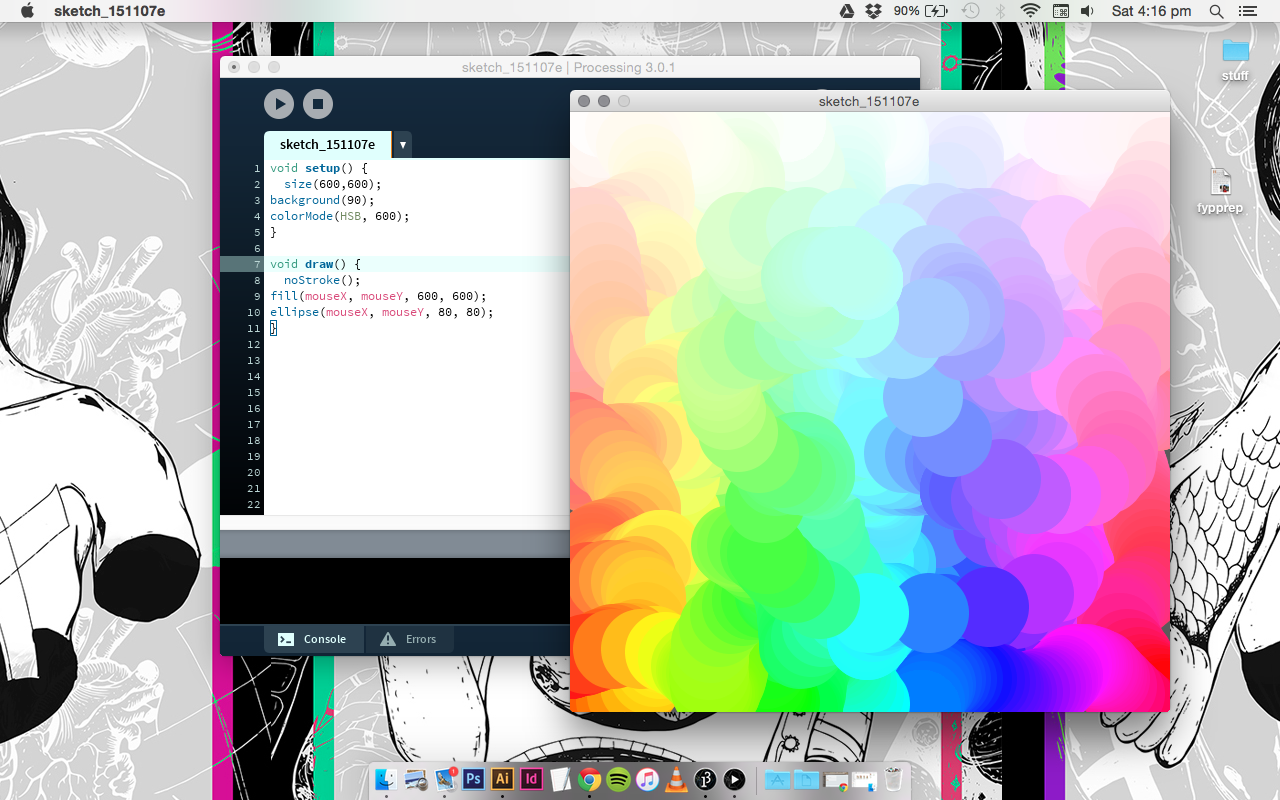
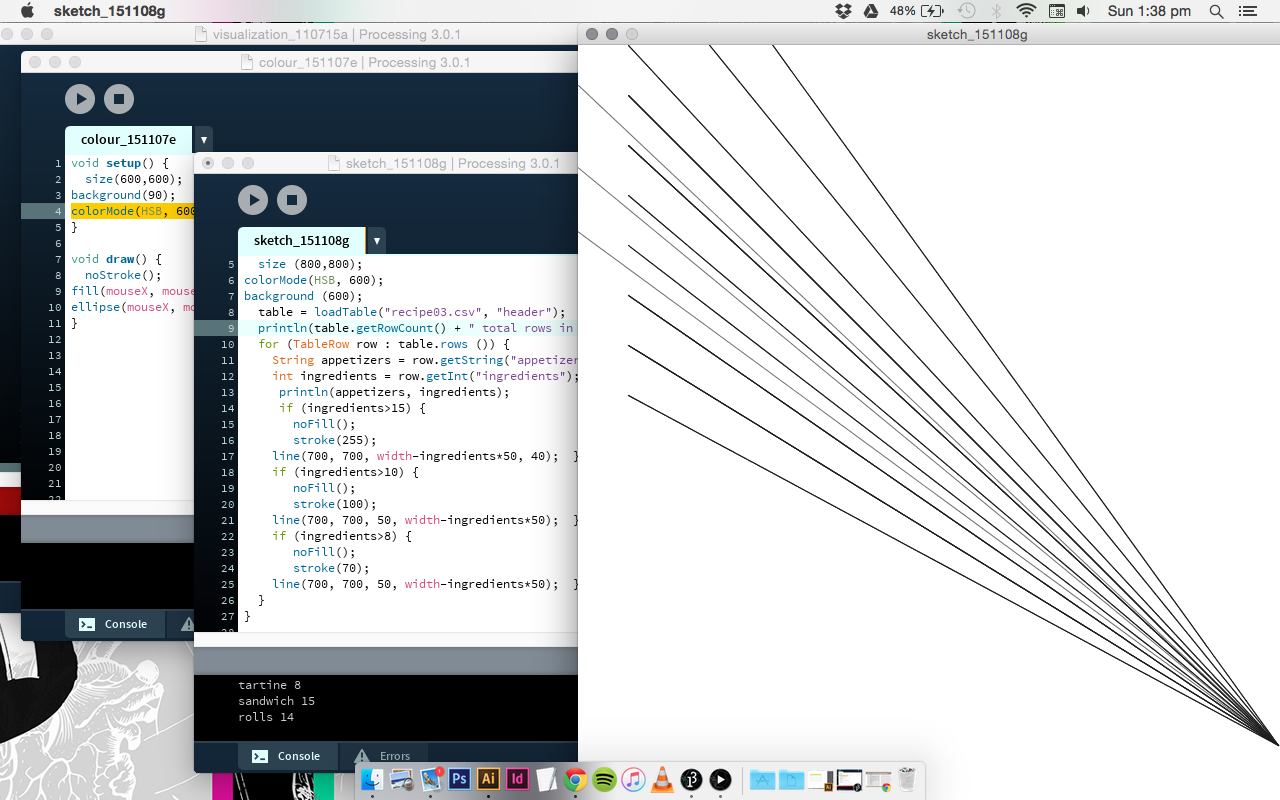
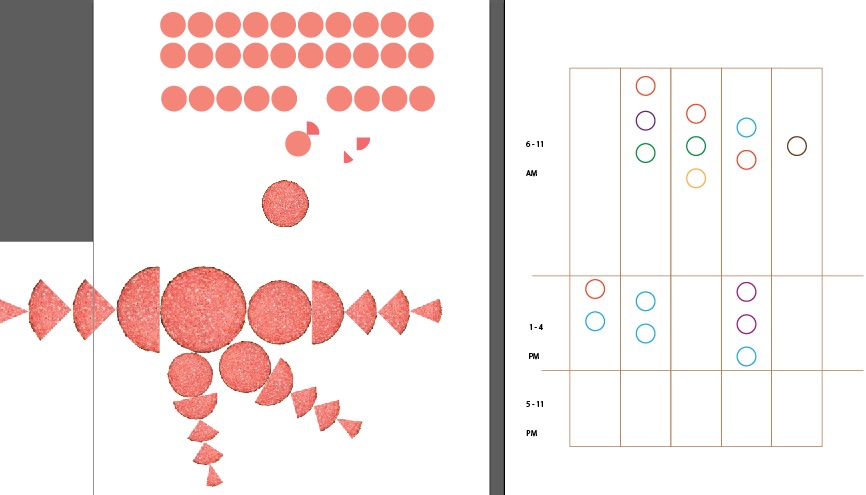
The possibilities of what you can do with Processing is limitless. Learning the programming script is akin to learning another foreign language. One of the key things I’ve learn with Nicholas Felton on Processing is actually how to input data into the program. We made spreadsheets on Google Sheets, converted them into a .csv (comma separated values) file, which is readable on Processing, and then using coding, we are able to create visualisations out of it. The above screenshot with the lines is an exercise I am working on right now. The number of lines is generated by the values from my spreadsheet. This is all very sketchy at the moment, and I’m working on adding the graphical elements later on. This is another really important thing I’ve learned this week, and something I probably will not be able to figure out on my own.
So, week one in summary is learning how to create visualisations with the help of coding, or by hand, and I am really glad to be able to learn from Stefanie and Nicholas, who are very, very good at their work.
Something else I’ve picked up this week from them is actually how to present your work. Watching these designers speak about their work is so, so inspiring. They are very confident and clear about what they are trying to say, and this helps a lot particular at this point, when I am simultaneously working on my FYP prep. Everyday I have something new to add to my presentation.
This week is particularly intense, but I hope I will polish up my presentation and be good to go by Tuesday.