

As I skimmed through the databanks of Wunderground, a global online weather network, I realized how important data is to us in every aspect of gaining some form of confidence in making sense of the recurring behaviors of the world around us. There are certain aspects of the project that was interesting but there were definitely some improvements I could’ve made to it to build the layers.
 I Started out wanting to build layers of data to build an intricate series of interwoven lines and solely utilize that aesthetic. But I soon realize that it was far too little and there was a lack of objectivity to it and thus I wanted to embark on a direction that’s more scientific and something that has a functional purpose.
Building on the sentiments that I’ve previously felt about the nature of time as a constantly flowing, ephemeral and intangible quality, I made use of something that’s far more material and tangible which is the volume of rainfall in Singapore. I wanted to accentuate the nature of how we always like to use pieces of information from the past to determine the future. For us to have a fairly accurate weather forecast, we need tidal data, wind data and many other conditions and recurrences. However, even in data forecast, it’s never 100% due to Chaos Theory. Thus, this project gives an overview of weather conditions in Singapore for the past years and at the same time creating a series of interweaving and dancing data that creates a form of forecast on its own.

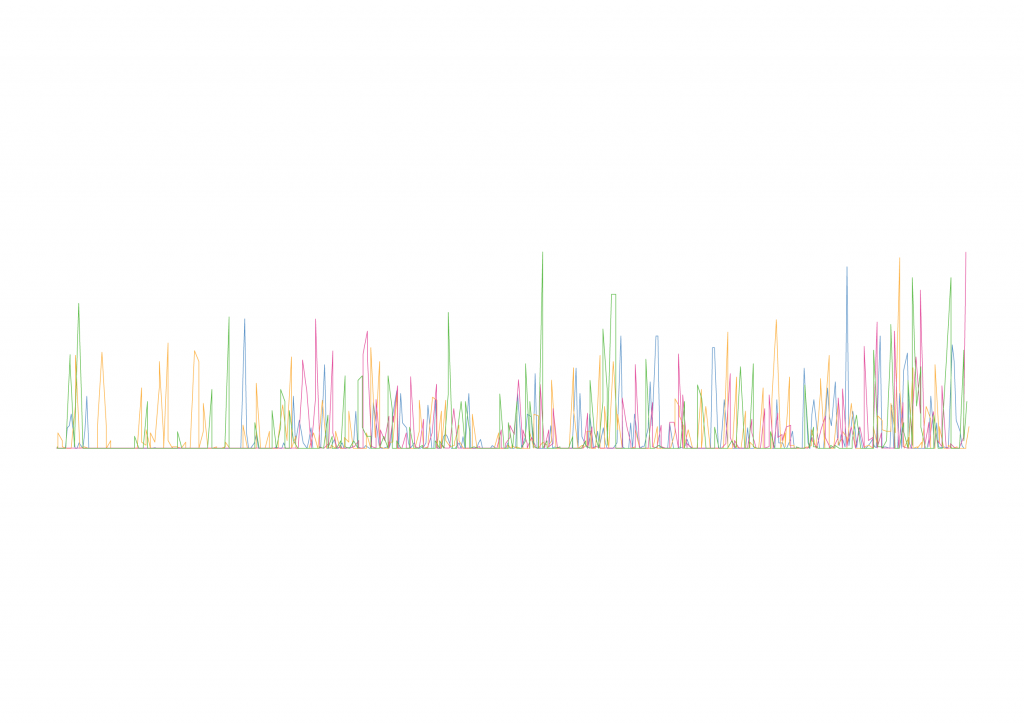
Looking at days as data blocks
An initial idea of executing the visualized data as a one-way flow with lines at the bottom signifying each individual days. (The different coloured graphs were suppose to vary in the actual outcome)

The final outcome followed the format similar to that a runic calendar that I shared earlier on. It has a sterile quality to it which I wanted and at the same time, I felt like I could’ve worked on the craft even more.
Using logos to represent different religious and customary holidays, I placed them to draw on the curiosity of whether “divine intervention” has acted on various days. Depth wise, I felt that the project would’ve been even more substantial if I collected more data. looking back perhaps in terms of decades in order to present some outcomes about the state of our climate and showing that our future could be very bleak if we didn’t do something about it.
I felt like I’ve forgone the initial art direction to the project, which was supposed to be a subtle and cryptic piece and eventually gotten everything labeled. I would say that this is something that’s a little different from what I’ve always done and stepping out of my comfort zone. Maybe I’ll execute my upcoming projects better with my intents made better known.
Back to perusing for now.