
Sooo it’s time to get started on the second project of the semester! We were each given a neighbourhood to explore and find out about what makes that neighbourhood unique as well as interesting features in that area.
The place that i got was QUEENSTOWN! But before I went down to explore the neighbourhood, here are some secondary research I did on the neighbourhood as well as some research into infographics.
Your site/neighbourhood – some history/background/what is it known for?

- first Satellite new town to be proposed in Singapore
- named in commemoration of Queen Elizabeth II’s coronation in 1953.
- pioneer of many firsts in public housing history in Singapore
- underwent major development from 1960 to 1965 as part of HDB’s first Five Year Building Programme.
- first estate to Launch “Home Ownership Scheme” in 1964
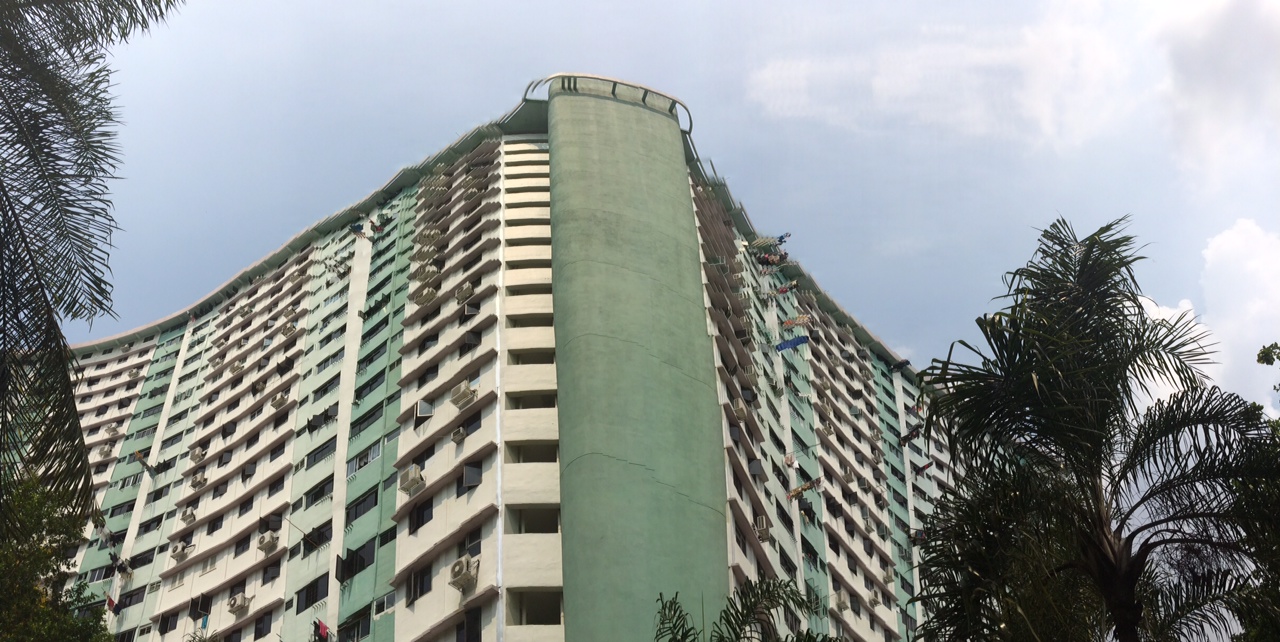
- First 14-storey (Forfar house) and 16-storey public housing blocks (Block 81, Commonwealth Close)
- First Blocks by Housing and Development Board (HDB) 45, 48 and 49 Stirling Road.
- Block 168A, Stirling Road was the First aesthetic Block constructed in the year 1973. This block is also known as butterfly block
- remains as one of the 2 HDB estates to have double storey terrace flats at was built by SIT in the 1950s to attract the well to do.
- total of 5 neighbourhoods were initially planned for Queenstown, namely Princess Estate (present day Dawson & Strathmore estates), Duchess Estate (where Blk 6C and the Terrace Typology HDB flats are located), Tanglin Halt Estate (next to Commonwealth MRT Station), Commonwealth Estate and Queens’ Close Estate (comprising of present day Alexandra hospital)
- place where many social institutions were established
- 1956, Queenstown Secondary Technical School was the first technical school
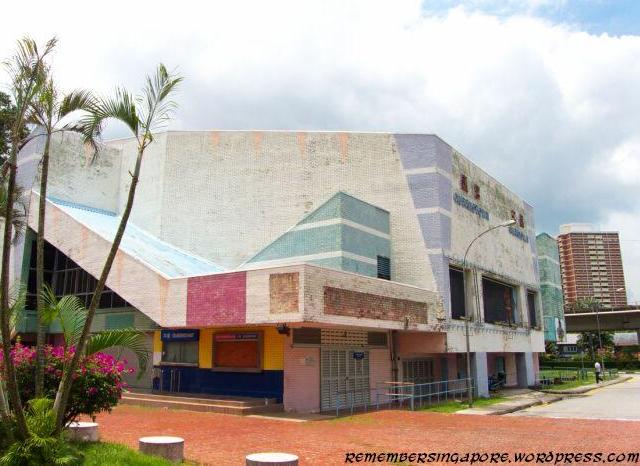
- 1963, Singapore’s first polyclinic was built along Margaret Drive
- 1970, Queenstown Community Library, the first branch library in Singapore
- 1980s, Queenstown estate was becoming stagnant without much new developments.
- 1994, the Urban Redevelopment Authority (URA) issued a Development Guide Plan for Queenstown
- proposals for a new sub-regional centre in Buona Vista, new infrastructure to link tertiary educational institutions and business parks, and good, high-density housing.
- rejuvenated in the form of the Selective Enbloc Redevelopment Scheme, whereby older flats were demolished to make way for new ones
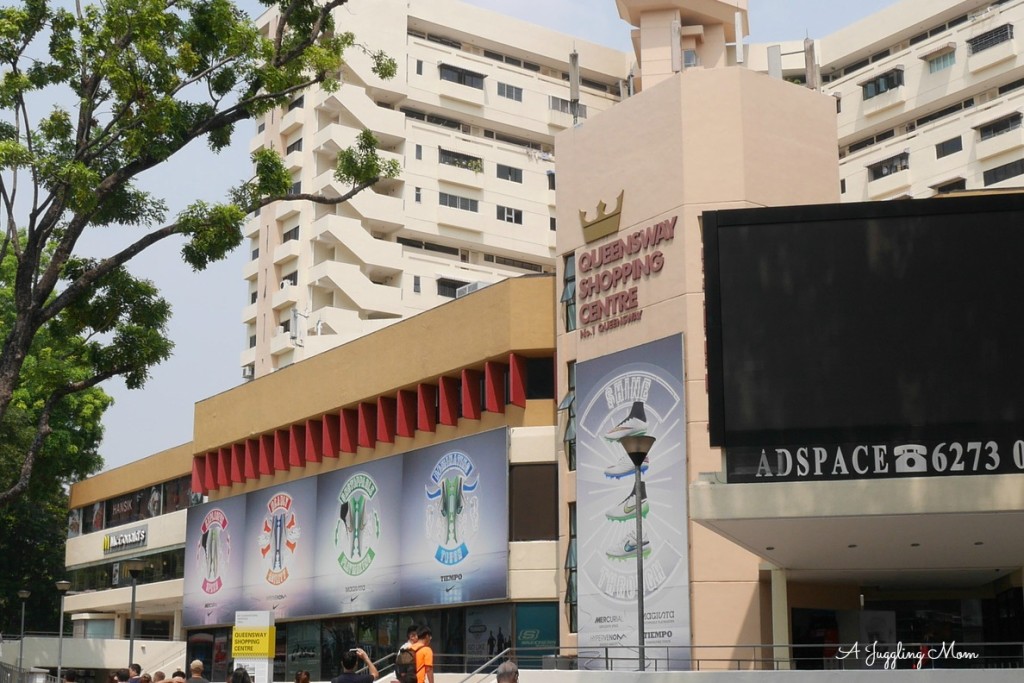
- construction of new private residential housing, the opening of Swiss furniture giant IKEA’s flagship store, and the launch of The Anchorage, a condominium-cum-shopping complex.
History
- formally a swampy valley with two hills named Hong Lim and Hong Yin.
- Hong Lim hill was a cemetery for over 100,000 Chinese graves,
- Hong Yin hill was covered with orchards and rubber plantations.
- was formerly a A village called Bo Beh Kang, literally “No Tail River” in Hokkien, was settled by mainly Hokkien, Teochew and Hakka dialect groups.
- area also housed a British military camp, known as Buller Camp
- swamp, cemeteries, farm land and camp site were eventually cleared to make way for the development of Queenstown housing estate
In the 1990s and 2000s, many iconic landmarks in Queenstown, such as Tah Chung Emporium, Queenstown Remand Prison and Margaret Drive Hawker Centre, were torn down to make way for re-development.10 In 2013, three buildings in Queenstown, namely Queenstown Library, the former Commonwealth Avenue Wet Market and Alexandra Hospital, were announced to be gazetted for conservation under the URA 2014 Master Plan.11
What is ethnography and participant-observation? What are some ways collecting data?
Ethnography – the systematic study of people and cultures.
Participant-observation – one type of data collection method typically used in qualitative research such as interviewing, observation, and document analysis. Or the process of learning through exposure to or involvement in the day-to-day or routine activities of participants in the researcher setting
Data collection can involve active looking, improving memory, informal interviewing, writing detailed field notes, checklists, questionnaires
What is qualitative and quantitative data? What is the difference between primary and secondary sources of data? How would you go about collecting the two?
Qualitative Research
gathers information that is not in numerical form. For example, diary accounts, open-ended questionnaires, unstructured interviews and unstructured observations. Qualitative data is typically descriptive data and as such is harder to analyze than quantitative data.
Quantitative research
gathers data in numerical form which can be put into categories, or in rank order, or measured in units of measurement. This type of data can be used to construct graphs and tables of raw data.
Primary data is collected by the researcher him/herself in response to a specific question with a specific objective whereas secondary data is not collected by the researcher him/herself but rather reliant on the survey results, interview recordings or experimental outcomes collected by others.
Primary data would be more tailored to the study, easier to control and accurate compared to secondary data that can be vague or outdated.
Primary data- observation, interview, questionnaire,
Secondary data – letters, diaries, biographies, historical journals, internet
What are infographics and how are they used to effectively communicate data? What other ways can we visually represent data?
- An infographic is data-rich visualisation of a story or thesis, a tool to educate and inform.
- are more likely to be read compared to text articles.
- express complex messages to viewers in a way that enhances their comprehension.
- convey a self-contained message or principle.
- compress and display this information in a visually pleasing way so that drivers don’t miss the message.
- communicate complex data quickly and clearly
ways to visually represent data:
- indicators
- line chart
- column chart
- bar chart
- pie chart
- area chart
- pivot table
- scatter chart
- area map
- tree map