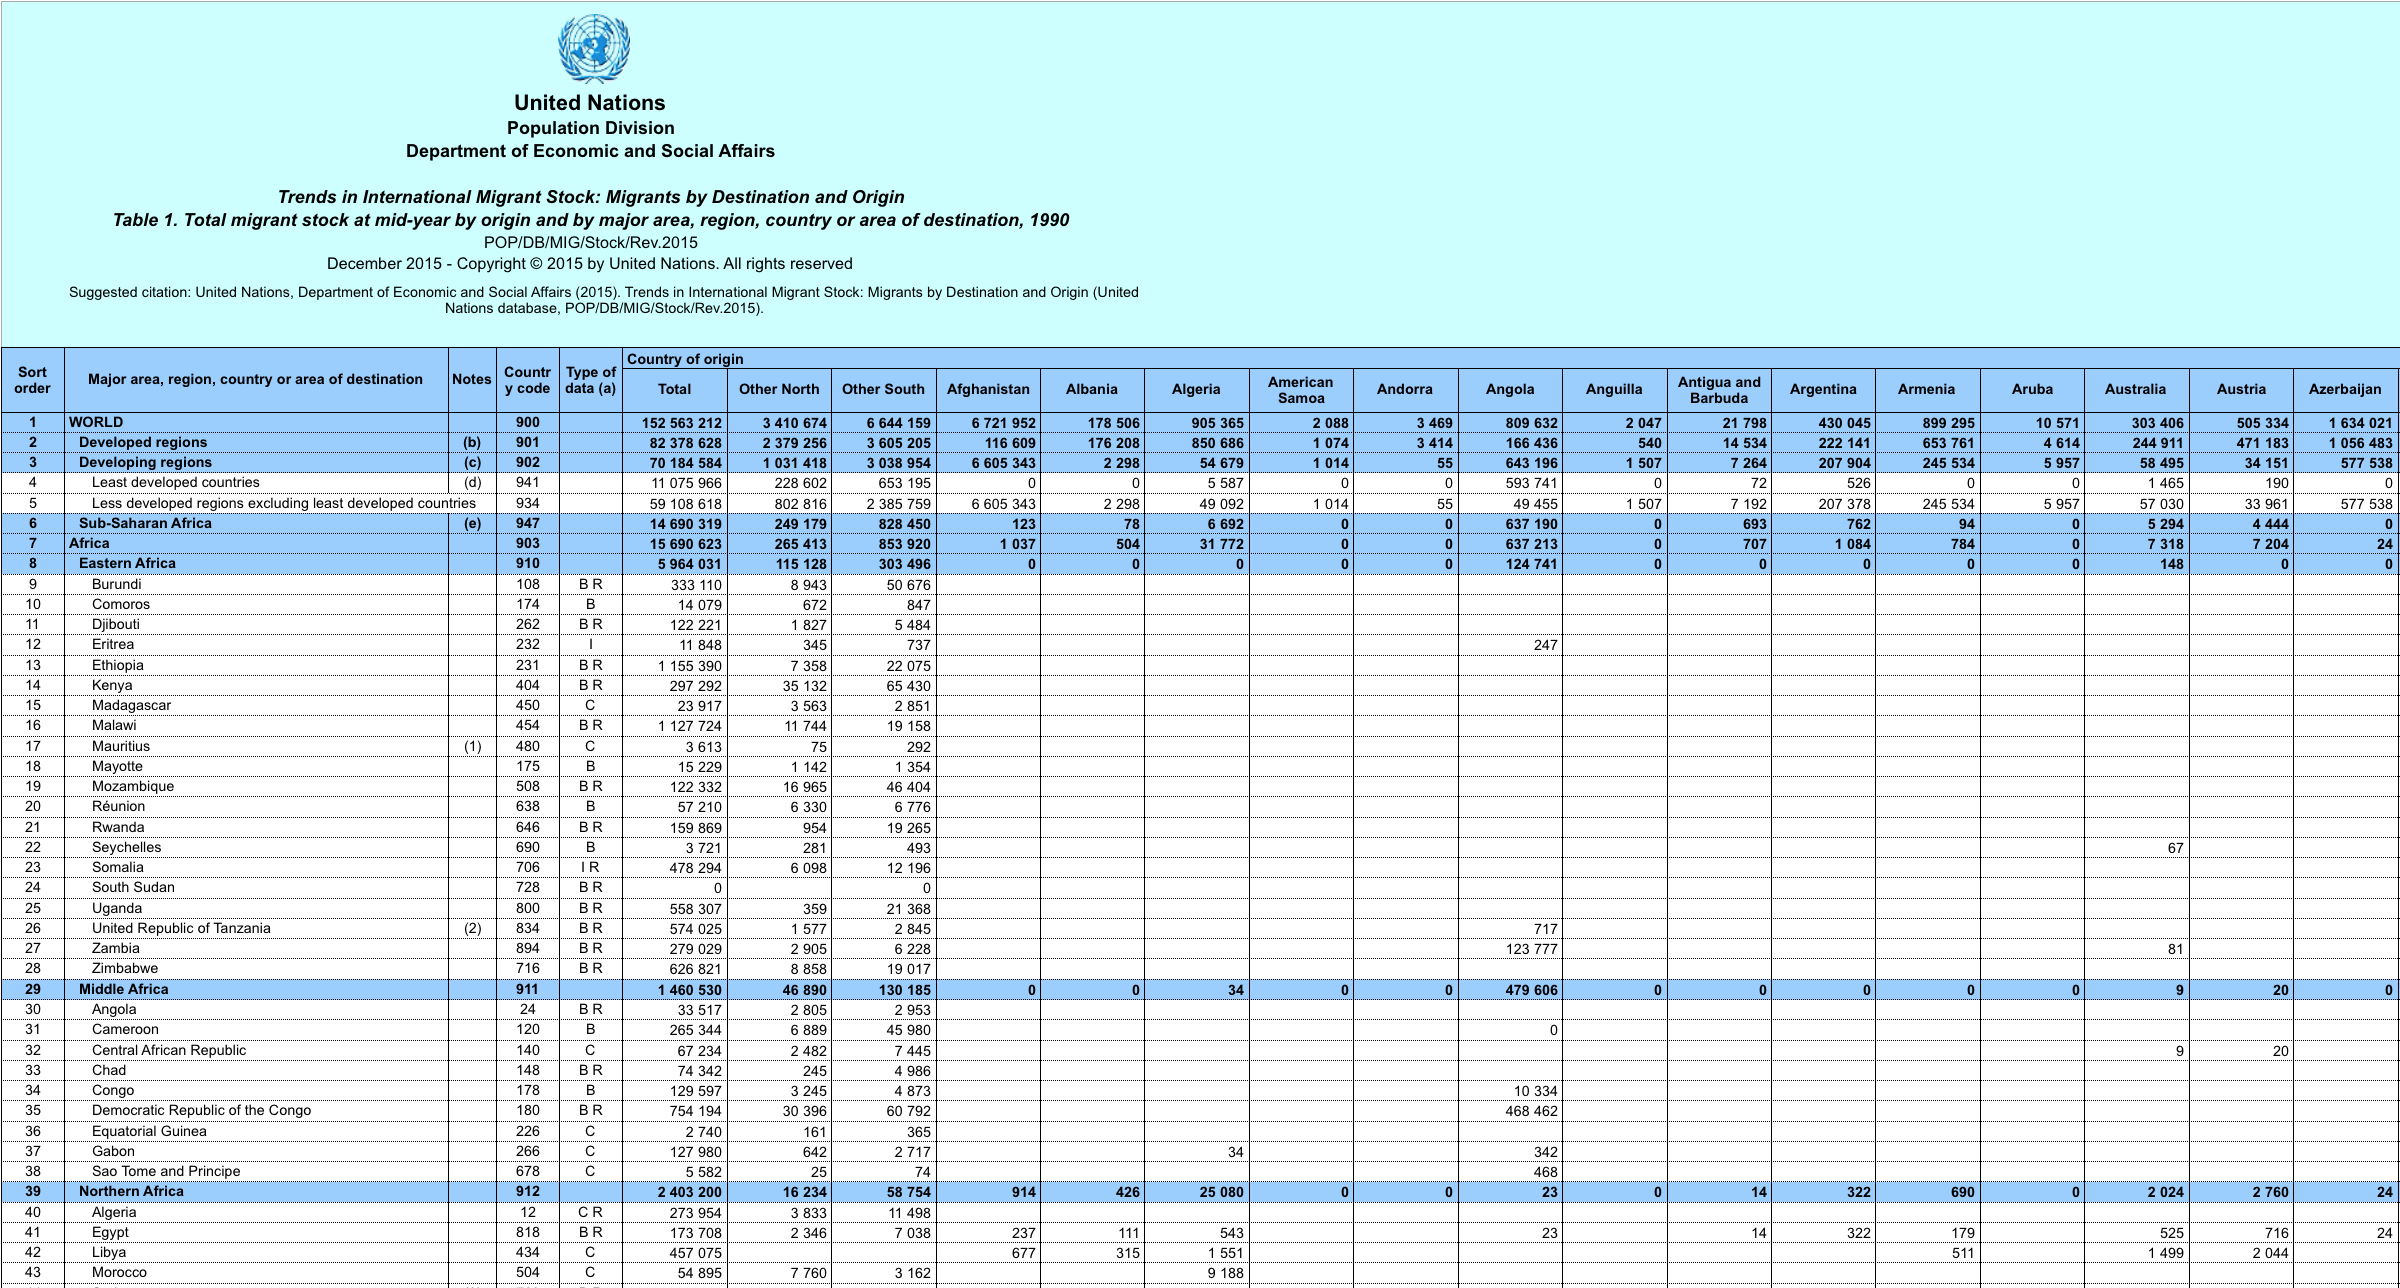
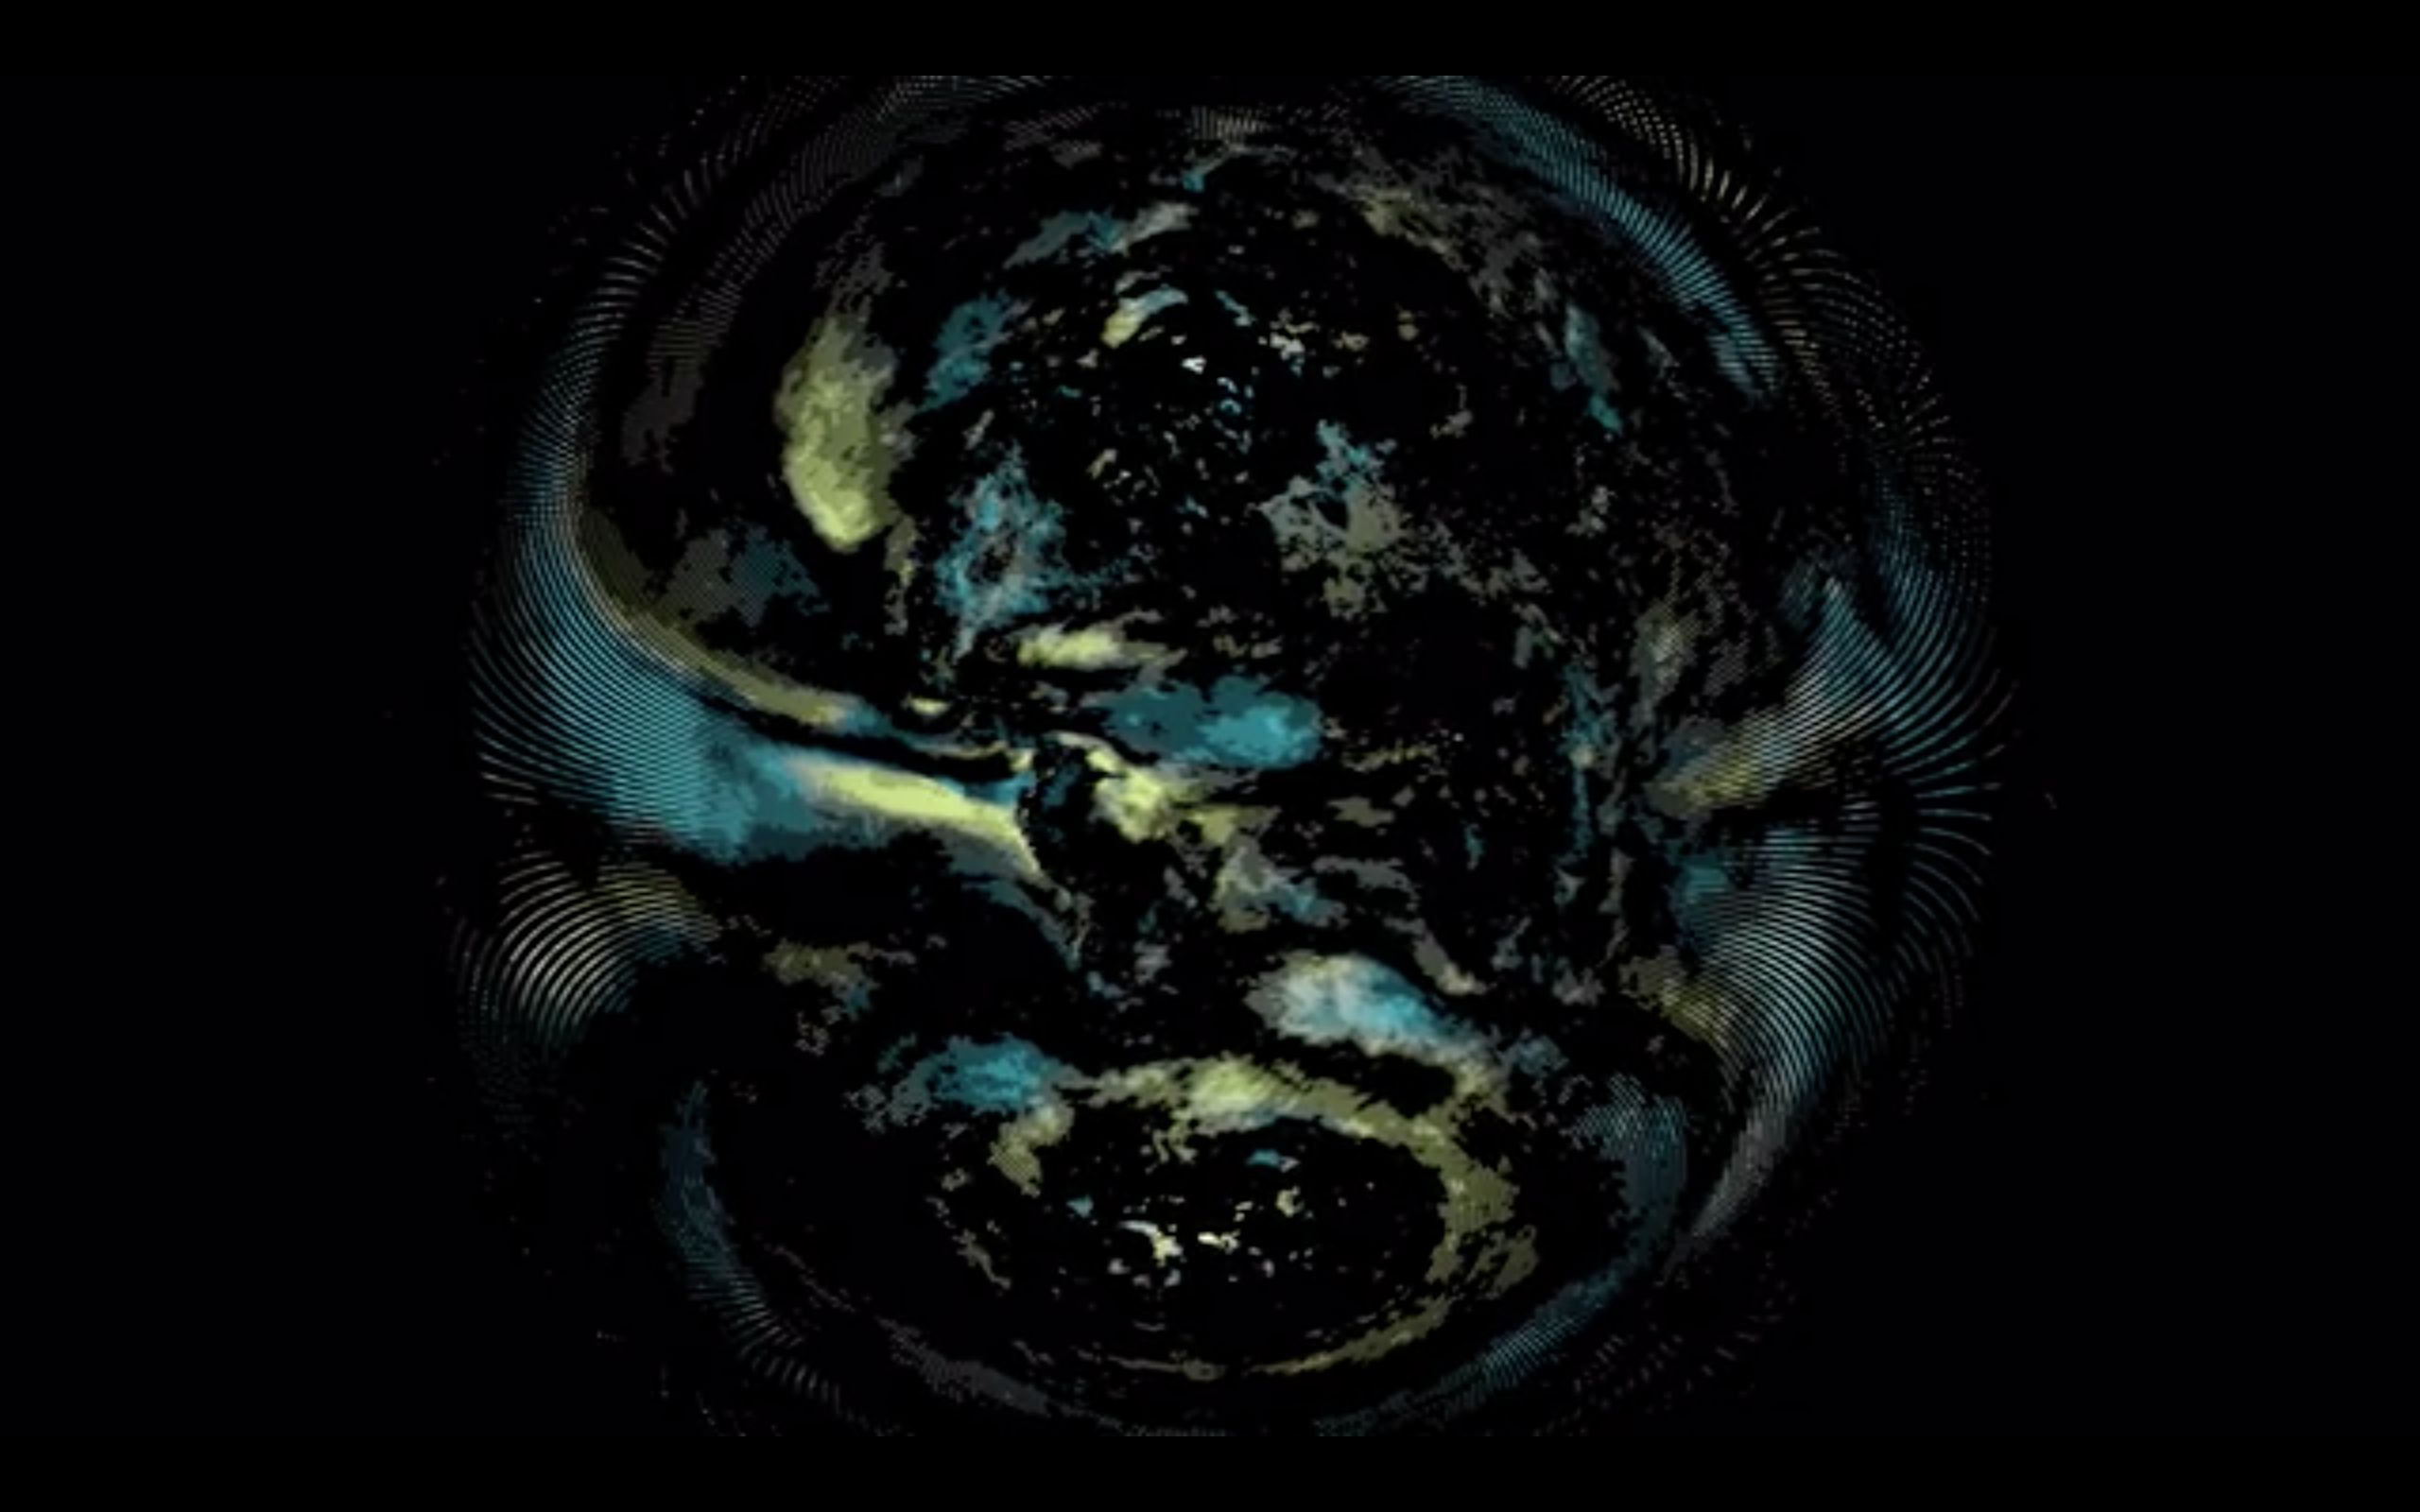
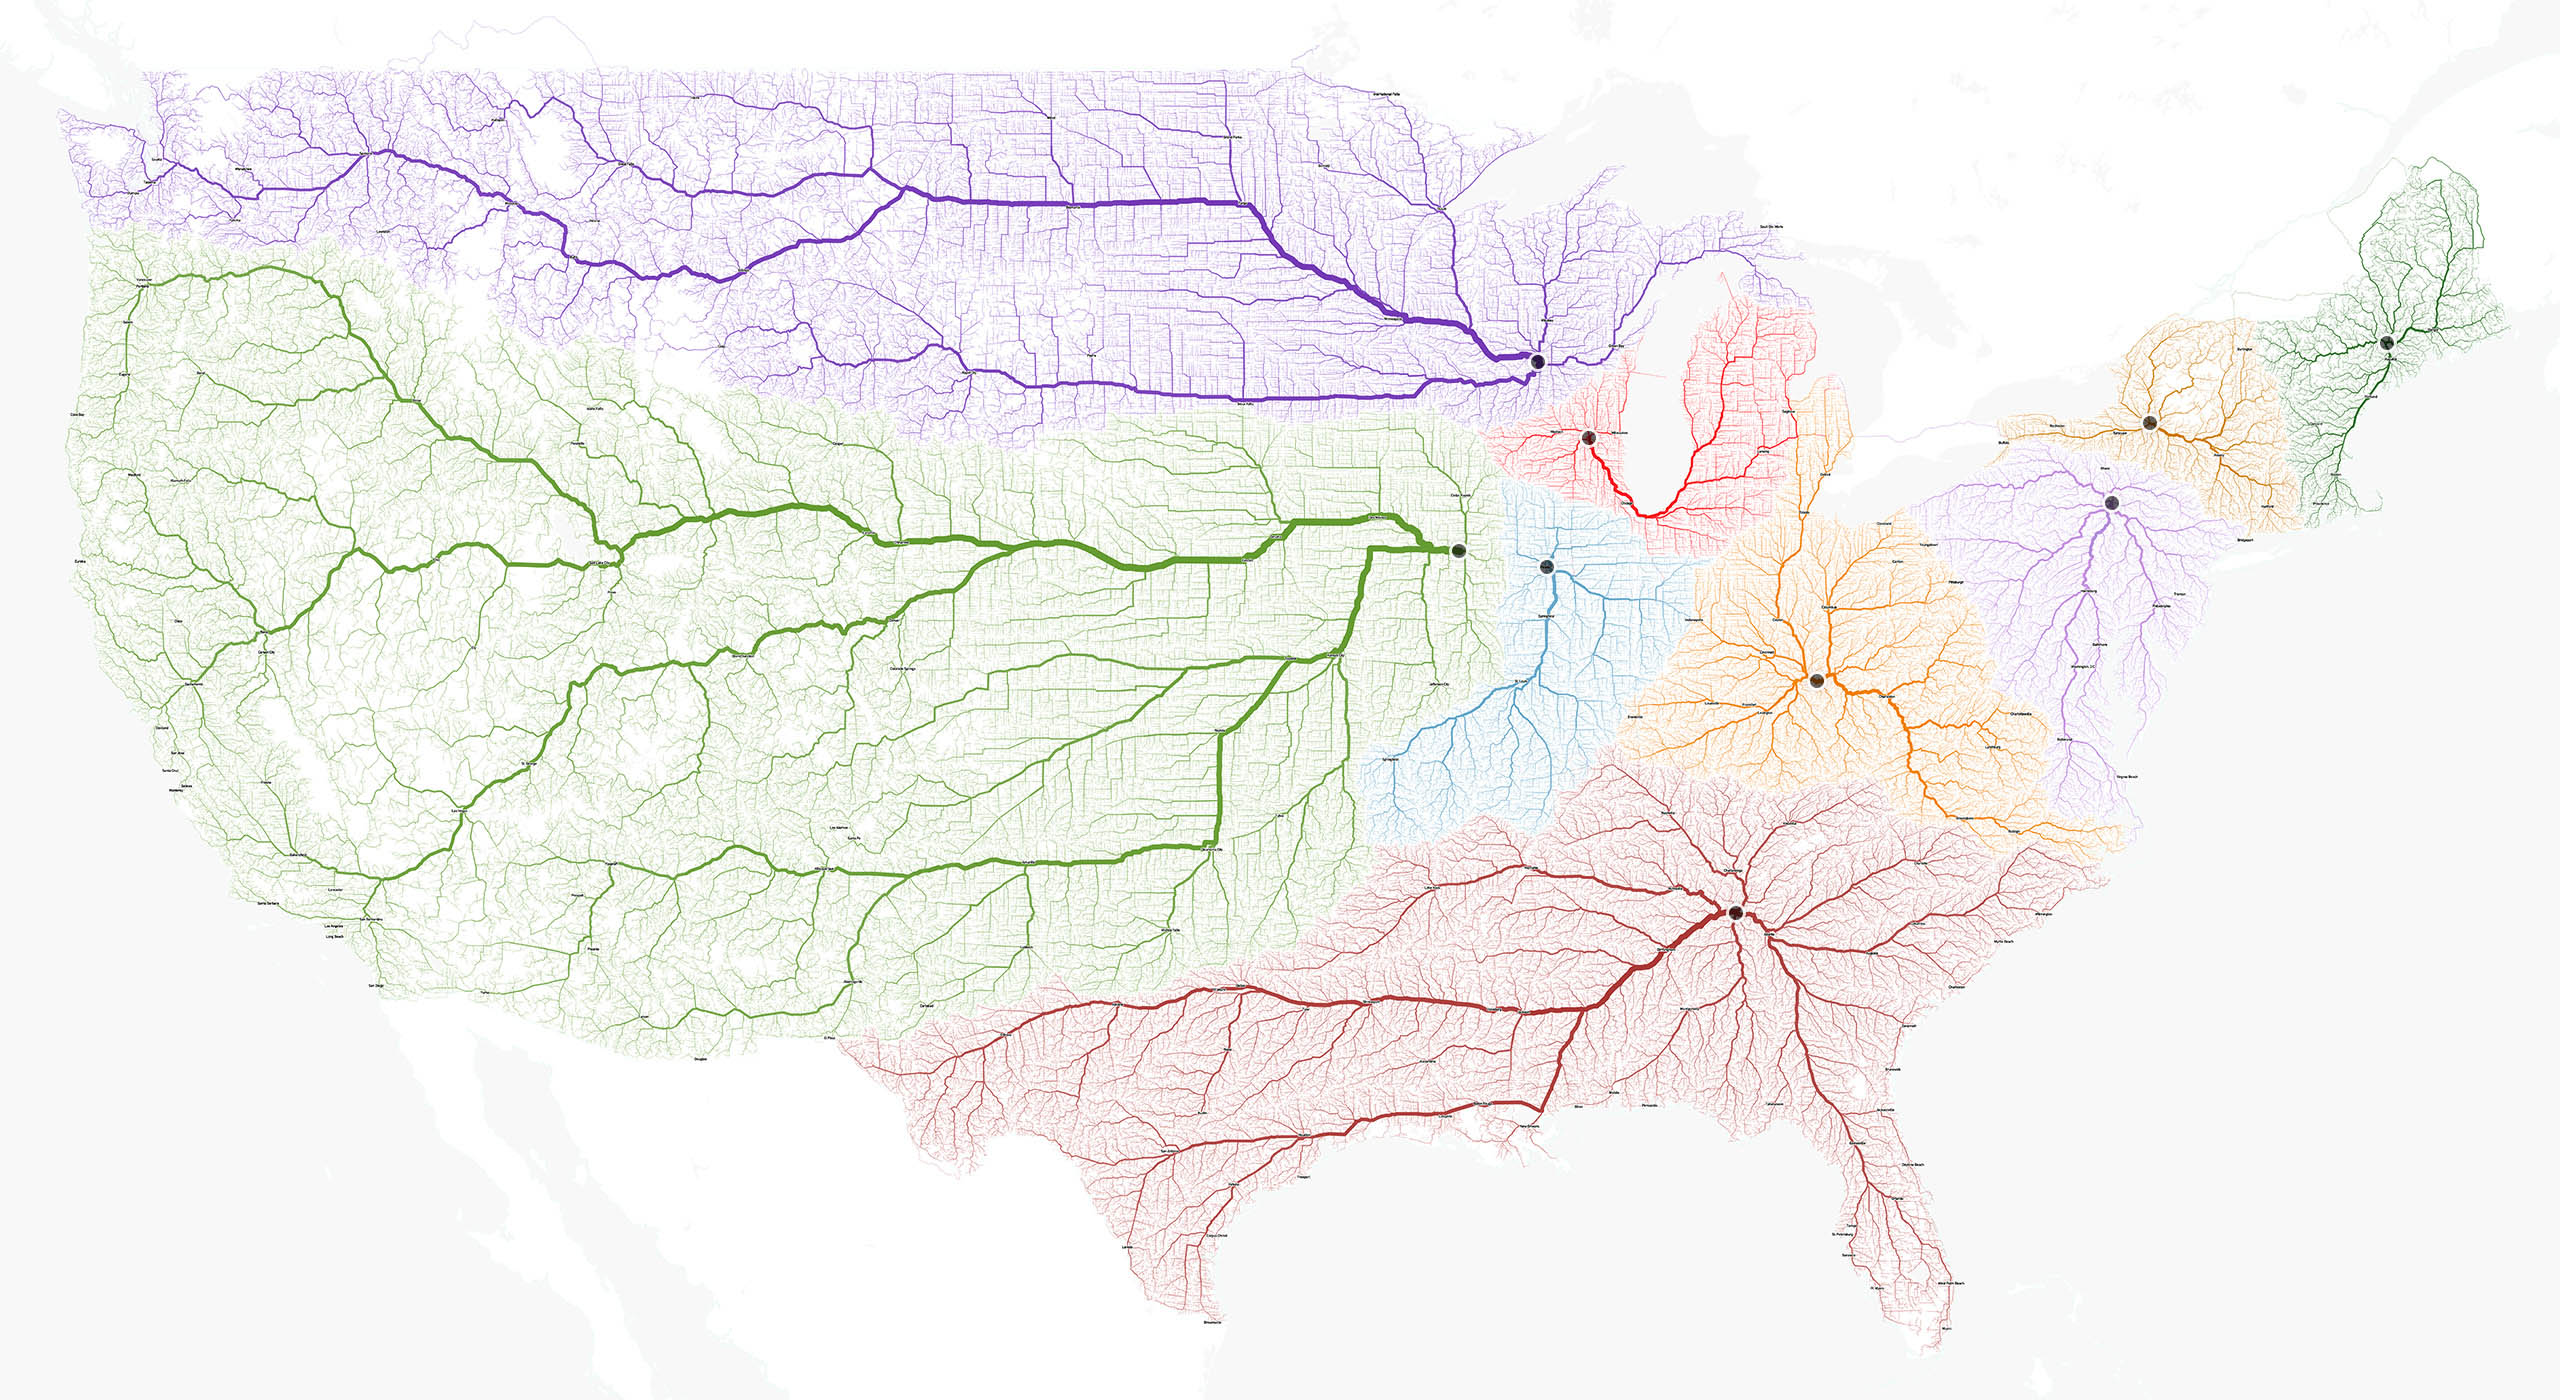
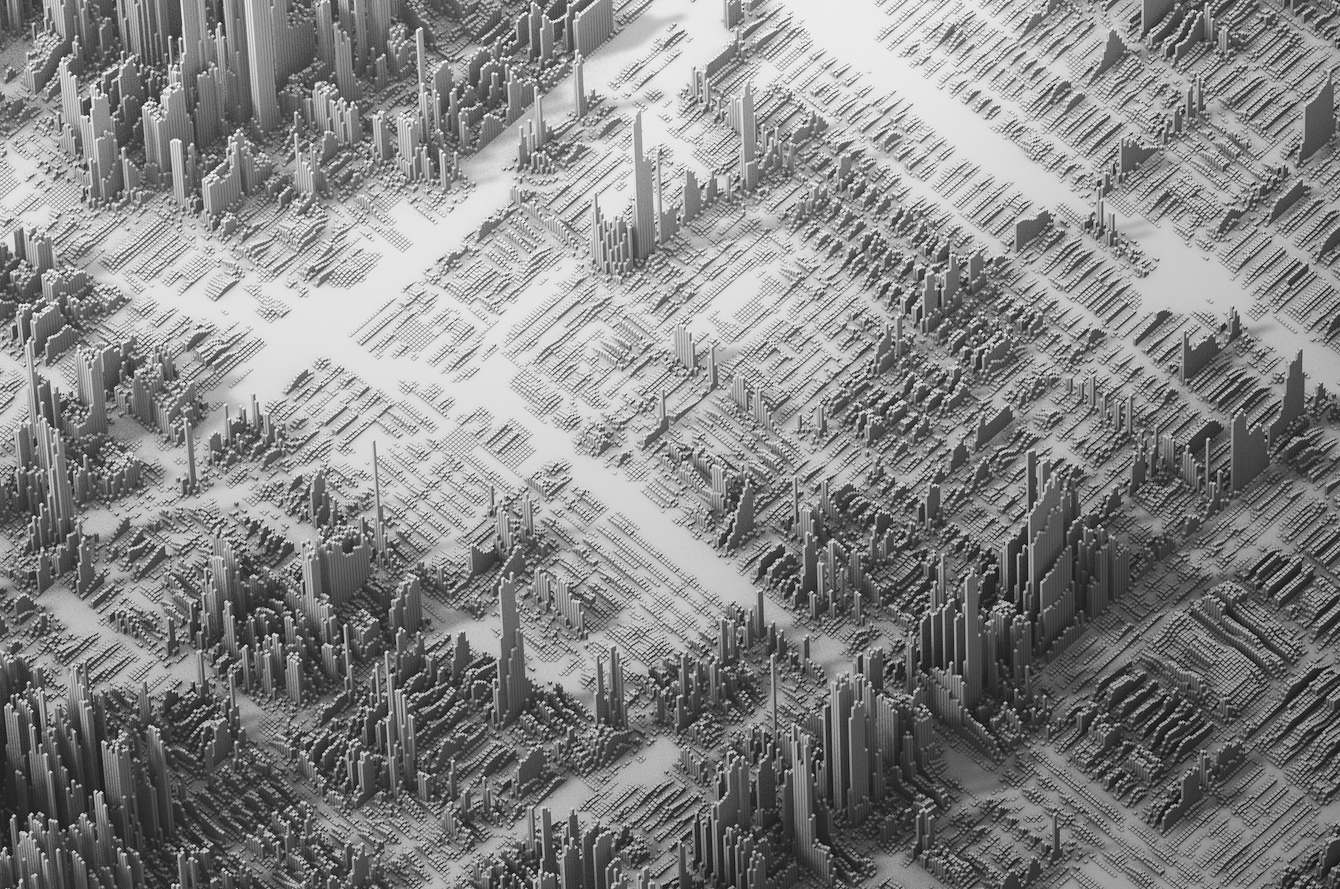
I had a very vague idea of what I wanted to do— visualise the data of migration flows. I had a reference for visuals (Tatiana Plakhova), and I had found a large collection of data by the UN (Migrants by Destination and Origin, 233 nations), and an odd sketch that consisted of just curves.
The difficulty was how to develop the visualisation, what medium to use, how can I draw hundreds (maybe thousands?) of curves from one point to another accurate to the large chunks of found data I had.
I ventured to an online class on Skillshare.com , taught by data visualisation designer Nicholas Felton on using Processing. This was a great starting point that introduced to me about importing data into code— in the format of CSV (comma separated values), as opposed to excel sheets that come in the form of tables.
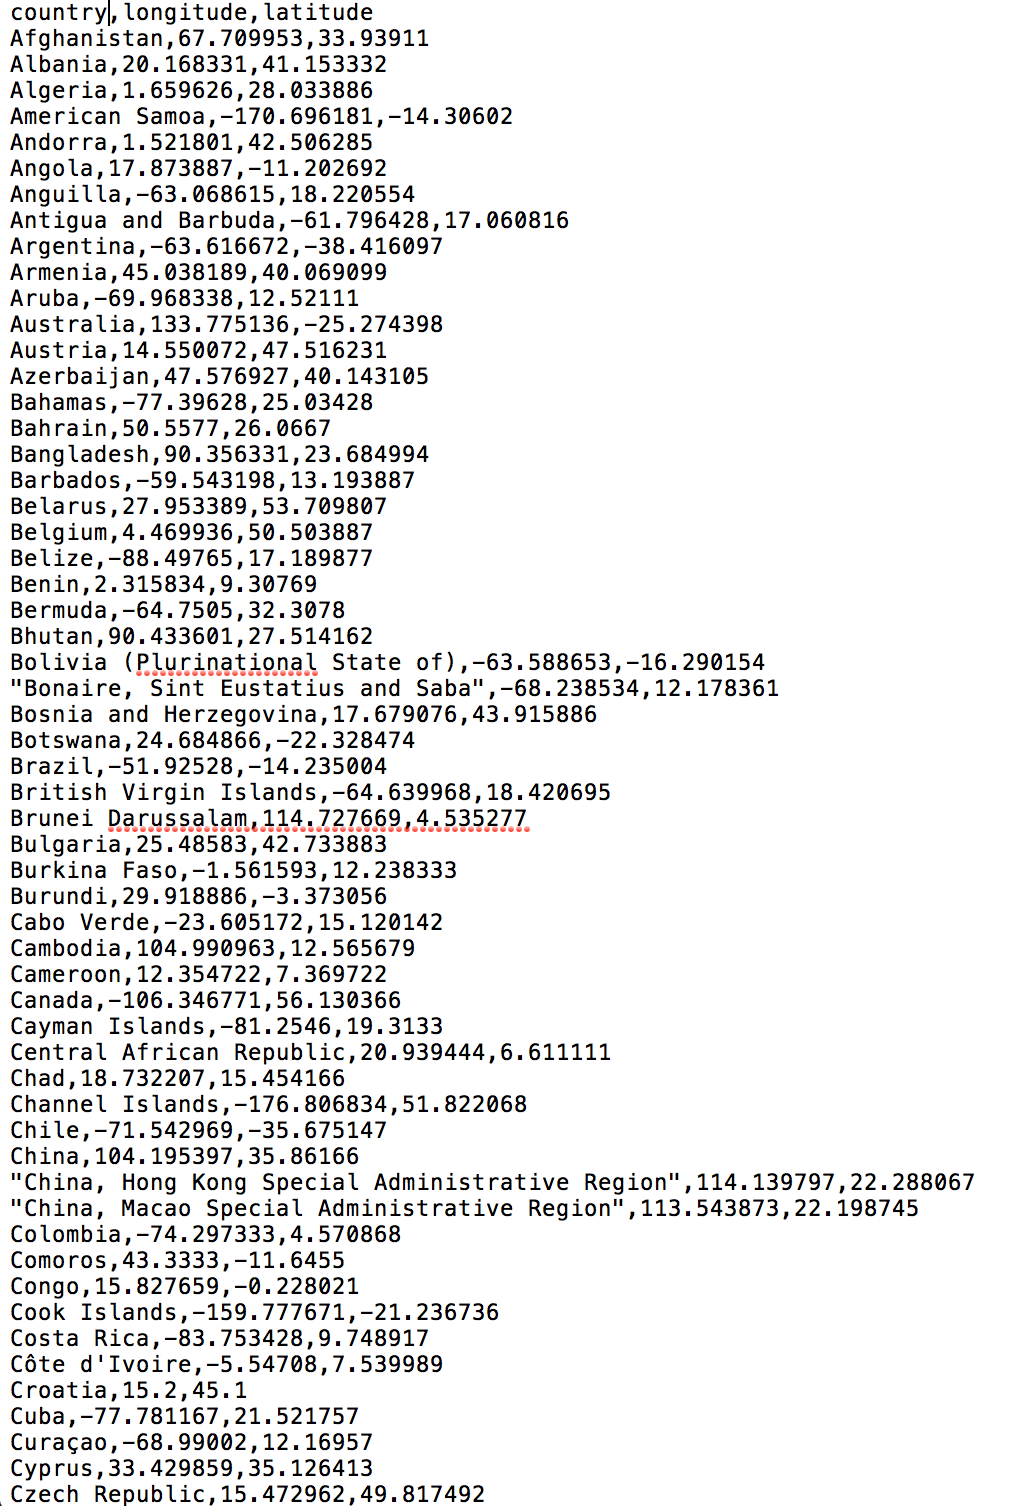
The way I saw my data was that it had multiple factors (categories, variables, headers… just many “groups”) to take into account:
- names of countries
- long and lat coordinates per country
- number of migrants by origin
- number of migrants by destination
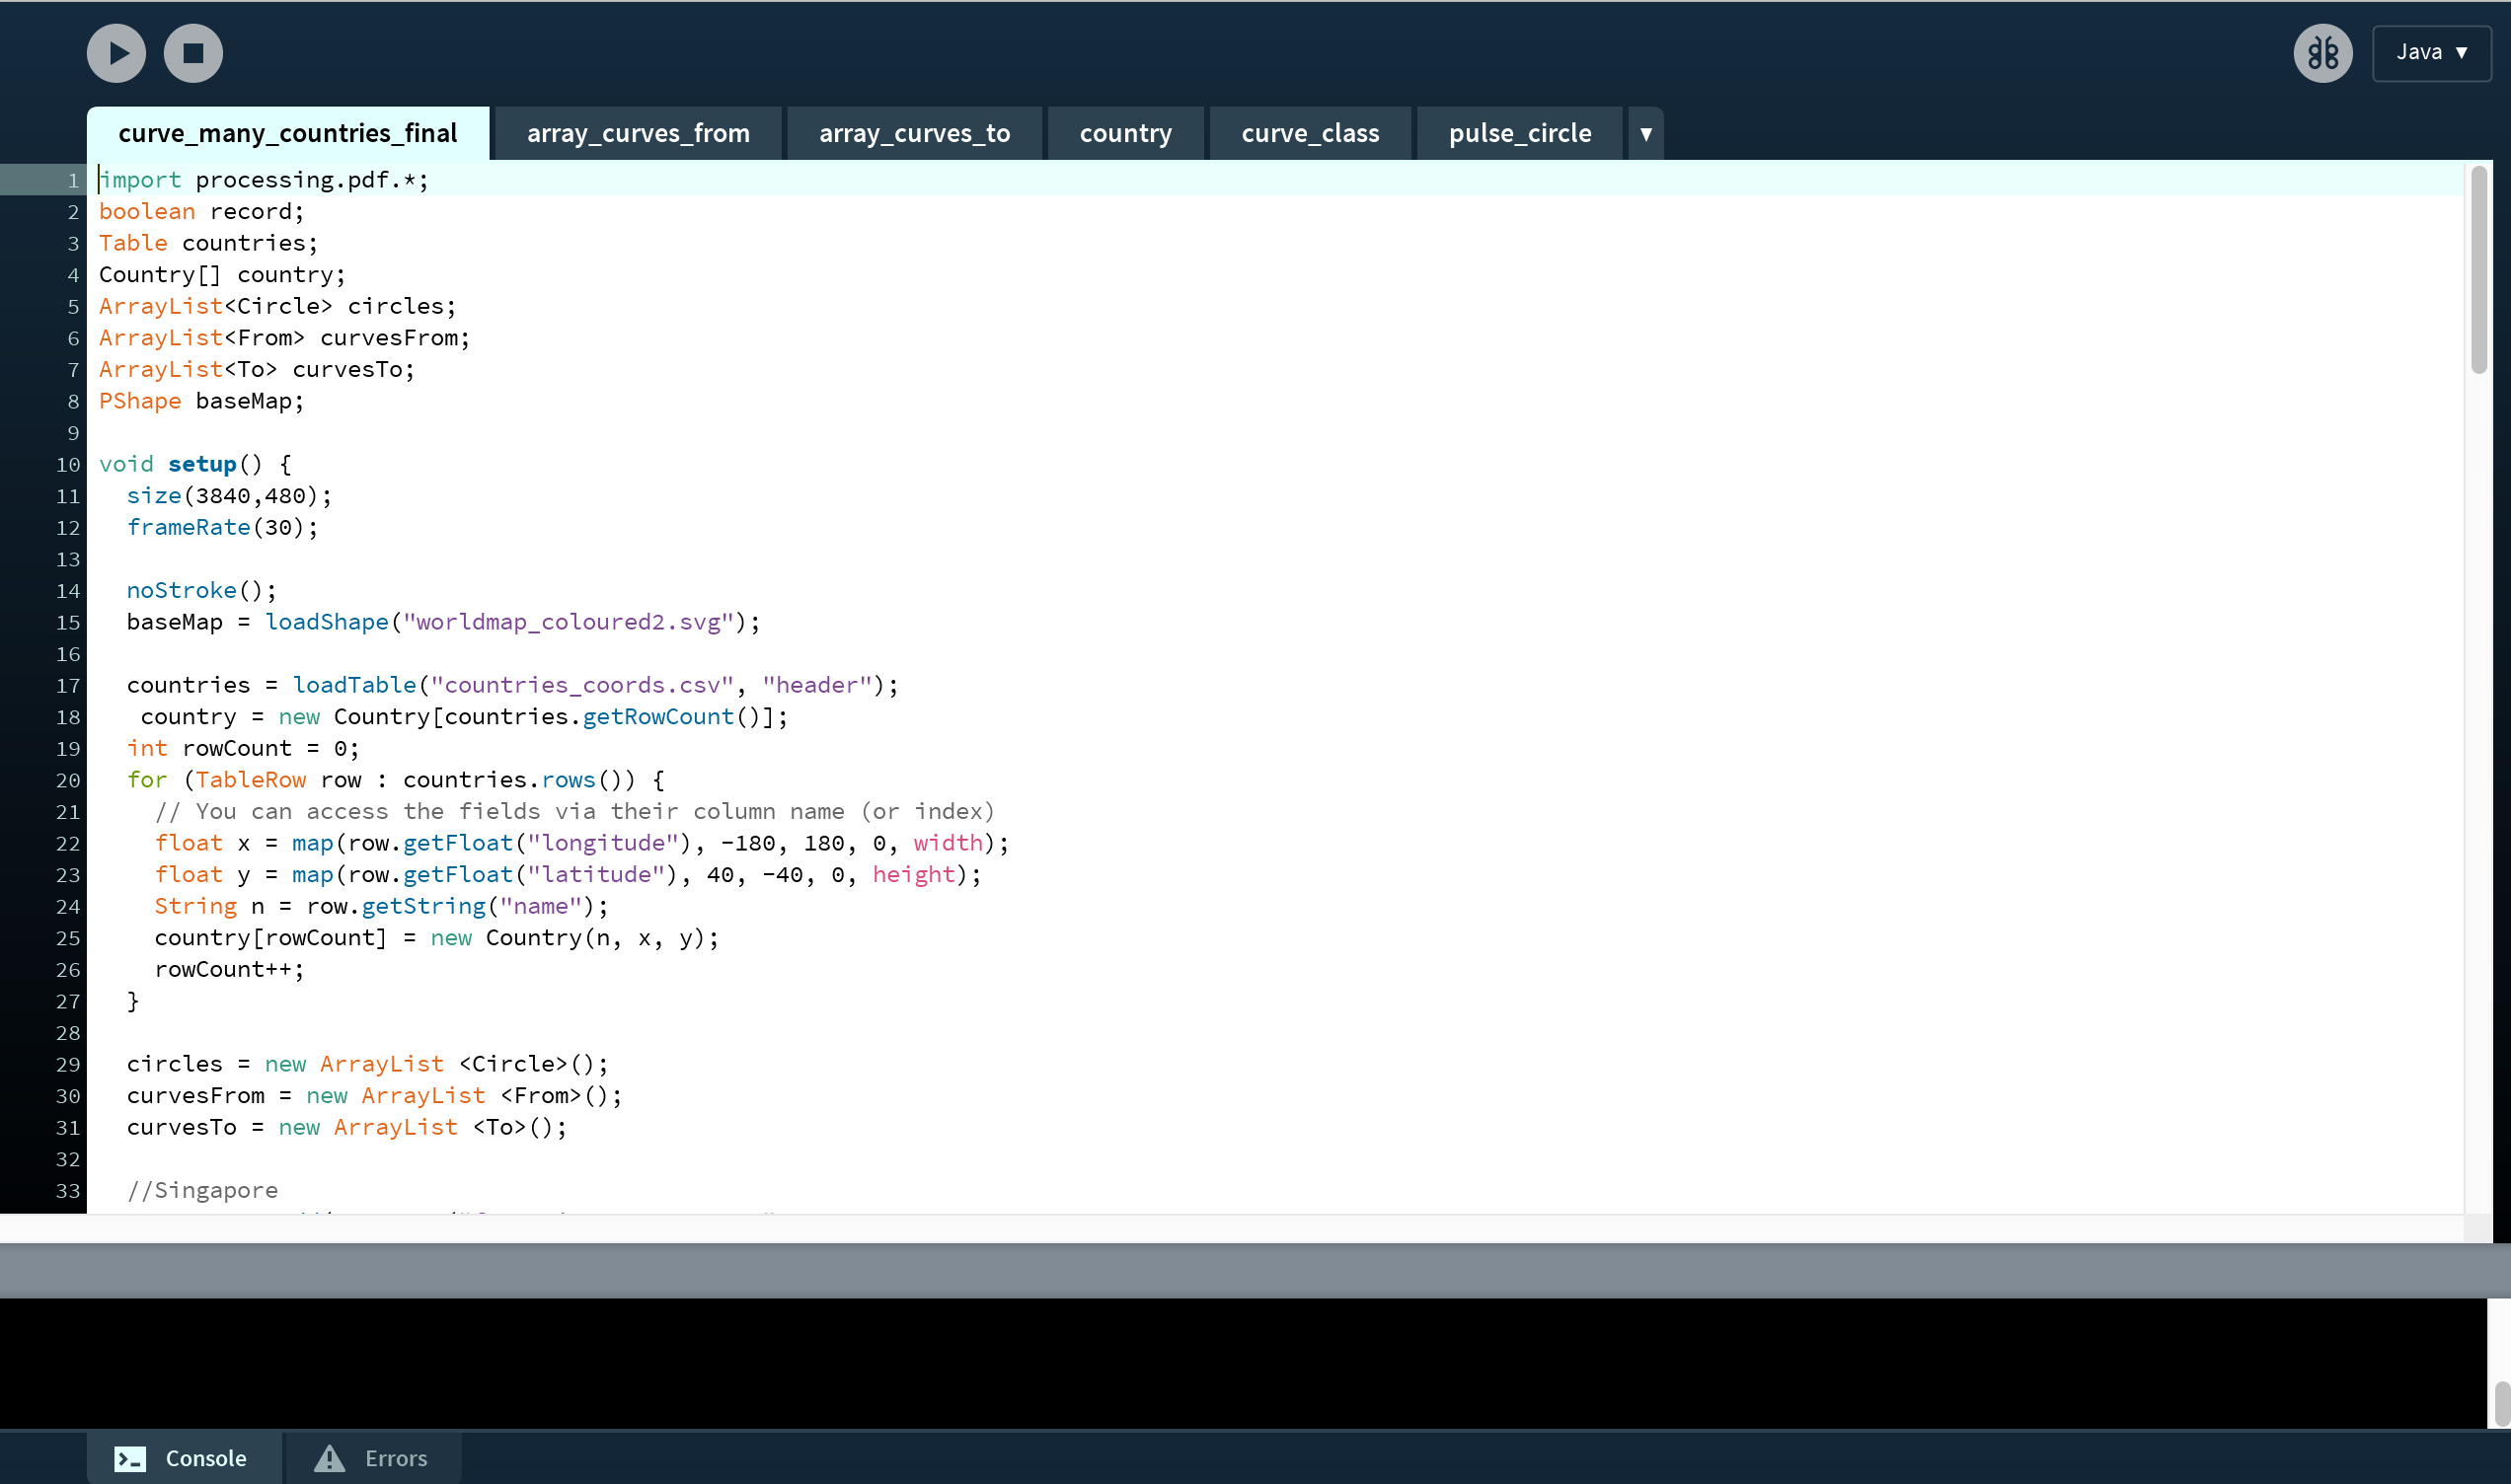
So my strategy was to parse in code the data such that in one CSV:
- name of countries + longitude coordinates + latitude coordinates
and that would be fixed and referable when I import another CSV:
- country of origin + country of destination + migrant flow number
Basically, I was trying to get the code to understand that these two data sets are supposed to work together. I referenced Processing’s resources on various methods trying to create the multiple relationships… but all I achieved was making sense the first set of data. The computer and I were thinking in very different languages.
All I achieved was this useless program that had red dots to plot by coordinates the 233 countries, and the name of the country appeared if your mouse hovered over it. And a lot of Syntax Errors.

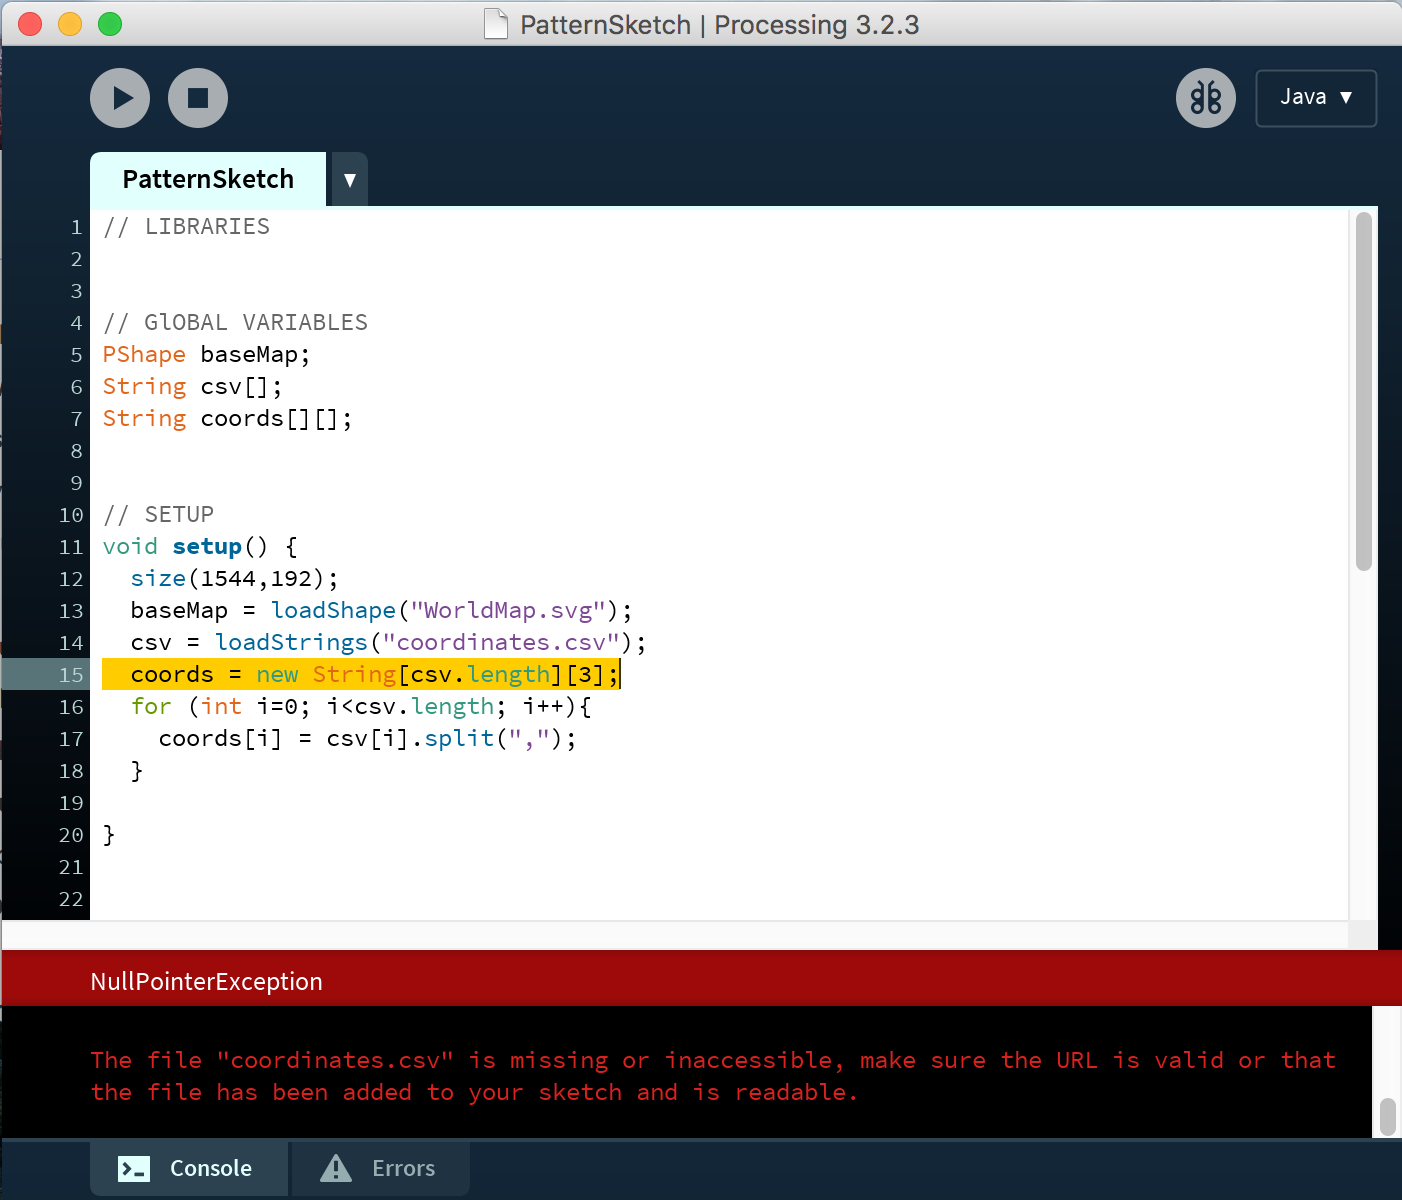
I was stuck on this problem trying to solve it for 10 weeks.
Then (breakthrough!!!) I decided to take a different direction. Instead of plotting all the location points then drawing the curves between them, I would try drawing the curves then plot them according to the location. So I went scouring the internet for how to code curves in motion.
I came upon to awesome example— using an exponential equation to draw a curve with ellipses taking into account starting and ending point.

Jackpot.
So I copied and studied the code on how was it done, manipulating bits and parts if I can loop the curved motion of the ball from specific points of origin and destination. Tested it,

then two curves,

then taking what I had learned about CSVs from Nicholas Felton and drew multiple curves to and from one point by referencing a data set.

Having figured this out, it became pretty straightforward experimenting how to include multiple data sets of origin/destination points. Then how to write the code such that they were of different colours, moving at speeds correlating to the number of migrants.
At this point I had realised that including all 233 countries worth of data was going to create an impossible amount of noise (and likely crash my computer), so I chose six nations to compare and contrast: Singapore (a must), USA, UK, Australia, South Africa (destinations recognised for heavy traffic on the global hierarchy) and tiny American Samoa (this one, actually because it’s small like Singapore and on the far left of my atlas, which was empty).
My code was quite long at this point, and many things were repetitive. So I learned to write classes for groups of code that behaved the same way, so I could have multiple sets of similar code but varied with just the change of a few defined variables. This made things like changing colour easier.
Here I was pretty much done, with just some problems/ refinements to be solved.
- laggy animation— troubleshooting by testing elements in the code found that the trails drawn were inefficiently slowing down the program, so I eliminated the trails (which were unnecessary anyway).
- it looked to abstract— with just dots flying across the screen, we couldn’t really tell what it was about. So in went the map (imported as vector artwork) and later the names of the countries by their coordinates(that I then had to go into the CSV and shift the coordinates around so they don’t overlap).
- needed more dynamism— somebody mentioned it needed more moving in it (my dad I think, when I showed him) so I thought to include pulsing circles centred at the points of interest to represent the pull of migration flow. I read up various methods of drawing circles and wrote the code for a circle class that changed in size and opacity.

- getting Processing program to work on MAN— which was run with TD… there were some problems with allocating the screen output, so I just bypassed this problem by exporting frames from my program and converting them to MP4 on After Effects.
- sound— without which, this would just be flat. So I went looking for recorded digital sounds, clicks clacks and beep boop beeps. This new thing I learned, compositing and editing audio to create my very own sound clip just for this piece.
An that… was how I got to the finalised artwork, a composition of flying dots on a screen that people stare at trying to locate their country.


