Final Project — Initial Ideation

INtial Exploration

Strengths:

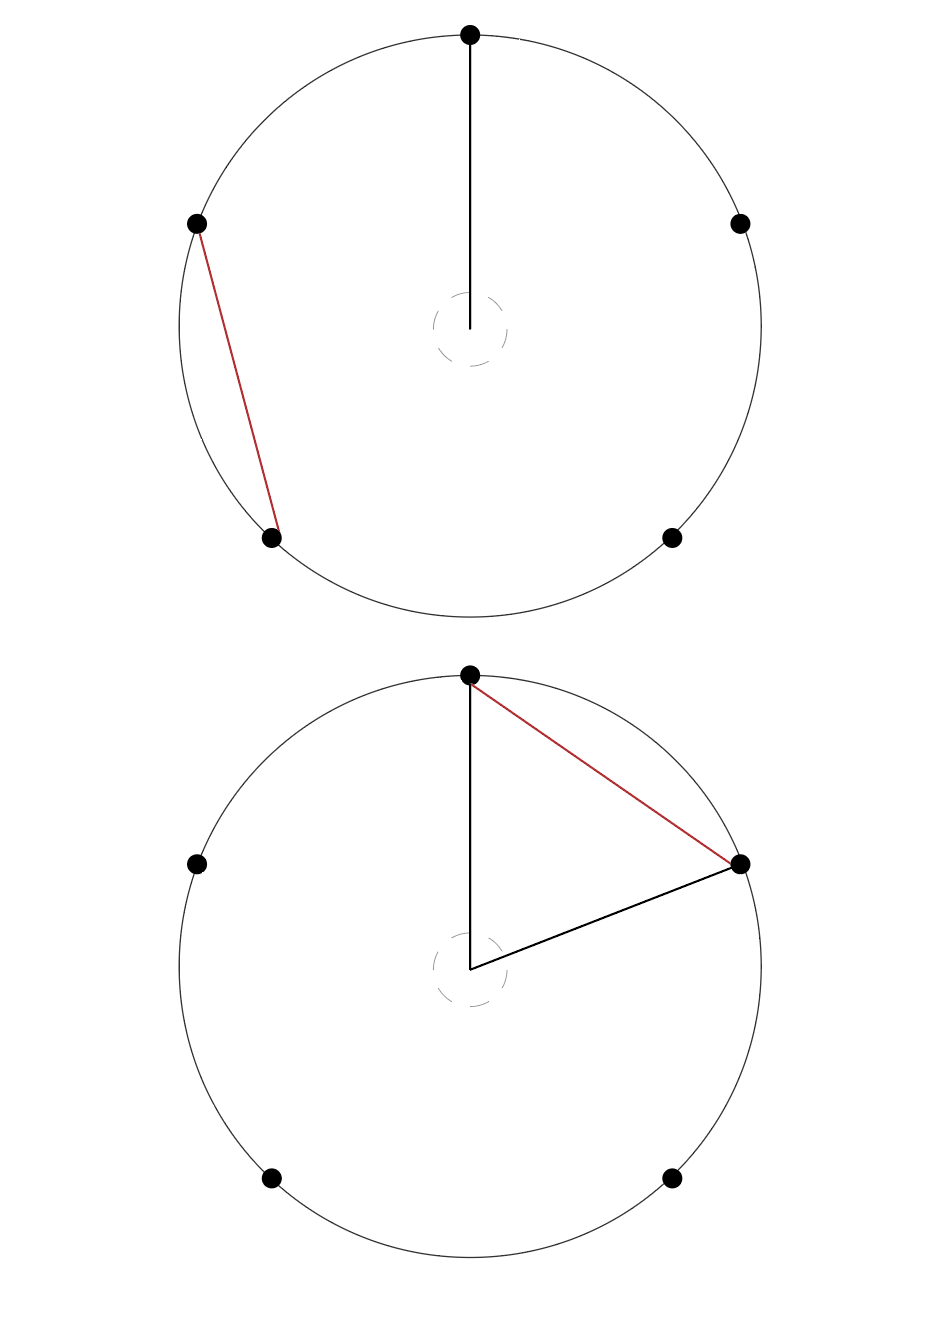
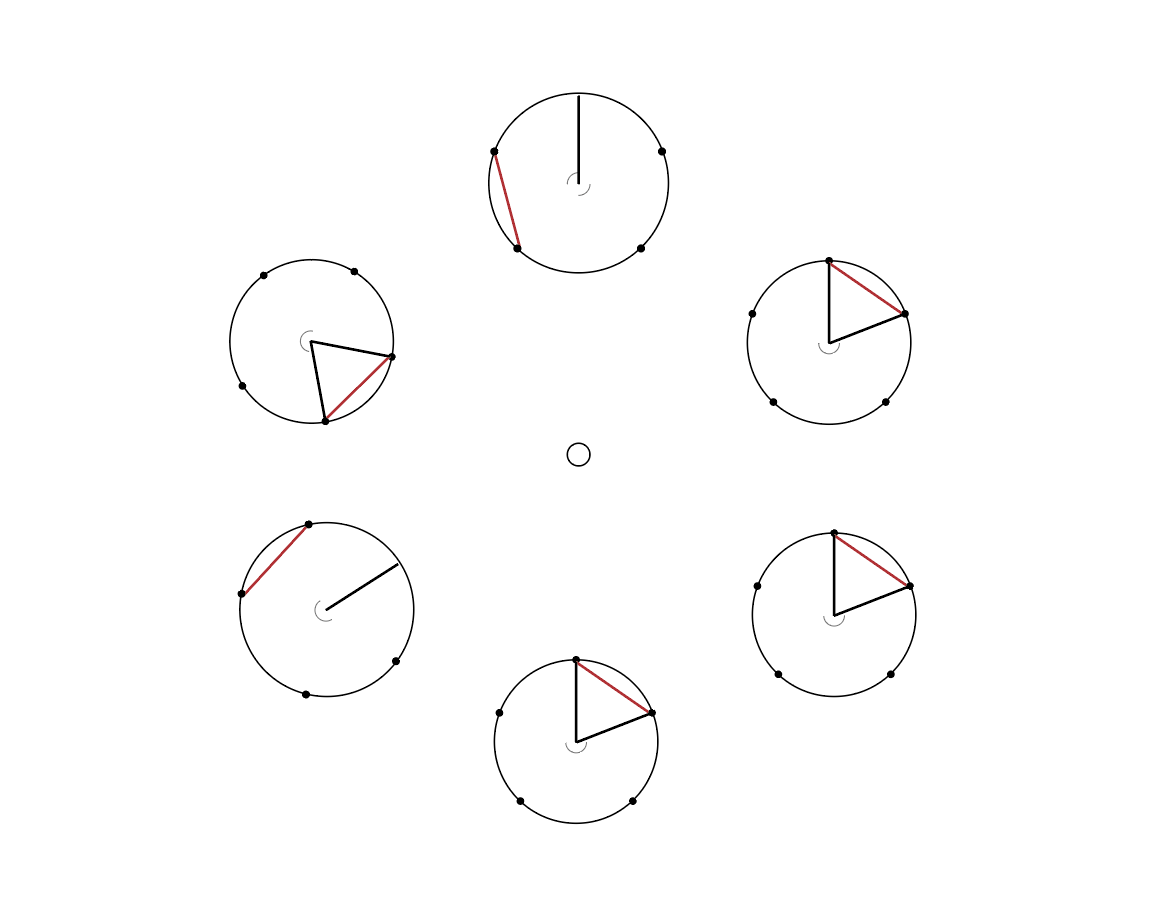
Exploration of Emotions via Text allows for us to dissect and observe the change in one’s emotional state over a period of days. We do not need to personally know someone but rather just have access to the information on their devices, to have a perception of their intimate self.

Weakness: 

Not visually powerful enough. The use of circles signify closure and was not ideal in exploring multiple relationships.

Idea 1: (Sculpture)

Topographical Map,
2-Dimensional to 3-Dimensional
Web-Like Structure with both Peaks  And Valleys.

(Areas of Concentration of both Positive and Negative Emotions)

Centre, Neutral line representing the timeline or days.

Digital/Physical Visualisation.


Inspiration


Idea 2 : Mixed Media

Simpler but possibly more visually powerful

Creating a Visual Map:
By using Identified Texts —> Assigning Emotion to it —> Looking at Date/Day Text was sent —> Look at Phone Gallery/Social Media to find Image/Tweet saved/liked on Corresponding Date.

To try and visualise if there is any correlation between the intimate interactions we have online vs the more subtle interactions we make with social media in itself. See if there is any pattern in the type of image that is generated or comes up for any particular emotion.

Do the emotions we feel and show via our texts influence the content we interact with on social media or vice versa?

16 October 

Emotion: Vulnerability

Text: ‘Please keep it to yourself’

Tweet Liked:

Image Saved on Gallery:

Outcome:

Creating a detailed visual database of the relationships we involve in, in the virtual world. Proof of Concept that our Devices provide access to our most intimate and private thoughts/feelings and that these information can be publicly accessed. Archiving information over a period of days, and then connecting the days with similar imagery to see if there is any correlation between emotion and type of social media ‘trace’ within the same day.

Exploratory Generative Study — Update

Contacts:

I will be working with 5 contacts (the few I mainly communicate and have some sort of emotionally intimacy with in this current period). It is significant to note that these dynamics might change over time and completely disappear too — this however will be part of tracking the transient role we play in each other’s life through our phones. If I happen to break communication with 1 out of 5 of the people, the data visualisation representing that respective person will be empty for that period of time. There will not be any additional or new contacts added into the system designed around the initial 5 subjects.

Time Period:

Will take place over a period of 1.5 to 2 weeks so as to have enough diversity in the visualised outcomes yet have some overarching structure/parameter.

Data:

Initially I only thought of recording the connections we made between each other based on similar keywords indicative of the same sort of emotion, and  the ‘background’ third party connections between the other users themselves make (via me as an intermediary). However I have decided to include the types of emotions within the graphs (categorising of them as either positive or negative feelings and taking note how these map out through the days).

The initial idea was to use discrete/isolated and progressive grids that represented each respective days. However I felt like the structure seemed very rigid and would be counter intuitive to the way they were meant to portray the very organic and salient connections of our digital relationships and intimacy. Hence I will be using circles instead (the centre being Myself, and 5 Equidistant points on the Circumference to represent the contacts).


Instead of organising them in a linear manner, I will be organising the circles themselves as part of a larger circular clock like interface or some sort of spiral — this will allow us to view the entirety of the data as one cohesive pattern/piece that can be taken apart slowly instead of a blatantly broken down grid structure. This improved iteration will require slightly more ‘effort’ from the viewer, increasing engagement and stimulation. Having no discrete start or end in a circular loop also reinforces the concept of transience and fluidity of digital intimacy.


Exploratory Generative Study

Themes

Shared Emotional Space, Virtuality, Latent Influence/Connections, Indirect Affect, Intimacy.

Concept

Exploring how our screens and phones have become augmentations of our psyche and emotions. Our phones are vessels that hold all the information about our lives — private and public.

We leave both digital and physical traces on our phones.

Physical: Fingerprints, the pressure, speed and direction in which we text on our phones is relative to our mood and state of mind – when we are arguing we tend to text faster. Some days we barely touch our phones or reply conversations when we’re feeling existential or disassociated from our world.

Digital: Text Messages are often intimate and representative of our state of mind. We engage with different people via text, creating a shared space with each one of them. We also leave traces on Social Media via Text or Visuals.

Aim 

To create a Visual Map of our emotions by identifying descriptive words associated with emotion in our text messages. While  taking note of the emotion expressed by the person we are texting. Our mood constantly changes and is influenced by everyone around us. Two people who are detached from each other can influence each other indirectly if they both communicate via an intermediary entity. For example if person A texts me and I am affected by his emotional state of mind, this then will have an influence on how I respond to person C. This is ever more so apparent in the contemporary world today where we are psychologically connected (voluntarily and involuntarily) due to the veracity of the digital/virtual world.

We are always multitasking and replying or engaging with multiple people at the same time unlike in real life where we do not have the ability to have multiple intimate dialogues simultaneously. Essentially my idea is to attempt to visualise a map that connects specific people via their expressed emotions and at the same time visualise how they play a part in influencing my mental state. Our phones have become augmentations of us and we barely pay attention to the way in which we engage with it and how this engagement has affect on our cognitive and emotional state.

Part of the exploration in this study is to take a step back and attempt to deconstruct the relationships we form in the virtual world (specifically text conversations) and sequence a set of representations that express this complex phenomena in a clearer way. By forming a sequence of simple ‘data graphs’ over a specific period of time, we can then track and process how  the people we text play a role in our lives.

Constant Variables

Size of Parameter
Positions of Point
Relative distance between Points
People

Outcomes:

Number of lines
Area within Boundary
Number of connections between me and specific person
Number of connections between people

INITIAL Visual Sketch

For each corresponding emotion or word between any two people, a line will be drawn to connect the respective points. The red line represents a connection between two isolated people while the black line represents a connection between a specific person and myself.