Tag Archives: obama

Virtual Politics: It’s not goodbye

The semester has passed by so quickly and what started of as an ambitious idea while I was brushing my teeth (it’s true!) has materialised into a WordPress.com site, with three amateur visualisations that I am nevertheless extremely proud of.

As my site grew bit by bit, I feel that I have grown with it, both in terms of skills and critical analysis of the data I was handling. And so I pen some of my thoughts in this post.

Ideas and goals

My initial idea for the project, Virtual Thumbprints, was intended to turn my own Facebook data into an abstract collage of network diagrams. I got really excited and started producing some visualisations on Gephi.

Screen Shot 2014-10-06 at 1.38.27 AM

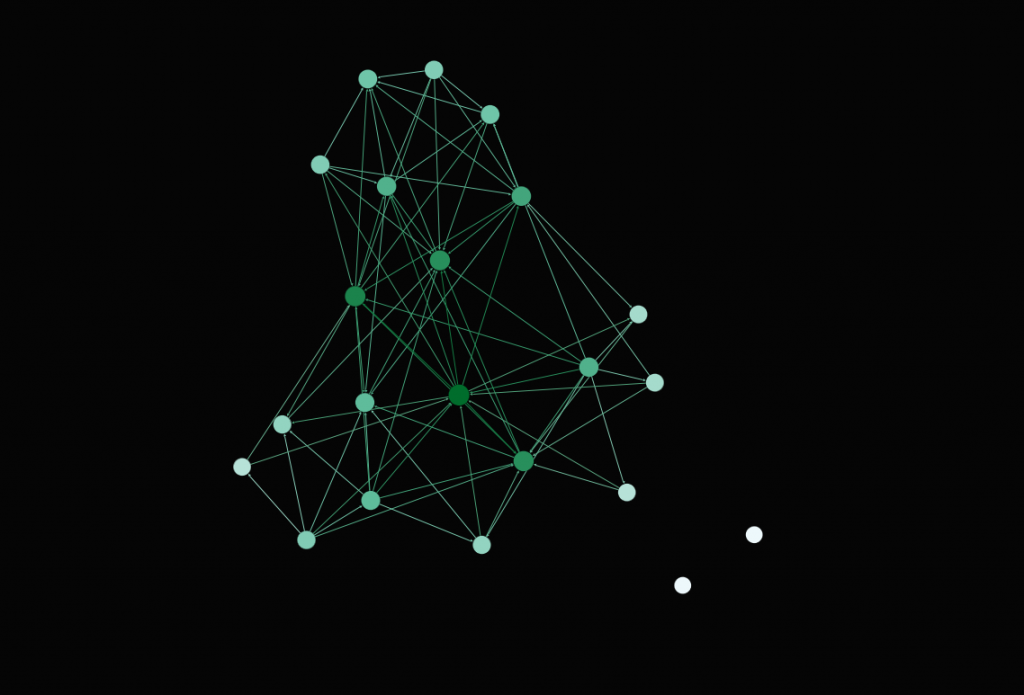
Network graph of friendships in the OSS NTU Facebook group

While comments from the class were positive, it just felt like there was something lacking in the idea. First, it felt too safe. I have taken a Network Perspectives class and am quite familiar with Gephi, so producing the visualisations would have just taken about 10 minutes each.  Second, it didn’t seem like something that had external validity, meaning that it could be generalised to a greater context, and would be thought-provoking for people all over the world.

So I started thinking of other ideas, and coming across Manovich’s Phototrails proved to be the turning point. I read their project documentation and realised that they had developed a macro for ImageJ, a software I had never heard of before. Perfect!

Concept and technical realisation

I began envisioning what I could produced with ImageJ, and my long-held scepticism towards politicians’ Facebook pages somehow came in into the picture. As a Singaporean of Indian descent greatly influenced by American culture, it didn’t take me long to settle on studying PM Lee, PM Modi and President Obama, all of whom are active on Facebook.

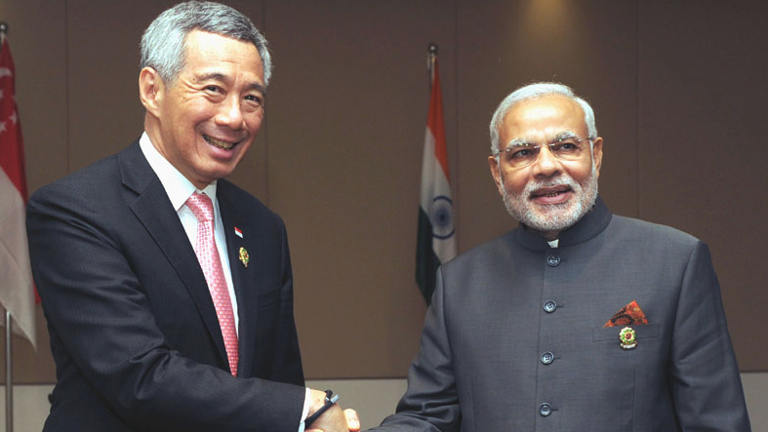
pm-lee-pm-modi

Two of the politicians I decided to study just met for the first time yesterday!

As I started collecting my data, with the help of Juan, I did some preliminary analysis of the information I had, producing all sorts of interesting graphs. It occurred to me that I didn’t have to be restricted to ImageJ, for Excel, while commonly associated with dull administrative work, provides scope for creativity as well.


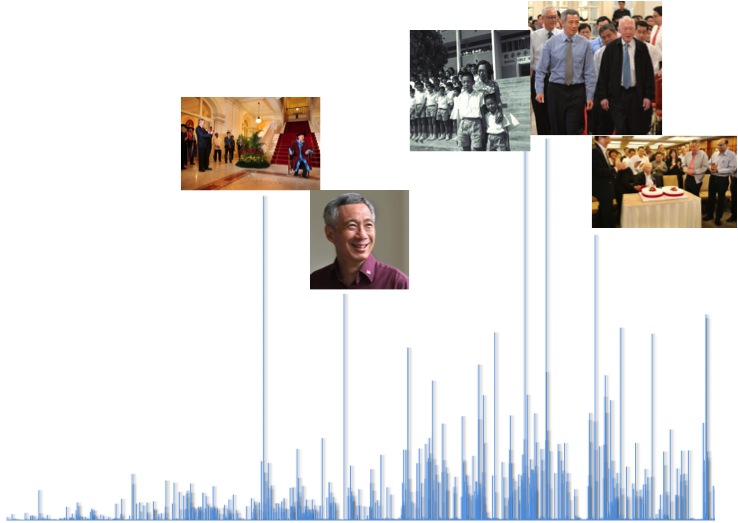
LHL top 5 graph

Graph of PM Lee’s Facebook likes per photo over time. The top three photos feature his father, former Prime Minister Lee Kuan Yew

While Excel is an excellent tool for critical analysis, feedback from the class also helped me realised that it is not dynamic enough, and also not best suited to the online medium. After all, net art is indeed about audience engagement and interactivity.

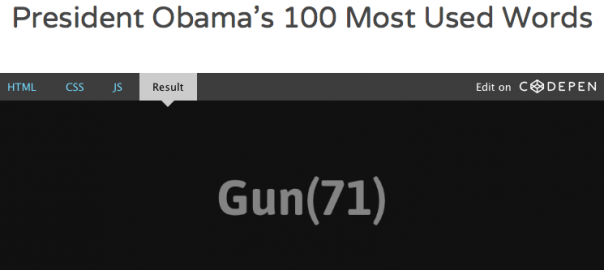
I was lost for a while and then remembered the open-source sharing platform Codepen we used in the Facebook network micro-project, where I can fork others’ pens to visualise my own data. So I produced a simple pen to replace my complicated word cloud. Not very impressive work, but I think it’s a great step for me because I was quite intimidated by code at first.

And along this process, my initial vision of using ImageJ has not faded away. I have been, and am still collecting data for ImageJ (I have  2700+ more jpeg files to download, rename and input the names into Excel), and hope to realise these visualisations soon.

Bridging my practice

Virtual Politics is based on the journalistic values of being faithful to information and presenting it with maximal accuracy. Settling on this principle was not an easy decision to make, but the process of consultations and documentation on this site helped me distill my thoughts on the issue.

At first, I wanted to break out of the mindset of a journalism student, but after some time, realised that what I truly wanted was to uphold transparency and accuracy. I wanted my work to stand up to scrutiny should someone important ever come across it, hence the more scientific approach to an art module. And I began to appreciate that art and science are not mutually exclusive, and that data visualisation on the Internet is a unique artistic approach to a traditionally scientific method of analysis.

Overall, I am really glad to have had the opportunity to immerse in data mining and visualisation, an invaluable skill to have in this information age. Surveillance through data visualisation is both fascinating and scary. As Manovich put it:

We seem to be back in the darkest years of Cold War, except that now we are being tracked with RFID chips, computer vision surveillance systems, data mining and other new technologies of the twenty first century.

-Manovich in What comes after remix? (2007)

I guess my message to Manovich would be that perhaps not all hope is lost. Because with open source software, the table can be turned, and the man-on-the-street may now have the ability to monitor the powers-that-be.
Project Concept: Virtual Politics

This year, social media changed the face of Indian politics. In an election like no other the country has seen, a politician of humble origins toppled an entire political dynasty. As CNN journalist Fareed Zakaria notes:

“Here’s Modi, the son of a tea seller, of really humble origins, extraordinarily disciplined politician, running against a political dynasty like no other in the world. I mean this was Rahul Gandhi… his father was prime minister, his grandmother was prime minister, his great-grandfather was prime minister.”

[Watch the full interview with Zakaria on the Last Week Tonight show here. It’s hilarious.]

With the results of the watershed election, political observers scrambled to pinpoint the causes of this major shift in voter attitudes. And one of the main reasons they uncovered was Modi’s social media strategy.

Modi3

Modi is the second-most Liked politician on Facebook, trumped only by US President Barack Obama. On Twitter, he has 7.16 million followers, earning him a Klout score of 89 out of 100, not too far behind Obama’s near-perfect 99.

While Obama’s social media influence could arguably stem from his role as leader of the world’s economic and cultural powerhouse, Modi was not endowed with any powerful position before he started engaging the public online. It then occurs to me that unlike Obama, Modi’s influence comes largely from the way he presents himself and communicates with voters online.

Modi’s success reminds me of Singapore’s own watershed elections in 2011, which was similarly dubbed a “social media election”. The Prime Minister, Lee Hsien Loong, created a Facebook account and as part of his campaign, even entered the Third Space via live Facebook chats with young Singaporeans.

Picture3

What intrigues me is the sheer popularity of these politicians on social media networks – What is it about the status updates and photographs they post online that make them so Likeable? What is the nature of the data they leave online? How is data shaping public perception of them? How does social media help them transcend the identity of a politician and reach out to the common man?

Data traces of virtual politics

In my research post on The Feltron Report, I noted that Felton was in essence publishing a collection of data that no one else in the world would have – the numbers he collected are unique to his existence, similar to a thumbprint.

While Felton largely collected data from his real life, it occurs to me that the data trails we leave on the Internet are also likely to be unique to each individual. Lev Manovich has also noted the existence of “social media traces”, which he tries to capture in his data visualisations. As he explained in an interview with Randall Packer:

“To me I think (data visualisation) is a successful metaphor for how to speak about society today, when you think about all the traces you leave on social networks. I am trying to find the static visual forms to represent our new sense of society from seemingly random acts of individual people.”

While Felton and Manovich were largely concerned with collecting individual data, their observations can be applied to the context of politicians’ social media presence. The “data thumbprints” their each leave on social media is likely to be different – Obama, Modi and Lee are likely to have very different data trails even though they’re all using the same medium for the same purpose.

Rather than doing a scientific comparative analysis, I’m inspired to “paint with data”, the same way Manovich and his team did for the project Phototrails.

Screen Shot 2014-10-15 at 1.48.08 AM

I hope to similarly visualise the Facebook data of Obama, Modi and Lee and uncover connections between specific parameters. While Manovich uses artistic parameters like hue and brightness, I hope to use more concrete parameters that might better answer my questions on this phenomenon of Virtual Politics.

The nitty-gritty

While Manovich collected 50,000 images for Phototrails, I don’t expect to be able to collect that much data, and so am setting a much lower target. I hope to collect 100 Facebook photographs (with accompanying captions) from Obama, Modi and Lee’s accounts and analyse them using the following data points:

1. Date and time

2. Location

3. Number of likes, shares, comments

4. Is the politician himself present in the picture?

5. Who took the photograph?

6. Number of people in the picture

7. Number of children in the picture (since politicians like to pose with kids)

8. Any significant individuals in the picture and how often they appear in the picture.

I hope to categorise all this information by hand (I foresee sleepless nights ahead) onto Excel and visualise it onto ImagePlot, a software developed by Manovich and his team, and available for free. I’ve tested this out for 30 of PM Lee’s photos thus far:

Picture5

I had to fill up everything manually. Wondering if there’s any application that can make my work easier…

And I got some not-at-all-aesthetically-appealing visualisations, though my aim is not really to impress, but to inform:

lhl likes graph

The x-axis is the number of shares and the y-axis is the number of likes for each photo

Screen Shot 2014-10-16 at 7.44.02 PM

The x-axis is time and the y-axis is the number of shares

Screen Shot 2014-10-16 at 8.02.32 PM

No specific parameters here, I just typed in values according to the function x^2+y^2= 1000 to obtain this arc (never thought that maths would come in useful in art!)

Using ImagePlot is new territory for me, but I hope to adapt along the way and hopefully come up with a set of visualisations that will provide some insights into the nature of the data trails that politicians leave on social media.