
My assigned location is:

Before my exploration of the hood, my initial idea was to talk about the aspects of life that are stolen from us by city life:
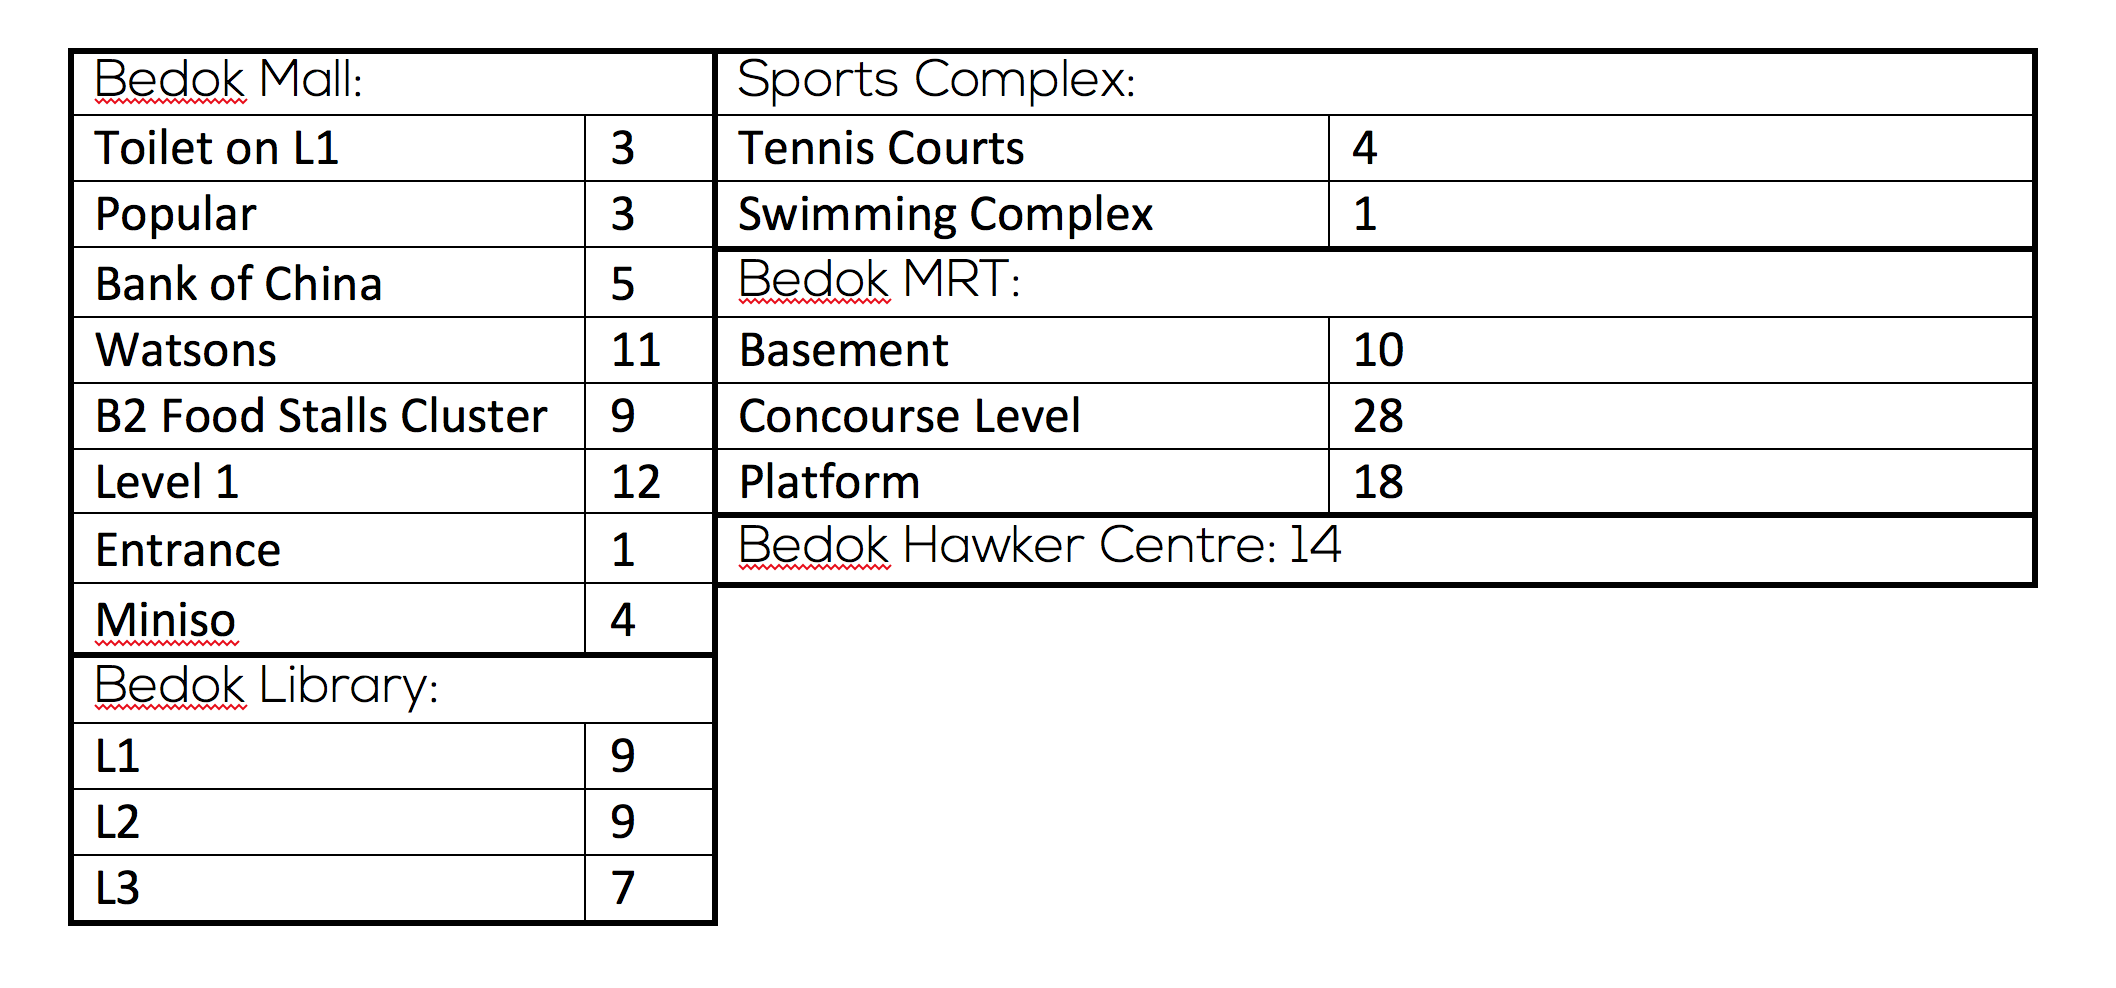
- Privacy: Number of surveillance camera around the area
- Time: Waiting time for traffic lights at Bedok
- Fresh air: Location of smoking areas in Bedok

I decided to explore Bedok with no background knowledge because only this way would I be more observant to the surroundings and have an unbiased first impression of Bedok.
Observations of Bedok:
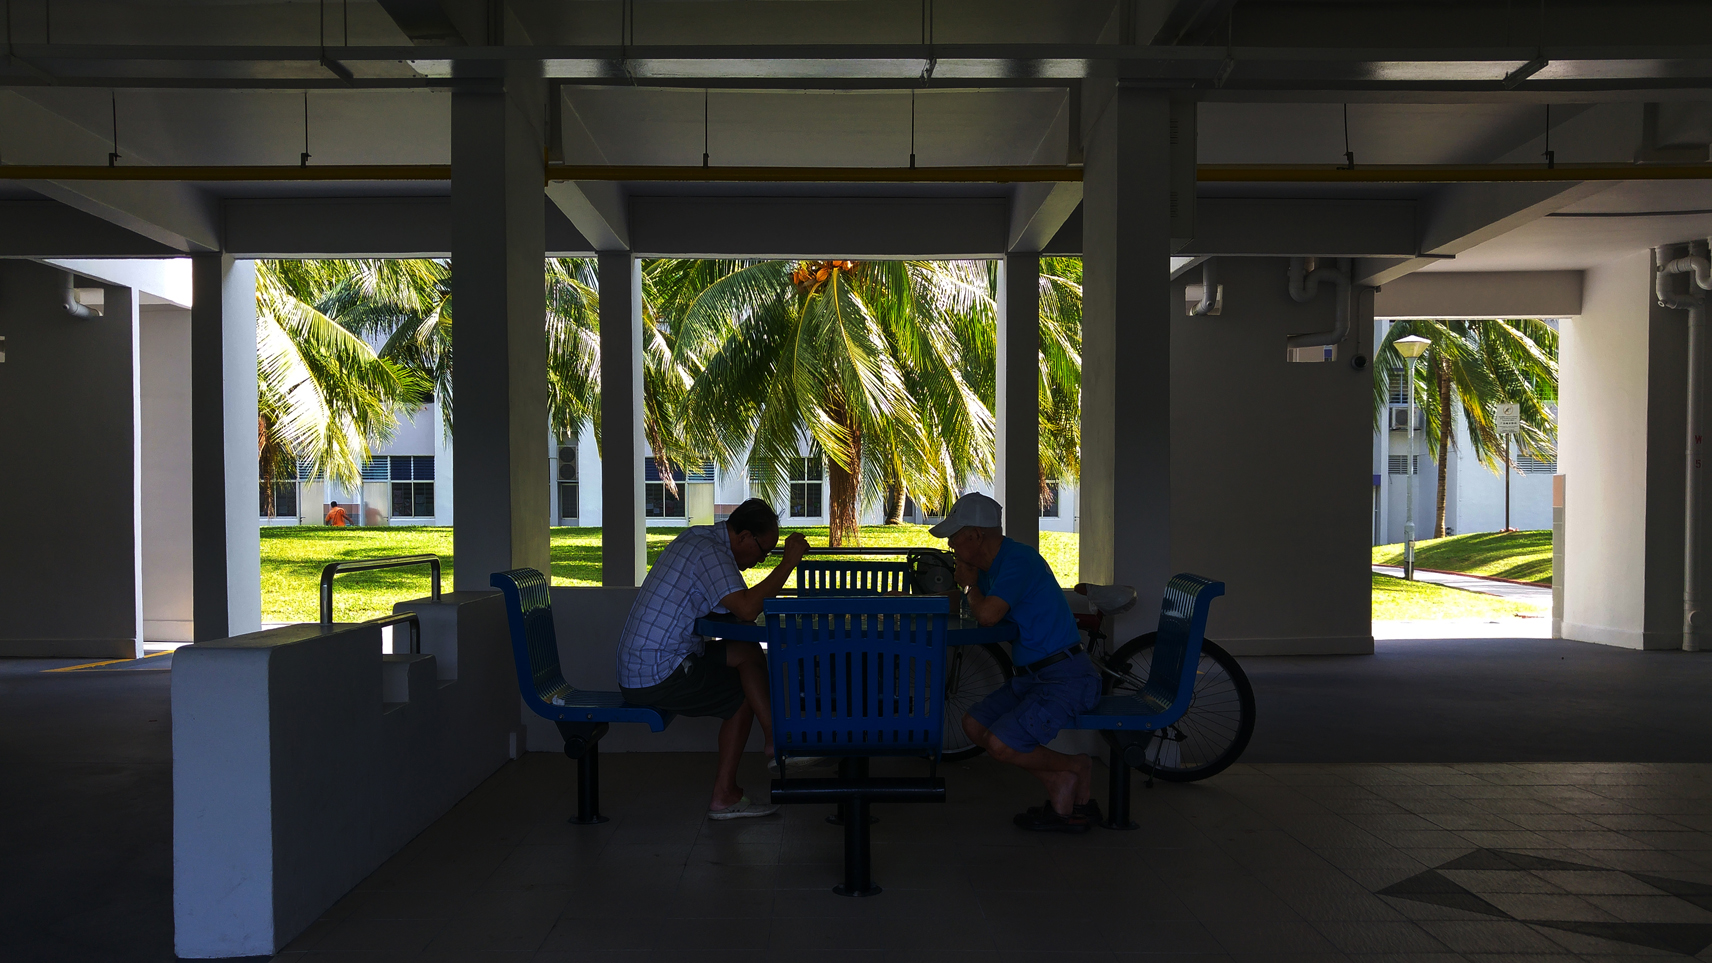
- Rather clean and structured estate
- Lots of geometrical visuals observed around the estate
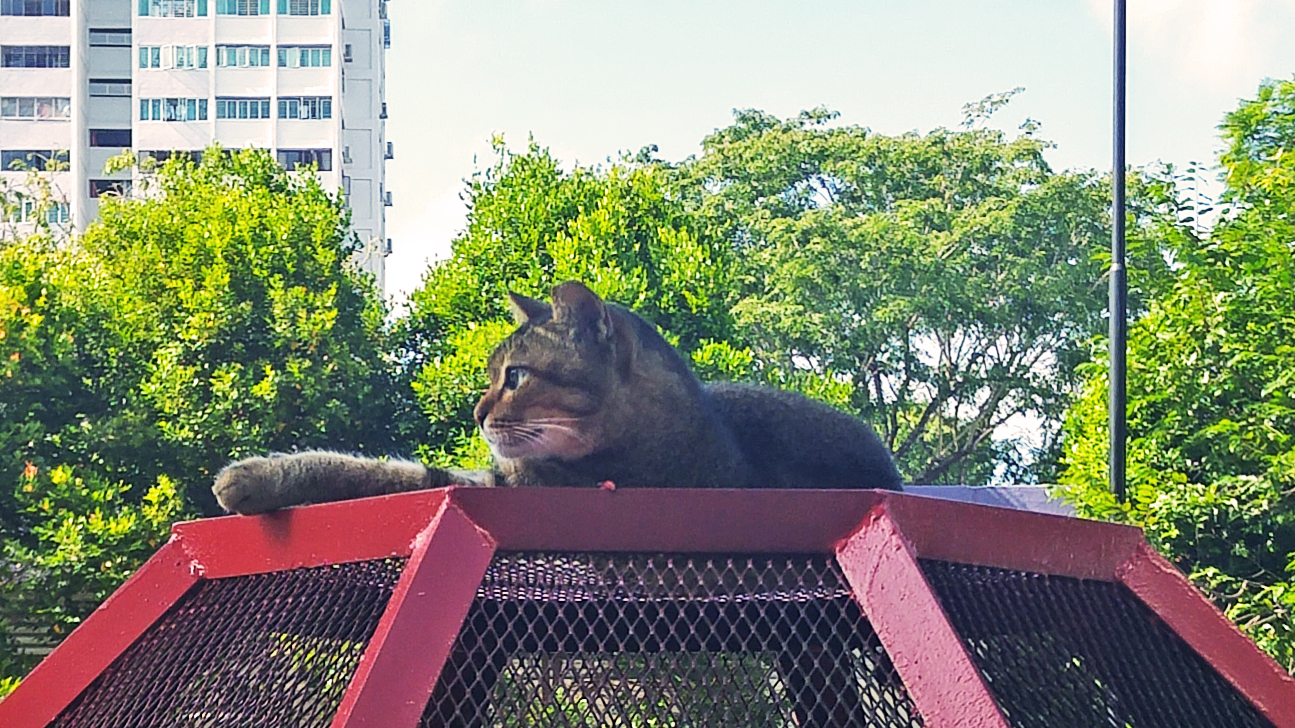
- Lots of cats!
- Mix of all ages: young, students, adults, seniors citizens
- Mix of housings: flats, condominiums and terraces
Big Brothers in Bedok:
Inspired by a project, I wanted to do the surveillance in Bedok. Largely because I thought the title ‘Big Brothers in Bedok’ would be really cool. However, this idea was not genuinely related to Bedok as I could easily pluck it and apply to another neighbourhood. Hence, I decided to tweak a little and consider the change in safety and security in Bedok after its history reveal it to be rapidly developing since the 1970s.

- Try to wrapped my data and idea towards what I’ve observed about Bedok and its known history:
Eg Bedok is a rather clean estate. Does its cleanliness have to do with its surveillance around it?
Eg Have Bedok’s safety increased with the increasing surveillance camera around the area? - Consider scaling down the area to make it more workable.
- Check out (big) news of Bedok
- Answer the questions on OSS:
- Your site/neighbourhood – some history/background/what is it known for?

- 1819: Known as Simpang Bedok Village
1966: Part of Bedok was reclaimed
1972: Bedok starts to developed
1975: (May) Vietnamese Refugee arriving at Bedok Jetty & Operation Thunderstorm
1976: HDB had built 4600 units of flats
1979: Bedok New Upper Changi Road Opened
1982: Bedok Stadium opened
1985: (28 Sept) Bedok Public Library opened
1986: Bedok Reservoir opened
1989: (4 Nov) Bedok MRT opened
2013: Bedok Mall opened
Housing 294 100 residents, Bedok has the largest number of residents
*http://eresources.nlb.gov.sg/infopedia/articles/SIP_214_2005-01-23.html
Food, food… and more food!: Bedok has two hawker centres that are just 5 minutes away and each filled with diverse cuisines to satisfy all your cravings at one place. Must-try eateries and cafes are also hidden among the residential blocks, making good food available at every corner you turn!
Sports: Being the home ground for Geylang International FC as well the Singapore Silat Federation, Bedok has definitely produced some of the finest local athletes. Built in 1982, Bedok Sports Complex is one of the few old standing single-storey sports complexes today. When I passed by the swimming complex on a lazy afternoon, I could see that Bedok swimming complex is still well-loved by both young and old.Additionally, Bedok reservoir has also provided an alternative sports arena for sports and nature lover.Suicide???: When I first asked around what’s interesting in Bedok, one common reply would be ‘suicides at Bedok reservoir’. That’s sad.
- 1819: Known as Simpang Bedok Village
- Your site/neighbourhood – some history/background/what is it known for?


- What is ethnography and participant-observation? What are some ways collecting data?
[Observation on 14 Feb trip]

- Rather clean and structured estate
- Lots of geometrical visuals observed around the estate
- Lots of cats!
- Mix of all ages: young, students, adults, seniors citizens
- Mix of housings: flats, condominiums and terraces[Collection of data on 17 Feb trip]On my first trip, I was pathetically scribbling my observations and data on a palm-sized post-it. While it was handy, my handwriting was scrumbly and data collected was disorganized.On my second trip, I printed an A3 map and marked out a 1km radius from Bedok MRT. I folded it into a handy size and now I’ve got google map in one hand that allows me to annotate with pencil conveniently.I’m intending to collect some residence response and may use hardcopy and online survey forms soon.
- What is qualitative and quantitative data? What is the difference between primary and secondary sources of data? How would you go about collecting the two?Based on my understanding, quantitative data refers to data that can be record with numerical values while qualitative data refers to more intangible results and requires analysis to make meaningful conclusions.Primary data: data directly obtained from direct source; more likely to be neutralSecondary data: data from other people’s studies; more like to be bias is sources are not accurateCollecting Primary data: I would have to go Bedok or conduct meaningful surveys
Collecting Secondary data: I need not go Bedok; I could search them online or in library
- What are infographics and how are they used to effectively communicate data? What other ways can we visually represent data?Infographics translates complex data into graphics and visuals to aid our understanding. We have to analyse our data collected and make meaningful relationships and conclusions before translating them into visuals. It is helpful in understanding complex data. Great learning sources for visual learners as well.As to other alternatives of representation, it largely depends on the data collected. If the data collected is simple and nothing too complicated, print-based design would be helpful as they are faster to digest than texts.However, if data collected are complicated, interactive designs would be more appropriate as it will hide unnecessary information at different phase of use and allow users to navigate at their own pace to understand to the data.
You must be logged in to post a comment.