Art References
Ferrofluids
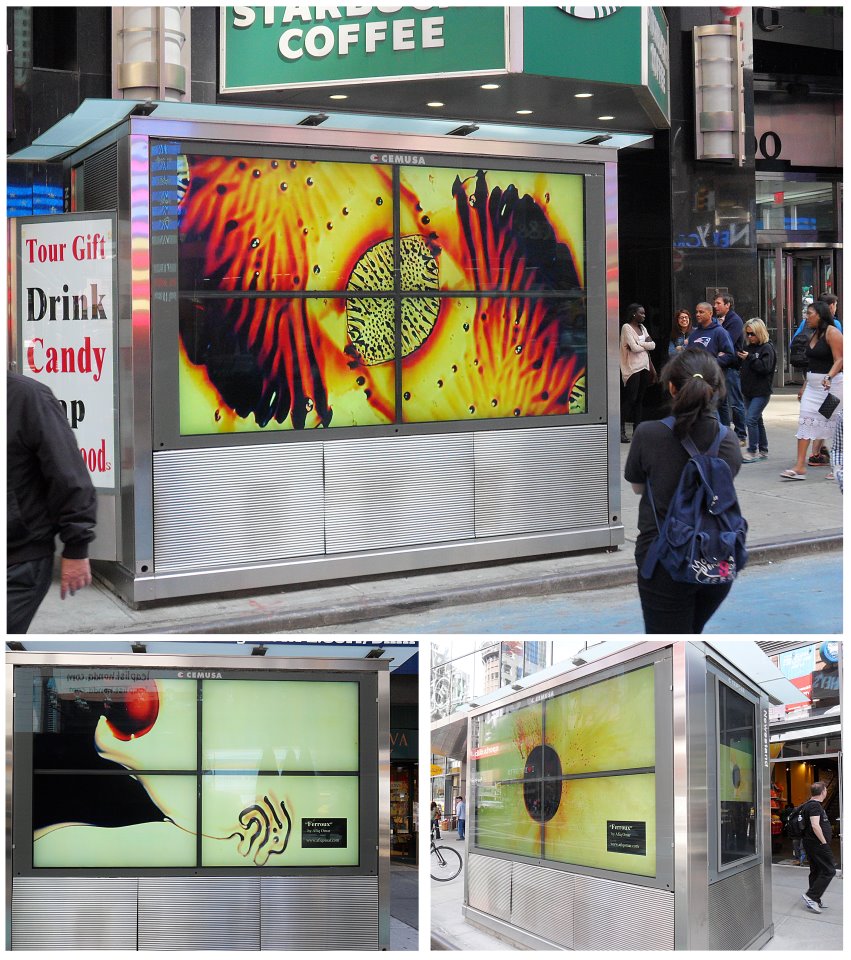
A ferrofluid (from the Latin ferrum, meaning iron) is a liquid which becomes strongly polarised in the presence of a magnetic field. 2012 Experimental film “Ferroux”, ADM 2nd Year student Afiq Omar, Class Pattern, Art, Design and Architecture (Conradi I A/P), Project Supernatural, Invisible Nature, used home made Macrophotograph tp dpcument ferrofluid influenced as it gets influenced by a magnet. The piece was picked by Vimeo and showcased by CEMUSA, Digital Video Network, Times Square New York City, leading international outdoor advertising company, display on 70 inch LCDs at eight newsstands at Times Square, New York. Estimate works were seen by up to 1.5 million viewers per day.
Datascape
“Today, a city “talks” to us in data. Many cities make available datasets and sponsor hackathons to encourage creation of useful apps using their data. Locals and tourists post messages and media which include their locations on Twitter, Instagram, and other social networks. How can we use these new information sources to represent the 21st century city?” The Data Street By Lew Manovich
Representing the Modern City
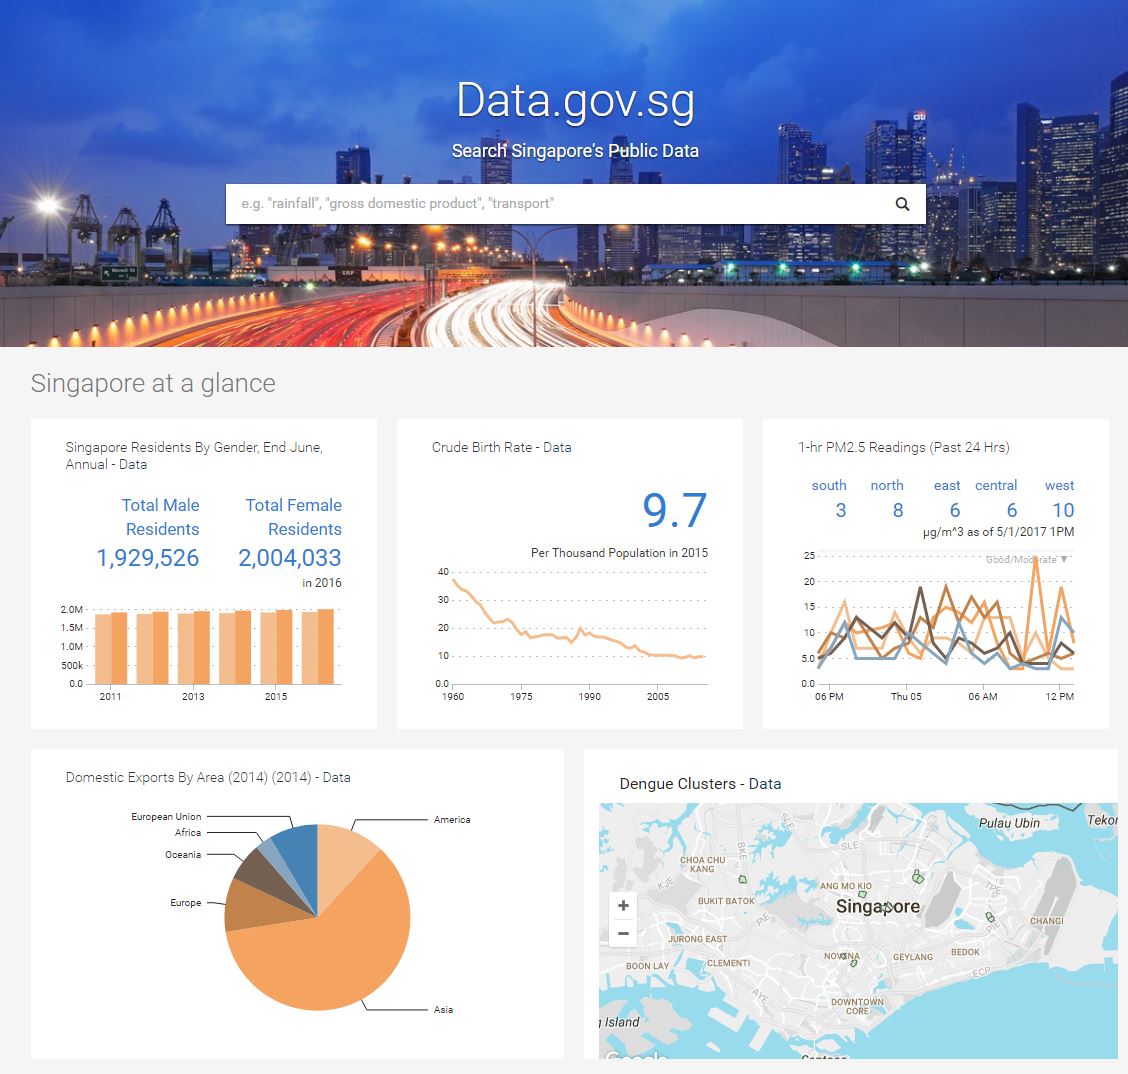
The ready available data sources that one could use to visualize into art works are sometime challenge to gather or find. Data sources for the project can be obtained from API provided by the Singapore Government and further edited and mapped to software such as TouchDesigner or Processing to generate visuals.
Wind of Boston: Digital Painting by Refik Anadol Studio, 2017
“Wind of Boston : Data Paintings is a site-specific work that turns the invisible patterns of wind in and around Boston into a series of poetic data paintings within a 6’ x 13’ digital canvas. By using a one-year data set collected from Boston Logan Airport, Refik Anadol Studios developed a series of custom software to read, analyze and visualize wind speed, direction, and gust patterns along with time and temperature at 20-second intervals throughout the year.
The resulting artwork is a series of four dynamic “chapters”, each using data as a material to create a unique visual interpretation of the interaction between the environment and the city. Each chapter brings different aspects of the data sets to life with distinct and varied painterly, emotive aesthetics, making visible the invisible beauty of wind as a natural phenomenon.
Each of the four chapters focuses on one distinct characteristic of the Wind of Boston. The first chapter, Hidden Landscapes highlights the anemometer’s most radical readings to create immaterial, spatial experiences. Porcelain Memories recalls the intangible power of a gale when reimagined outside of the traditional constraints of time. Sea Breeze explores the paradox of soft gentle wind blowing from the sea to the site in the harsh cold of winter. Gust in the City is a top-view visualization that explores the phenomenon of high speed winds in short bursts and the constant unseen poetic dance between the forces of nature and the built environment….”
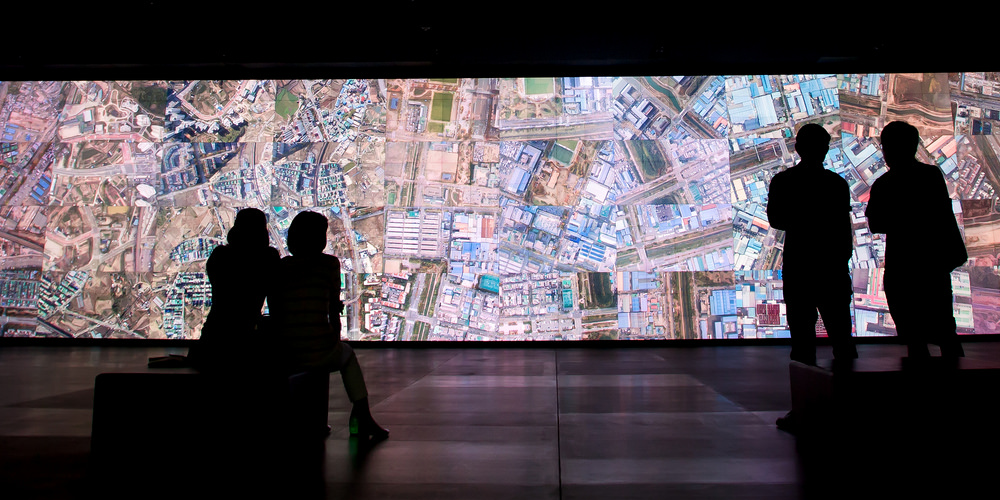
Vlirtual Depictions: San Francisco – Cinematic data-driven sculpture, Refik Anadol 2015,(LED)
Virtual Depictions: San Francisco is cinematic and site-specific data-driven sculpture consisting of 90 minutes long dynamic visuals projected in the building lobby’s 40-foot-tall screen and visible from the street. Created by Refik Anadol, The installation consists of a series of parametric data sculptures that tell the story of the city and people around it within a unique artistic approach to the building’s architecturally integrated media wall. For this social network sculpture (Twitter), the team built custom vvvv realtime system that traces down all the tweets which have been sent in San Francisco (geotagged) and maps them on a 3d pointcloud-representation of San Francisco.
The display includes 1,960 pixels high by 3,480 pixels wide including the side wall. The resolution of the lobby wall display consists of 6,820,800 pixels.The high-resolution LED screen features a 6 mm pixel pitch, meaning the center of each pixel is only .24″ inches from the center of an adjacent pixel. At 38’7″ high by 68’6″ wide, the installation consists of 2,643 square feet of digital canvas.
 Every Tweet emits particles and is contributing to a heatmap. This heatmap displaces and colors the 6 milliion particles to form the datascape.
Another benefit of this display system is the flexibility of inputs and compatibility with various content software products. This is particularly important for the 350 Mission video wall, as the installation will be used for various public art projects in the future.
On Broadway, 2015
The interactive installation ON BROADWAY represents life in the 21st century city through a compilation of images and data collected along the 13 miles of Broadway that span Manhattan.The result is a new type of city view, created from the activities of hundreds of thousands of people. Image and data include 660,000 Instagram photos shared along Broadway during six months in 2014, Twitter posts with images, Foursquare check-ins since 2009, Google Street View images, 22 million taxi pickups and drop-offs in 2013, and economic indicators from US Census Bureau (2013).

There are 13 such layers in the project, all aligned to locations along Broadway. As you move along the street, you see a selection of Instagram photos from each area, left, right, and top Google Street View images and extracted top colors from these image sources.
We also show average numbers of taxi pickups and drop-offs, Twitter posts with images, and average income for the parts of the city crossed by Broadway. To help with navigation, we added additional layers showing names of Manhattan neighborhoods crossed by Broadway, cross-streets and landmarks.
“Like a spine in a human body, Broadway runs through the middle of Manhattan Island curving along its way. We wanted to include a slightly wider area than the street itself so we can capture also the activities nearby. To define this area, we selected points at 30 meter intervals going through the center of Broadway, and made 100 meter wide slices centered on every point. The result is a spine-like shape that is 21,390 meters (13,5 miles) long and 100 meters wide. We used the coordinates of this shape to filter the data we obtained for all of NYC, as described below.
Instagram images and their data (locations, date and time, tags, and descriptions) were downloaded in Manovich’s lab in real time over 158 days in 2014. For Google Street View images, we were limited to the times Google photographed the Broadway. All other data sources are used to calculate averages per Broadway area, and therefore in some cases we used longer periods when such data was available.”
A project by Daniel Goddemeyer, Moritz Stefaner, Dominikus Baur, and Lev Manovich. For more on project please see link to Lew Manovich and Project web site.
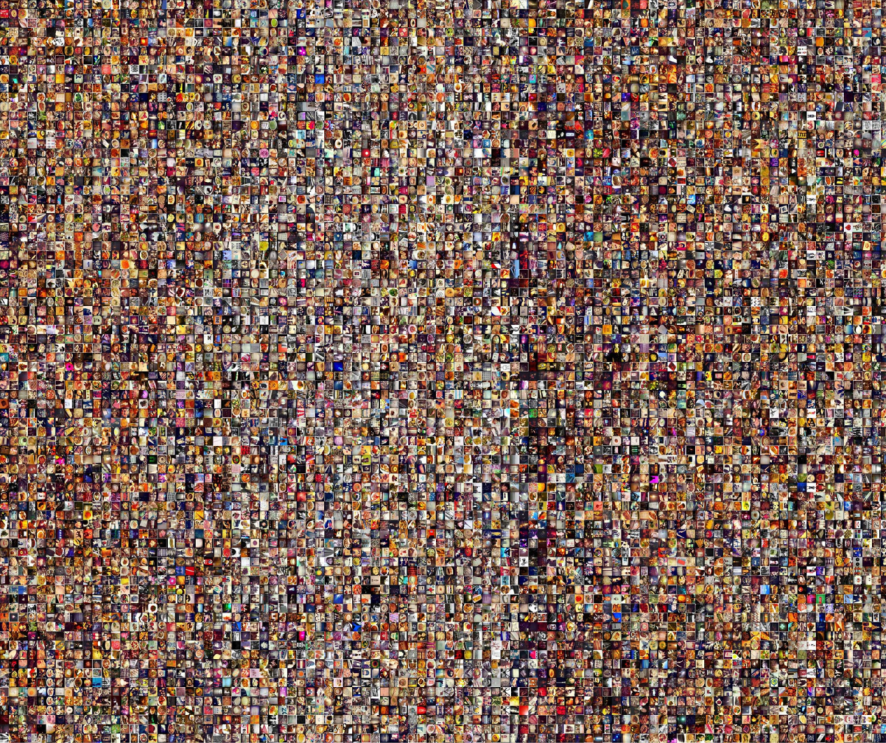
A View from Above: Exploratory Visualizations of MoMA Photography Collection by Lev Manovich
“Radial visualization of 18,941 photographs in the MoMA photography collection. Dates: 1837 – 2012. The distance of a image from the center is determined by its year of creation; the newer the photograph, the farther it is from the center. The degree of a photograph’s placement in the circle is determined by its average brightness (it increases counterclockwise from 90 degrees).” taken from Cultural Analytics Lab 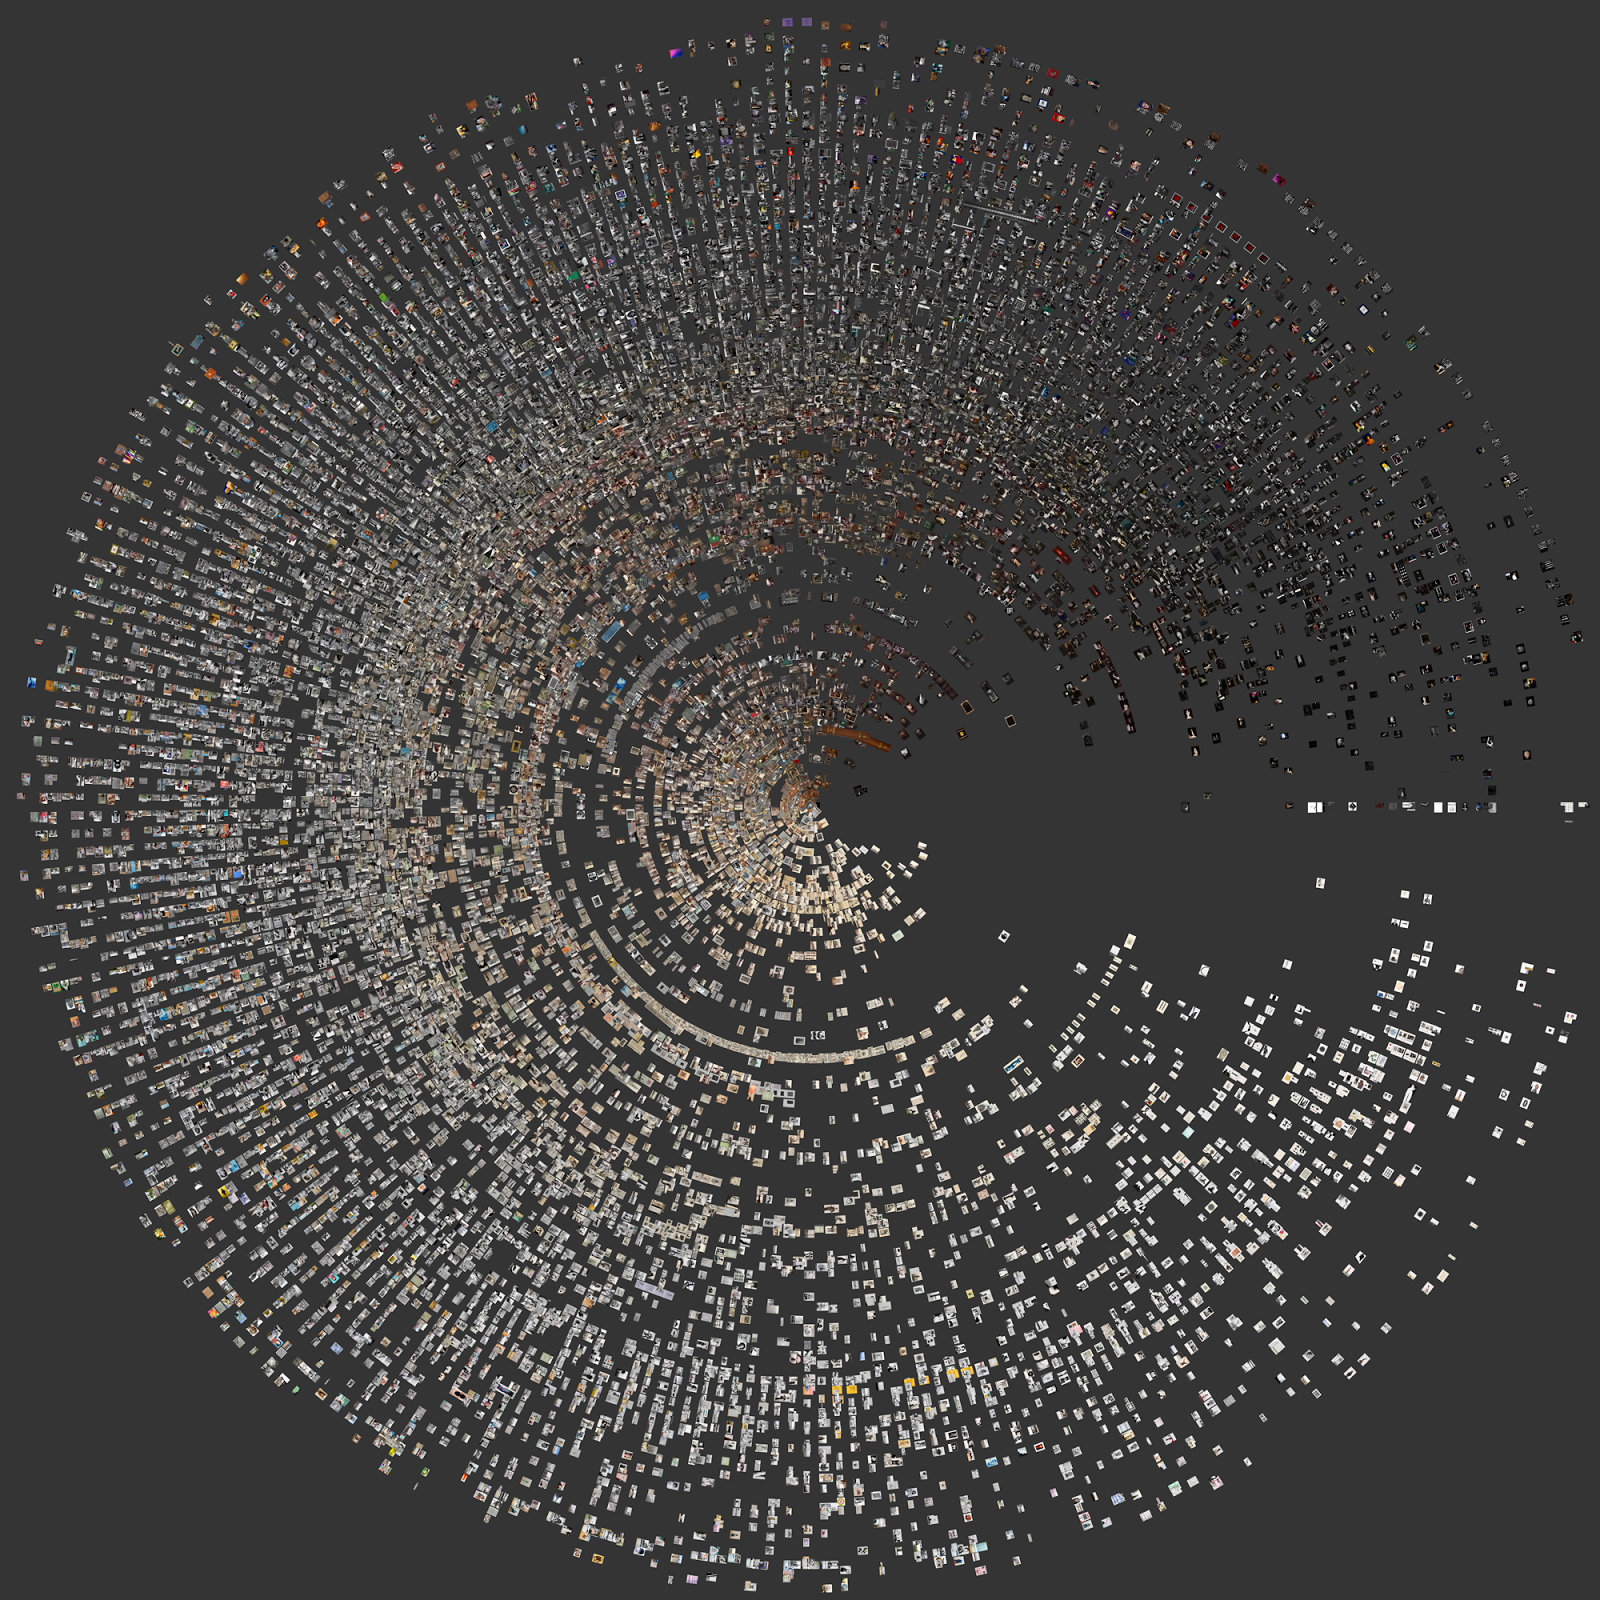
“….the characteristics of the digitized photographs, such as tonality, contrast, color palette, texture, line orientation, and the presence and position of faces….”
Publication
Nadav Hochman and Lev Manovich. “A View from Above: Exploratory Visualizations of the Thomas Walther Collection,” in Mitra Abbaspour, Lee Ann Daffner, and Maria Morris Hambourg, eds. Object:Photo. Modern Photographs: The Thomas Walther Collection 1909–1949. New York: The Museum of Modern Art, 2014.
lev manovich: software culture.the common grammar of media
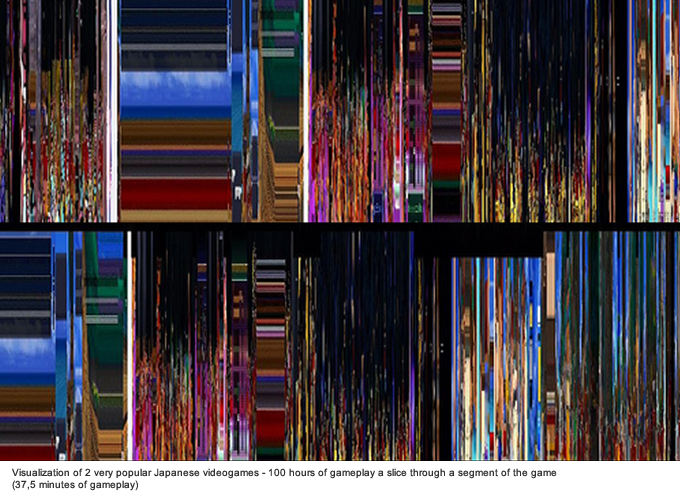
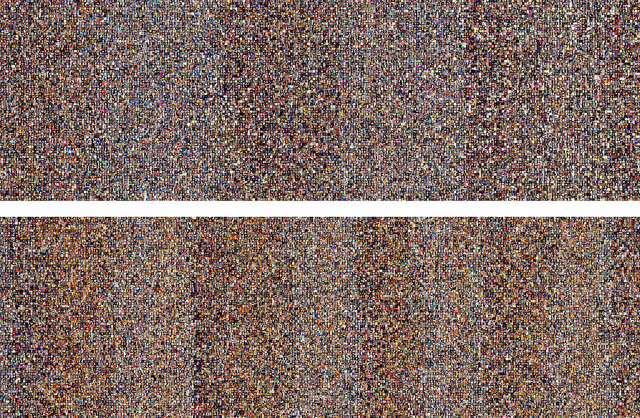 Visualizations comparing appr. 50,000 Intagram photos uploaded in NYC over a few days in Spring 2012 (top) with the the same number of Instagram photos uploaded in Tokyo (bottom) during the same period. Photos are organized by upload time, left to right.
Flat City, by Sukjoon Jang (KR), 2015
Using a drone camera, FlatCity captures the modern cityscape enclosed in the flat computer screen, with zooming in and out and mouse-scrolling activities. The artwork simulates movements coming closer and drifting away captured in virtual reality.
Imaginary Forces – Bosch – Main Title, 2015
Ryoji Ikeda
Resources: http://www.creativeapplications.net/vvvv/virtual-depictions-san-francisco-cinematic-data-driven-sculpture/
https://segd.org/virtual-depictions-san-francisco
http://www.on-broadway.nyc/
Lev Manovich– link to Articles and Publications
Architecture media walls
While mind bending optical illusions are even as static visuals immersive enough- in this theme audience will become maker as well and will influence the works.
Motion-activated media reacts to passersby in Washington DC office building, 2016
Motion-activated media reacts to passersby in Washington DC office building. Realized as a single media canvas, the large-scale installation spans 80 feet wide by 13 feet high (24 by 4 meters) and can be seen through the oversized windows that look out onto the street. technology has been seamlessly integrated into architectural surfaces, creating an ever-changing artwork that captures the bustling pulse of the building.When in ‘season’ mode, the media displays the lifecycle of washington DC’s iconic cherry trees.
 ‘color play’ shows algorithmically-generated patterns of multi-color threads
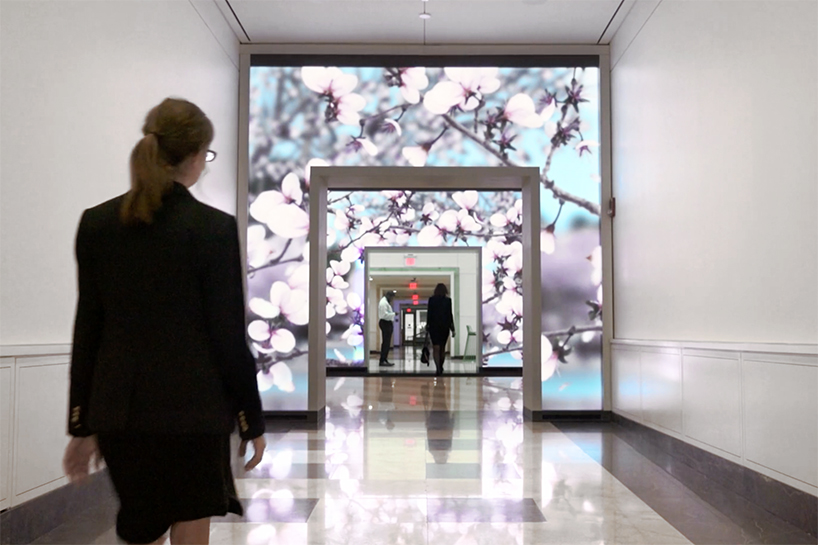 visitors’ movement causes the digital petals to fall off and float around the screen
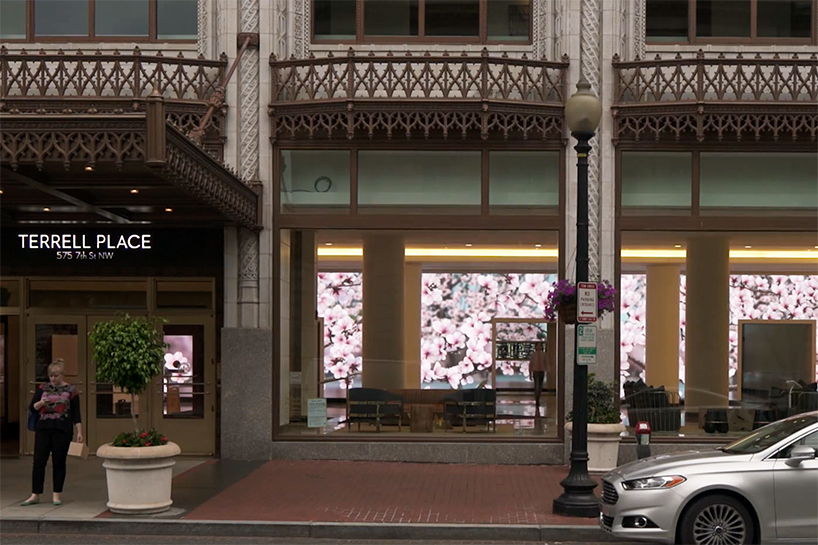
the large-scale installation can be seen through the oversized windows that look out onto the street.
Strings of Light Dance to Your Touch in This New Interactive Installation, 2016
Computer-generated strings of light wiggle and shake in response to your movements in strands, the new interactive light installation from ecco screen. The behavior and and physics of each string in installation is a reaction to the viewer’s presence, each line responding in its own unique way so the appearance of the project’s unbalanced bedsheet facade never repeats itself.strands was created using custom software the artist wrote in Processing. ecco screen used a blob-tracking device and an Xbox Kinect to pinpoint the user’s position in front of the piece. Thus, the viewer’s physical presence affects the strands in front of them. As viewers pace back and forth, they create what the artist describes as “an effect that resembles running your hand across a harp.”


INKS: Paintball Meets Pinball in a New Video game from State of Play
For their latest video game INKS, London-based State of Play Games have created a new spin on classic pinball by turning the background of a pinball game into a piece of interactive art.
Inspired by artists like Miro, Matisse, Jackson Pollock and Bridget Riley, each table becomes a unique work of art in its own right, sculpted by the player as they fire an ink covered ball around the canvas. The player is encouraged to share their final work of art on social media with the iOS share function. They can even print them out if they like – with the story of their perfect game literally drawn on the canvas in front of them, something to be proud of and share. Link resources
New Installation Creates Star Nurseries With Code and Geometric Light, 2014
Related:
Sympathetic Strings, David Mann 
Derivative Touch Designer
https://www.derivative.ca/Blog/