
9 March 2017
Riding on from my previous research, I emailed the respective organizations to get more information on Animal Shelters. However, I did not receive a reply from them. Therefore, I’ve chose to do a map on Pasir Ris Farmway with the various well-known shops. As Pasir Ris Farmway will be returned to the SLA (Singapore Land Authority) by end of Dec 2017 for other developments. Hence, I’ve decided to do a map to remember the current Pasir Ris Farmway.
For Part 1, we had to produce an Infographical work of our place of research. Infographics are graphic visual representations of information, data or knowledge intended to present information quickly and clearly. Infographics can be used for Map, History timeline, Recipe or Education purpose.
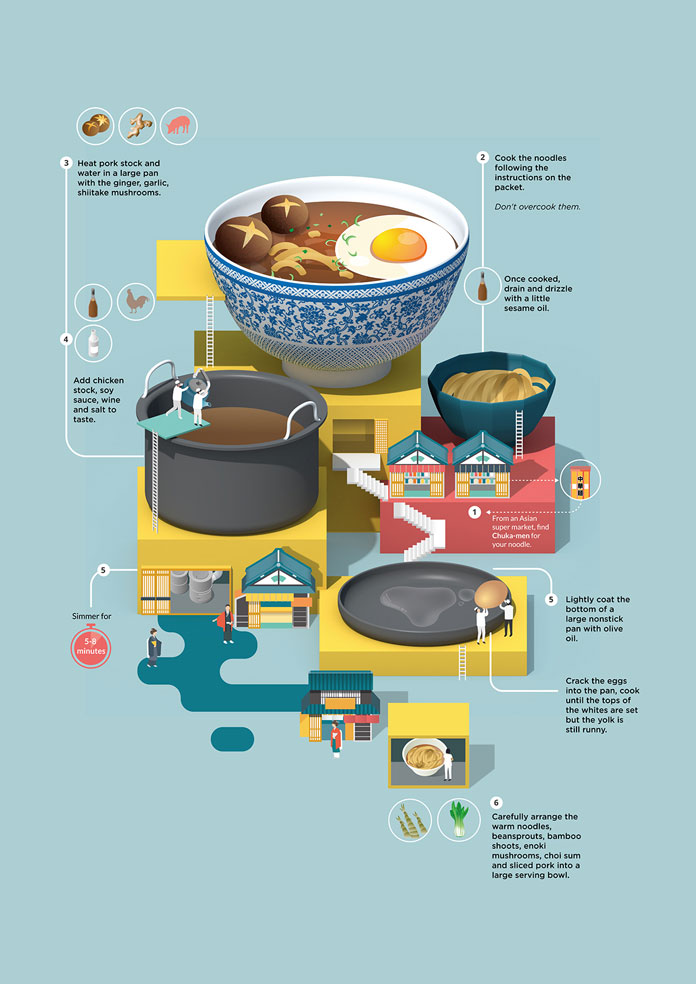
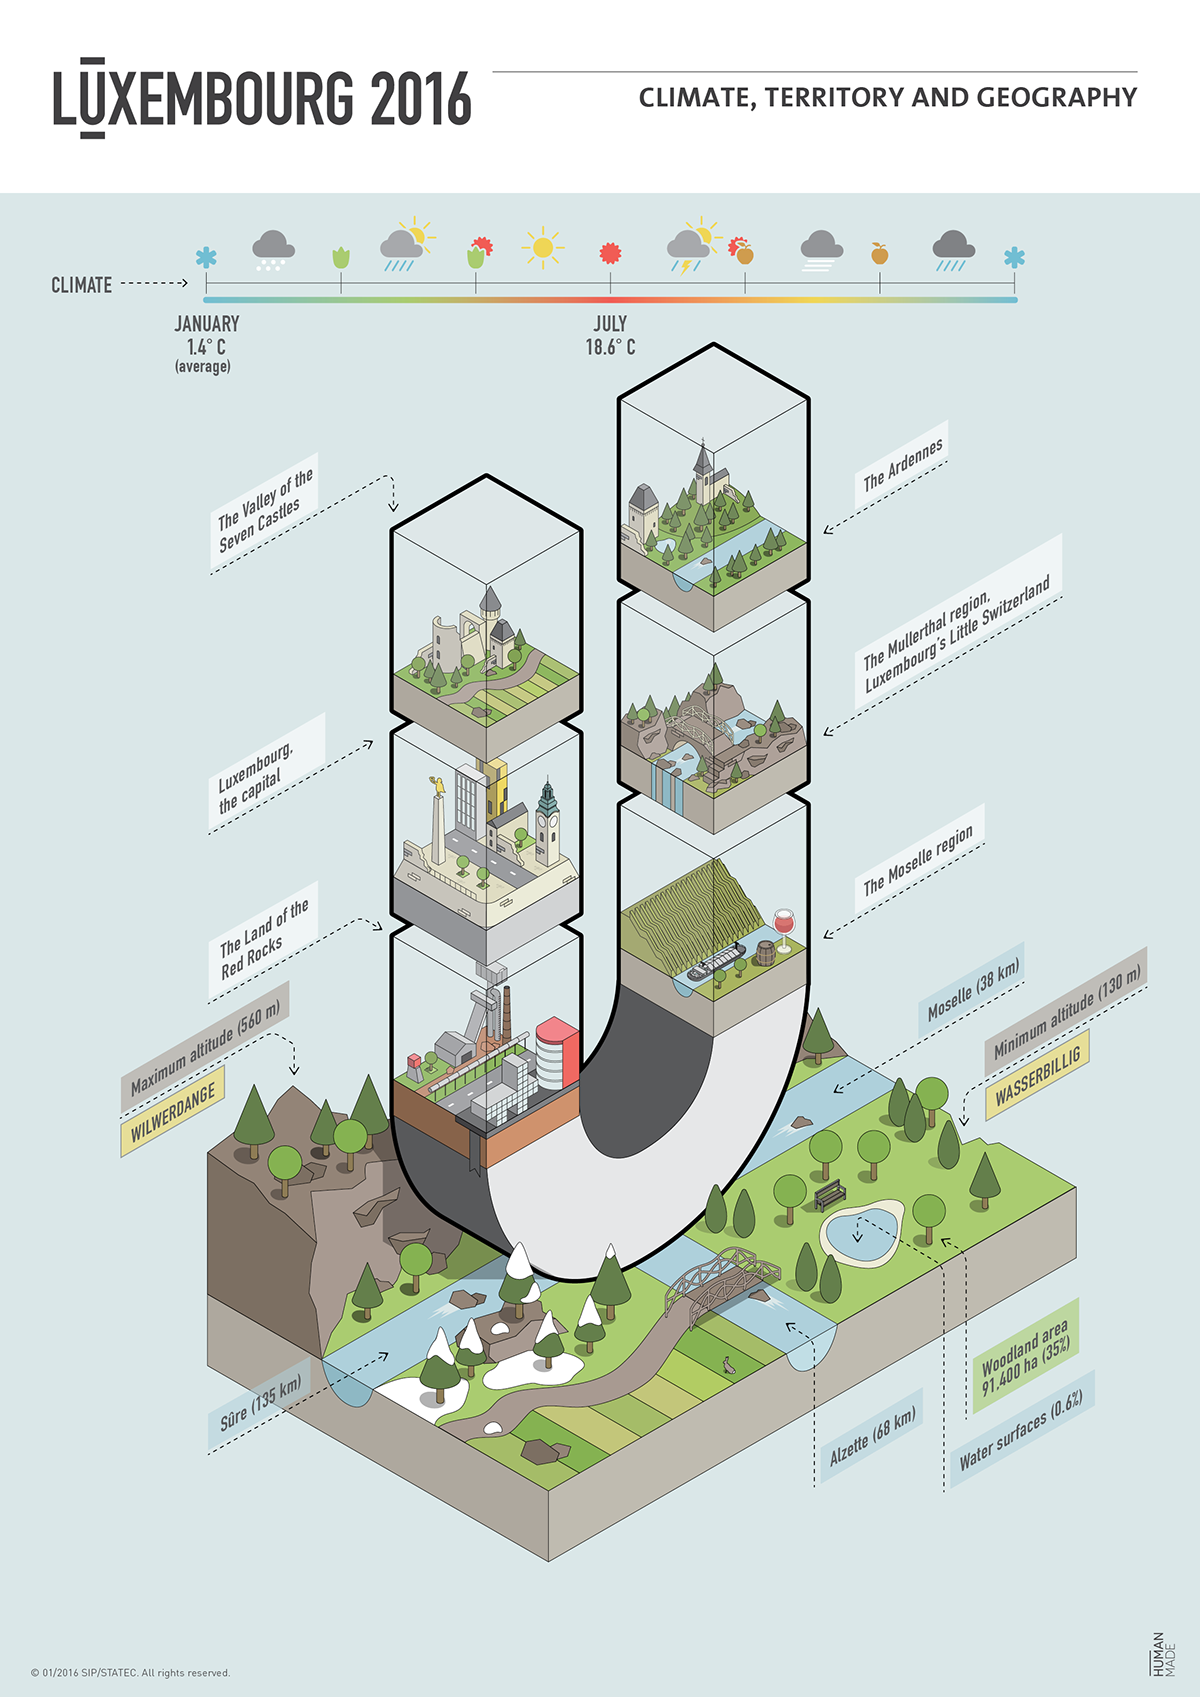
At first, I went online to search various artists’ infographics work. I adapted an overall look of a plain background with main visuals in the centre. As I felt that complexity if not handled well, will only cause the entire infographic to look too cluttered and not visually pleasing.
As I am coming up with the design of the map, I still felt the need to address on not abandoning of animals in my Infographic. Eventually, I did both and combined them together.
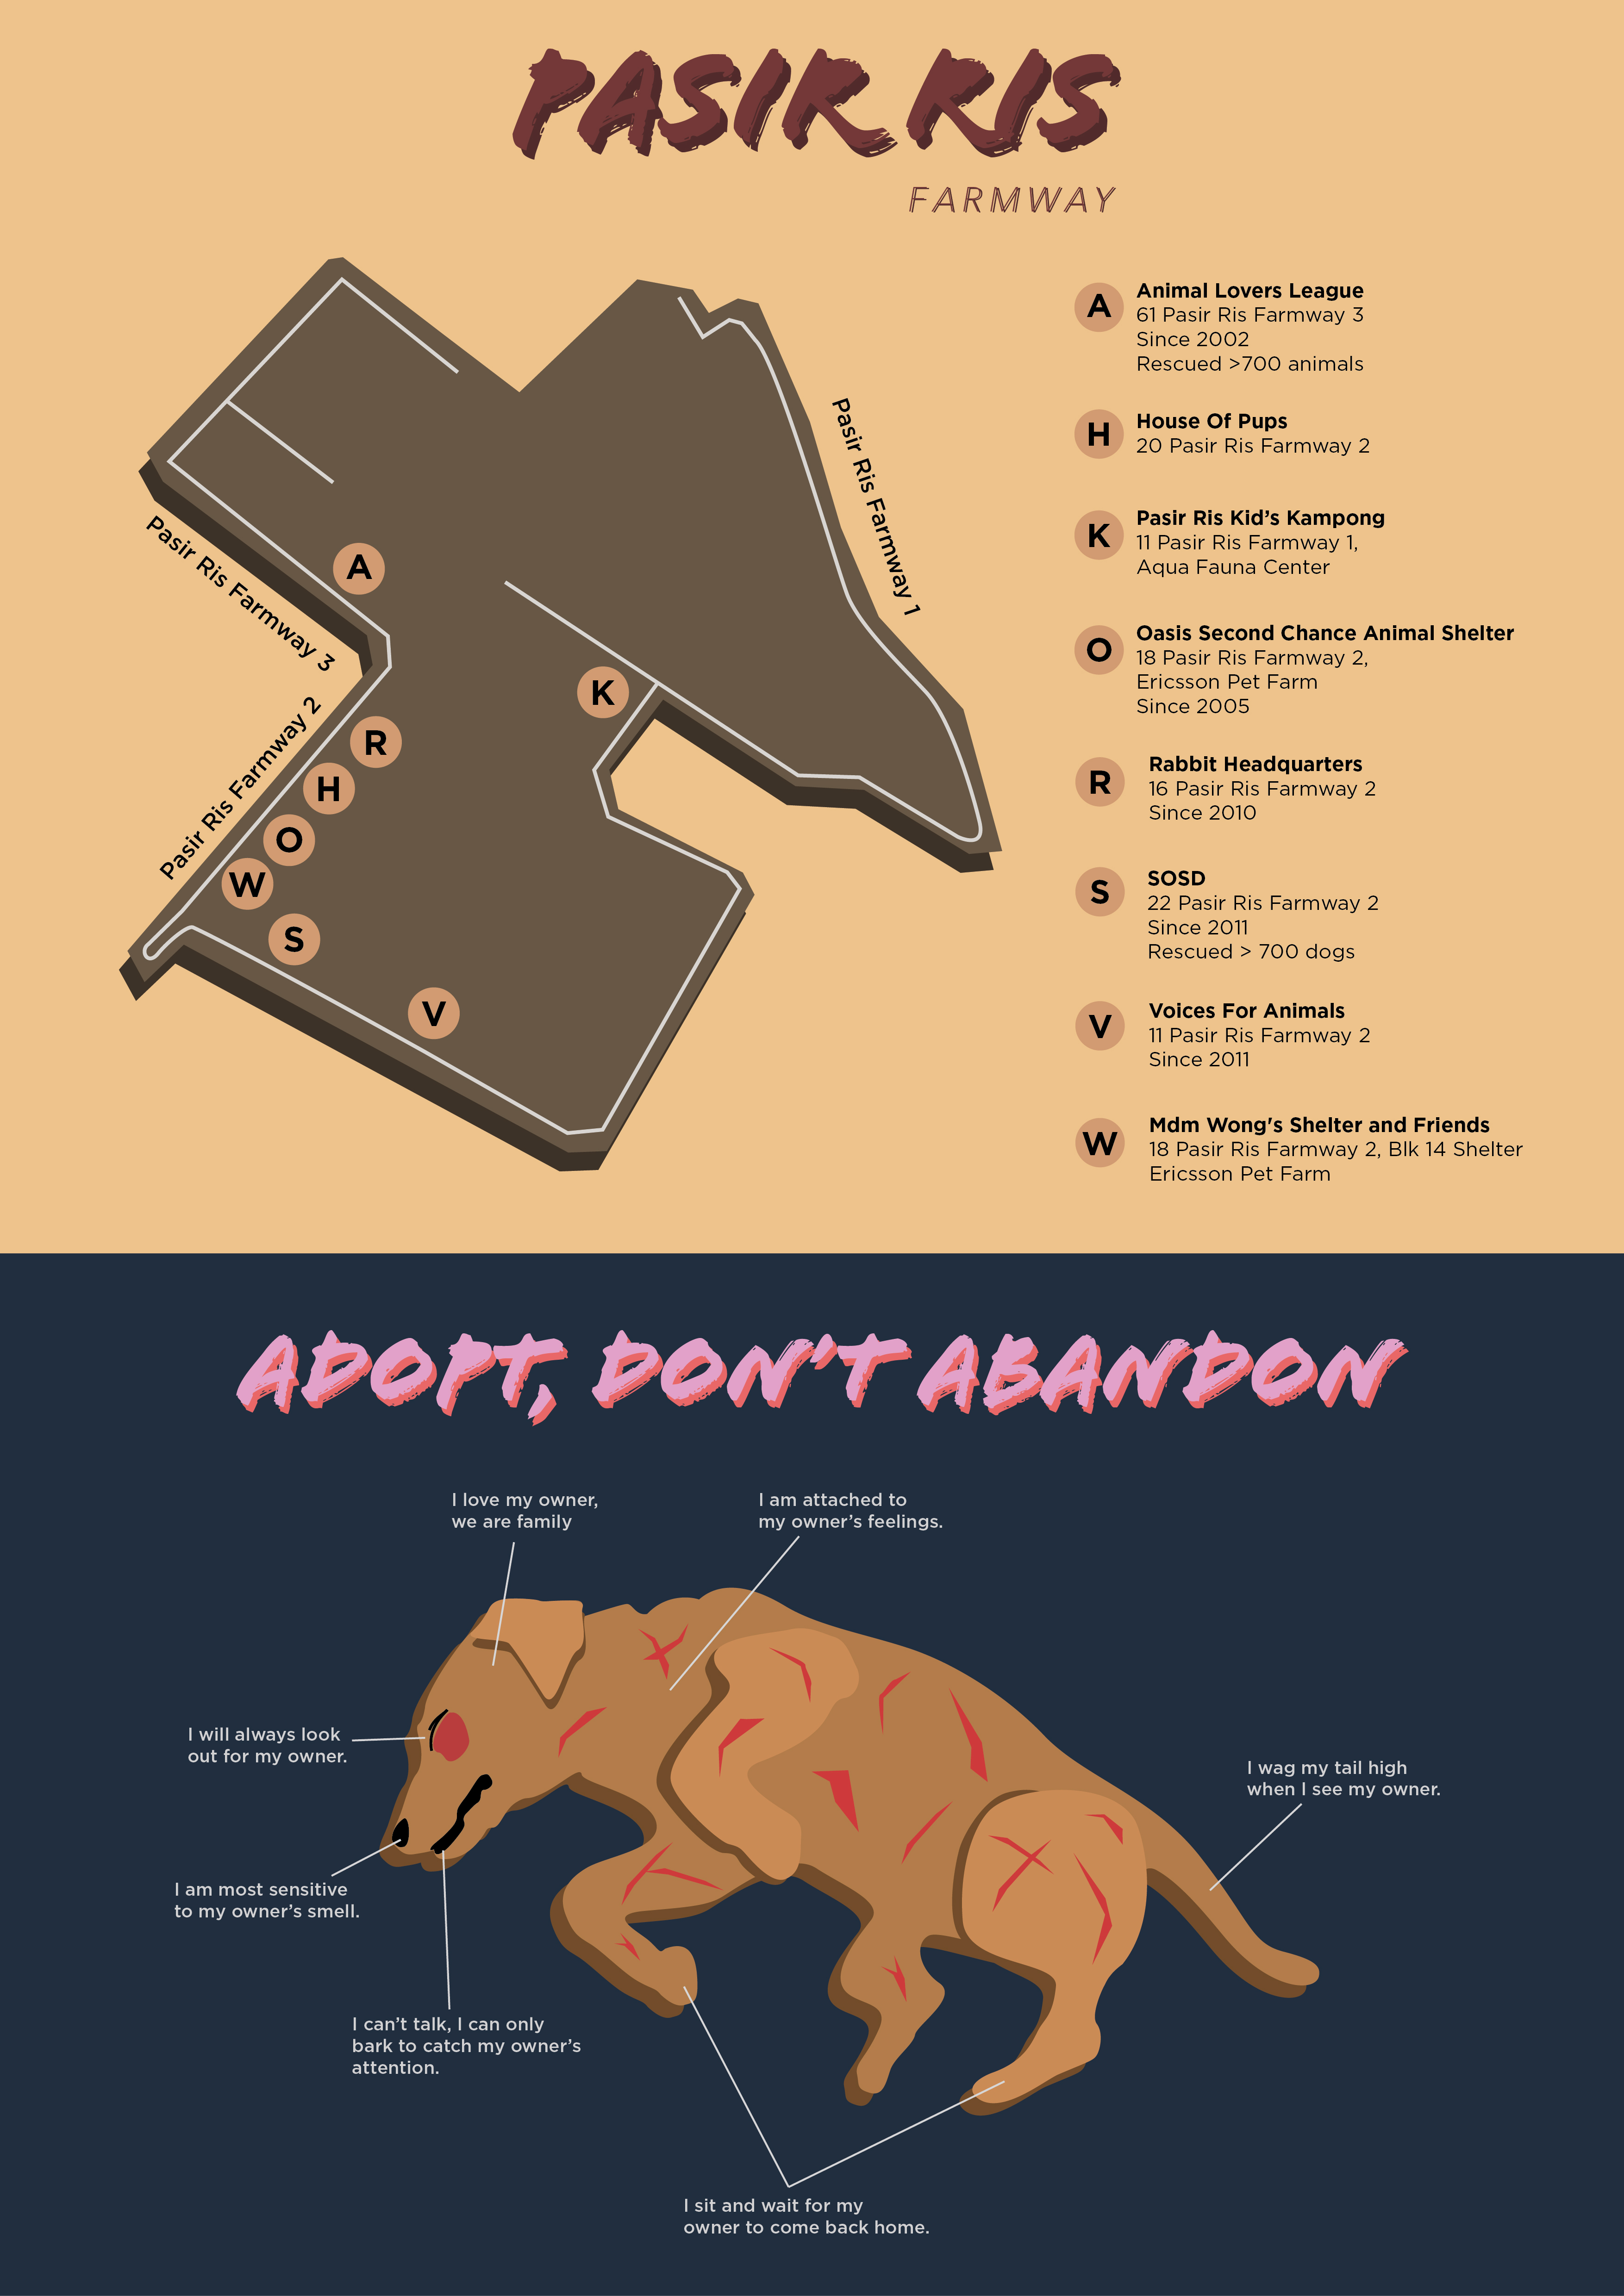
Ver. 1
On the day of presentation, I showed the above Infographics. I received feedback like the information was not enough, I should add in the transport route, etc. Gathering the feedback, I decided to do a second version.
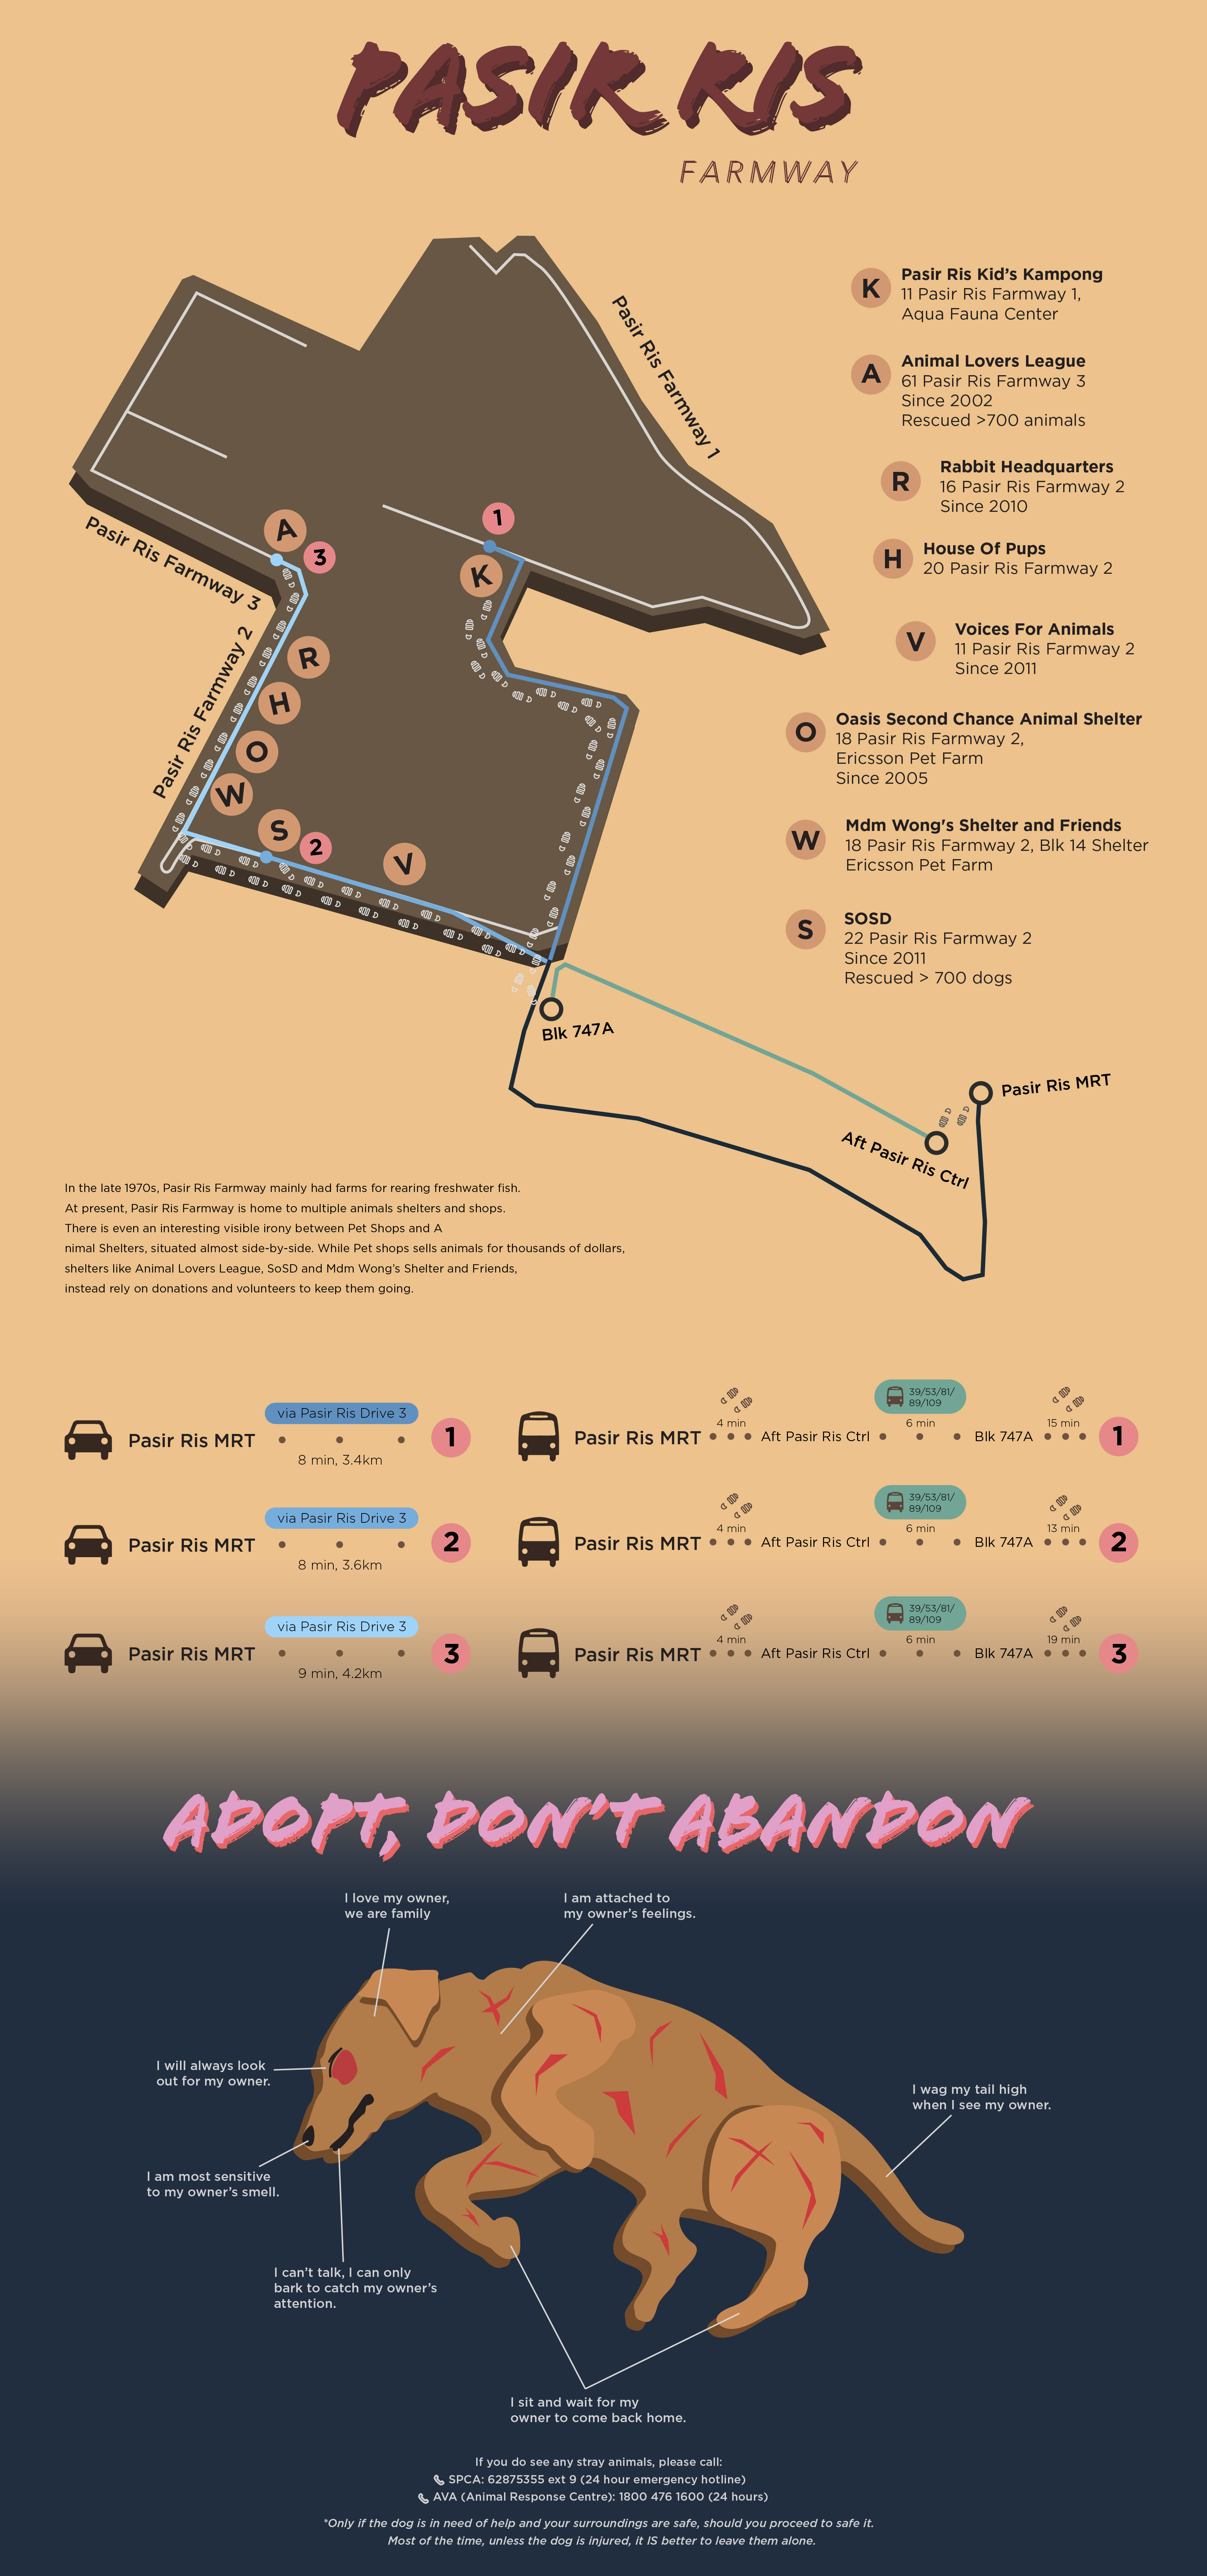
Ver. 2
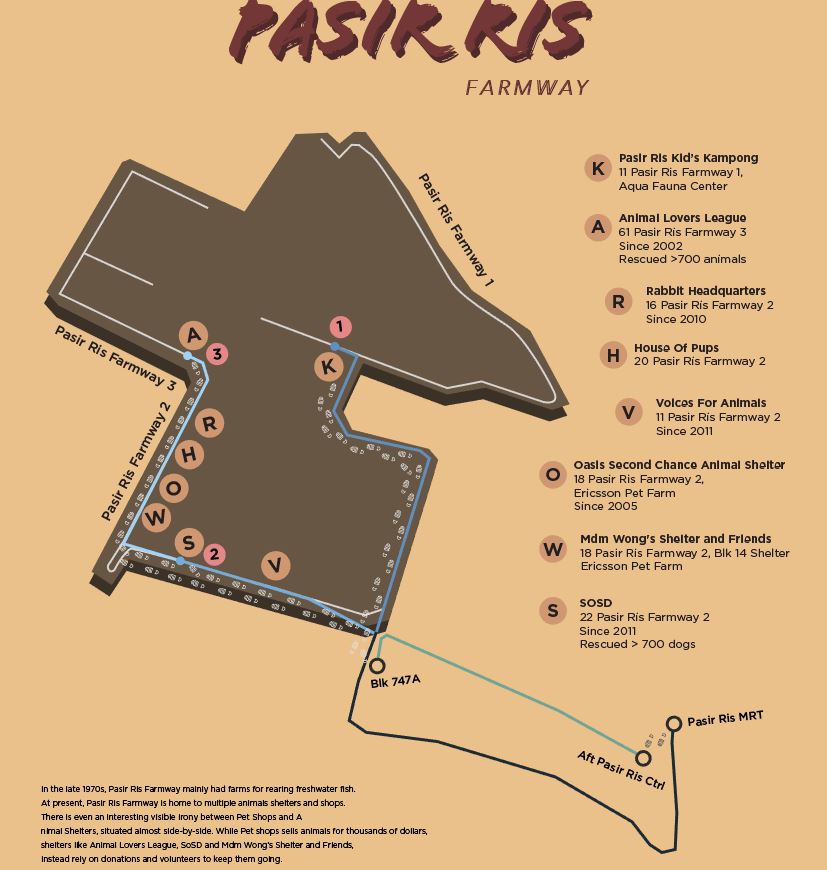
For the map, I added the transport route (for both bus and car), and differentiated them through green and blue respectively. I used these 2 colors as they are not too glaring but still can be seen, and it compliments well with the muddy background. I created 3 shades of blue driving route, to show that they lead to different paths. I indicated 1, 2 & 3 in the map to show the destination point. Hence, it’s easier for audience to see where the transport route ends at. I also added footprints to show the walking route. I shifted the legend to side of the map for easier reference.
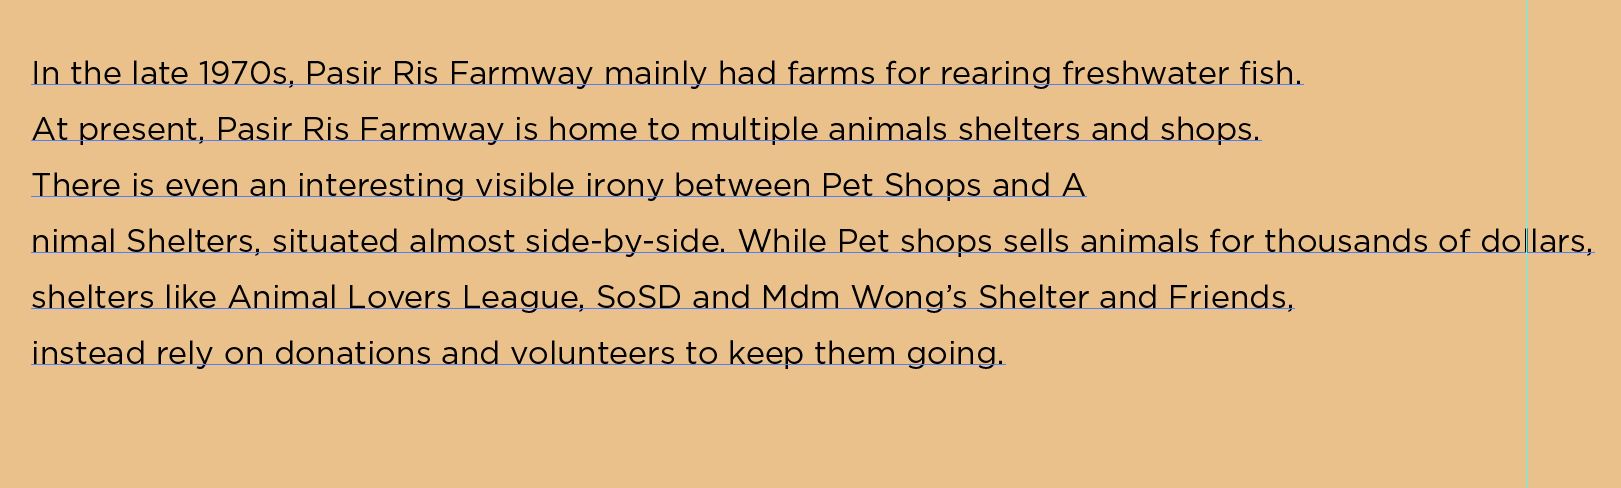
At bottom left hand side of the map, I also added a short brief of Pasir Ris Farmway, to tell the growth of the place.
![]()
For the driving routes, I used the respective route color to let audience know which route I’m referring to. I also added which route to take and amount of time, allowing the audience to know how long it will take, and adding it to their preparation time.
For the bus routes, I found a common bus stop, but different walking path after that, which will lead the audience to each farmway. However I did not combine them into one, as I’m afraid it will confuse the audience.
For the destination point, I only selected 3 common points, as each destination point can lead them to other shops. Therefore, I chose a shop from Pasir Ris Farmway 1-3, to represent each farmway. Having a common destination point, minimizes the route indications, making it less cluttered. It also reduces the confusion of the audience.
I chose a yellowish brown color for Pasir Ris Farmway, as it’s like a rural place, not having any urban features in it, very raw and untreated.
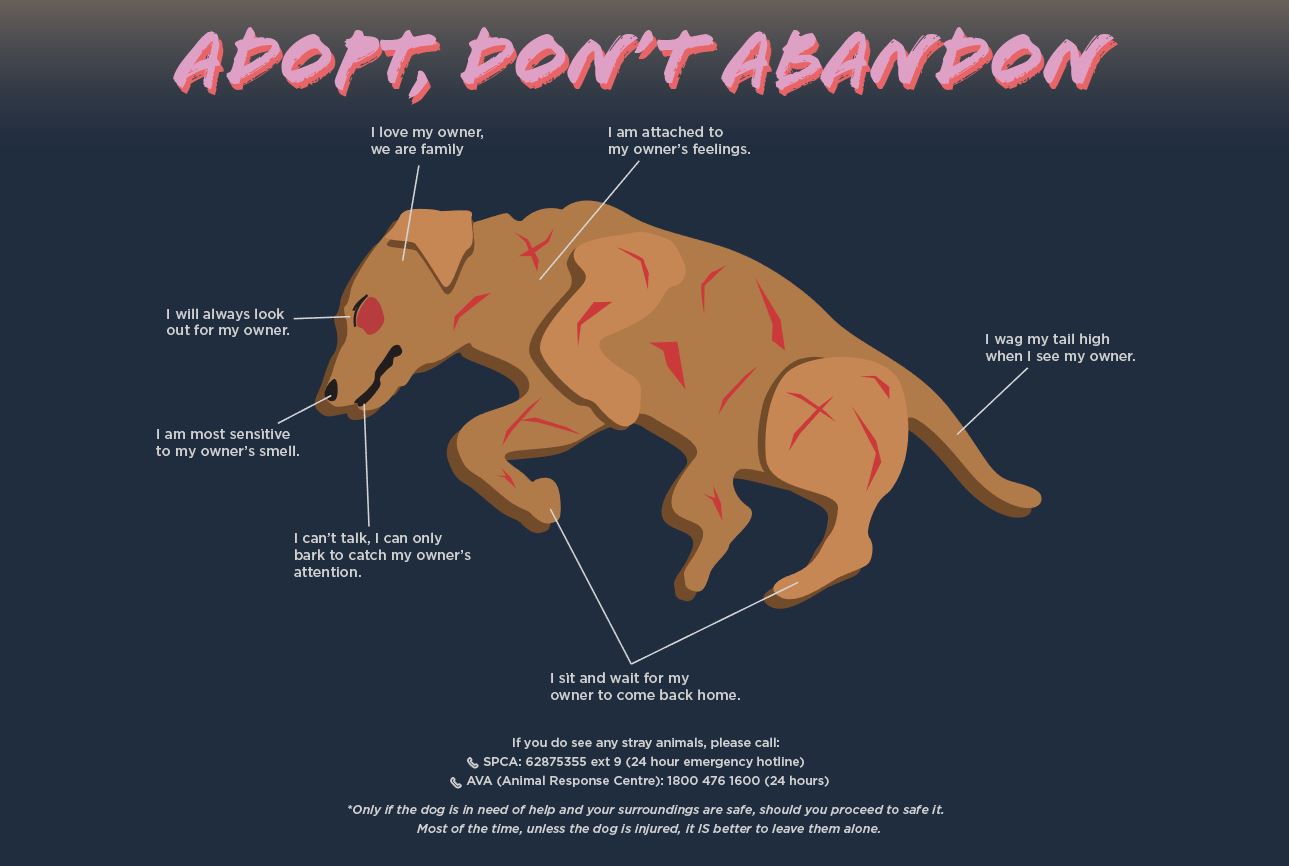
This was an additional section of the infographic. I wanted to bring across the message of choose adoption and don’t abandon animals/dogs. As Pasir Ris Farmway had lots of animal shops, therefore, I find that it’s a relevant topic to bring across.
I illustrated a harmed dog to show that if you abandon your dog, their feelings will be harmed too. Additionally, their dog when abandoned, may also face ruthless action by the public, and tortured. I made the dog look pitiful/bloody, to let viewers be more cautious of it. The dog’s feelings were also added to different parts of the dog’s body, to show a dog’s devotion.
For the color of the dog, I used a common stray dog in Singapore, which is the yellow dog (黄狗), as reference. For the header, I used pink and red (shadow), to represent love and compassion. For the background, I chose blue, which represents loyalty. I desaturated it slightly, to show the depression of the dog, despite it being loyal their owner.
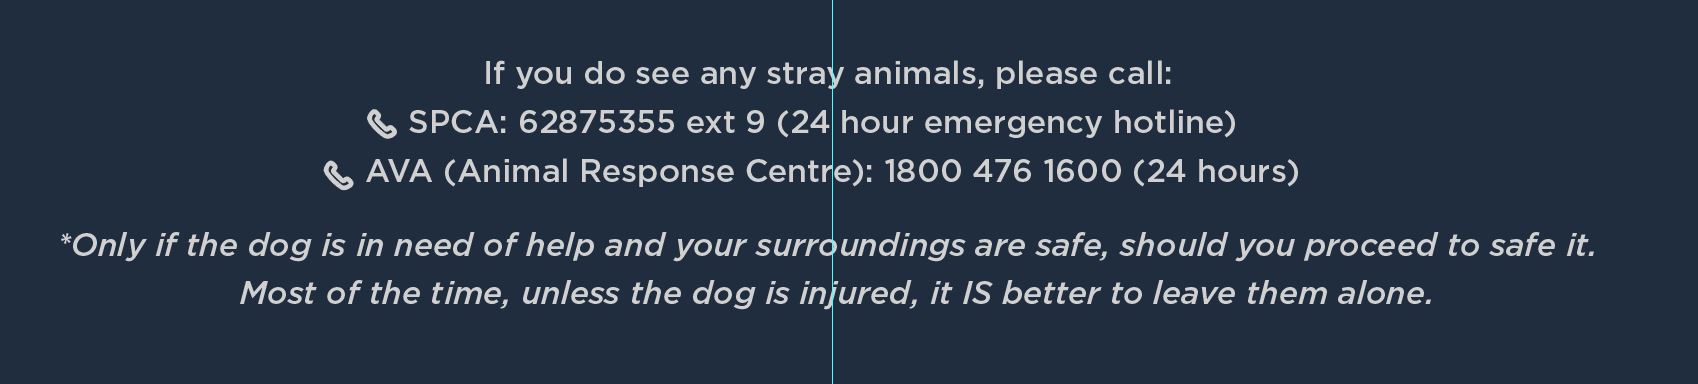
At the bottom, I also added a hotline information for viewers to know who to call when they see a stray dog. I also added a side note to warn people not to approach stray dogs if they are unhurt. It’s for your own safety as well.
Overall, it was a good experience learning and trying out infographics. I had a tough time gathering information, knowing what to put as priority, arranging in a visually pleasing manner and not making the entire composition look too plain. Nonetheless, I’ve managed to pull through and will be focusing more on Part II.
Till next post! Ciao!