 (Fern Fronds Postcard)
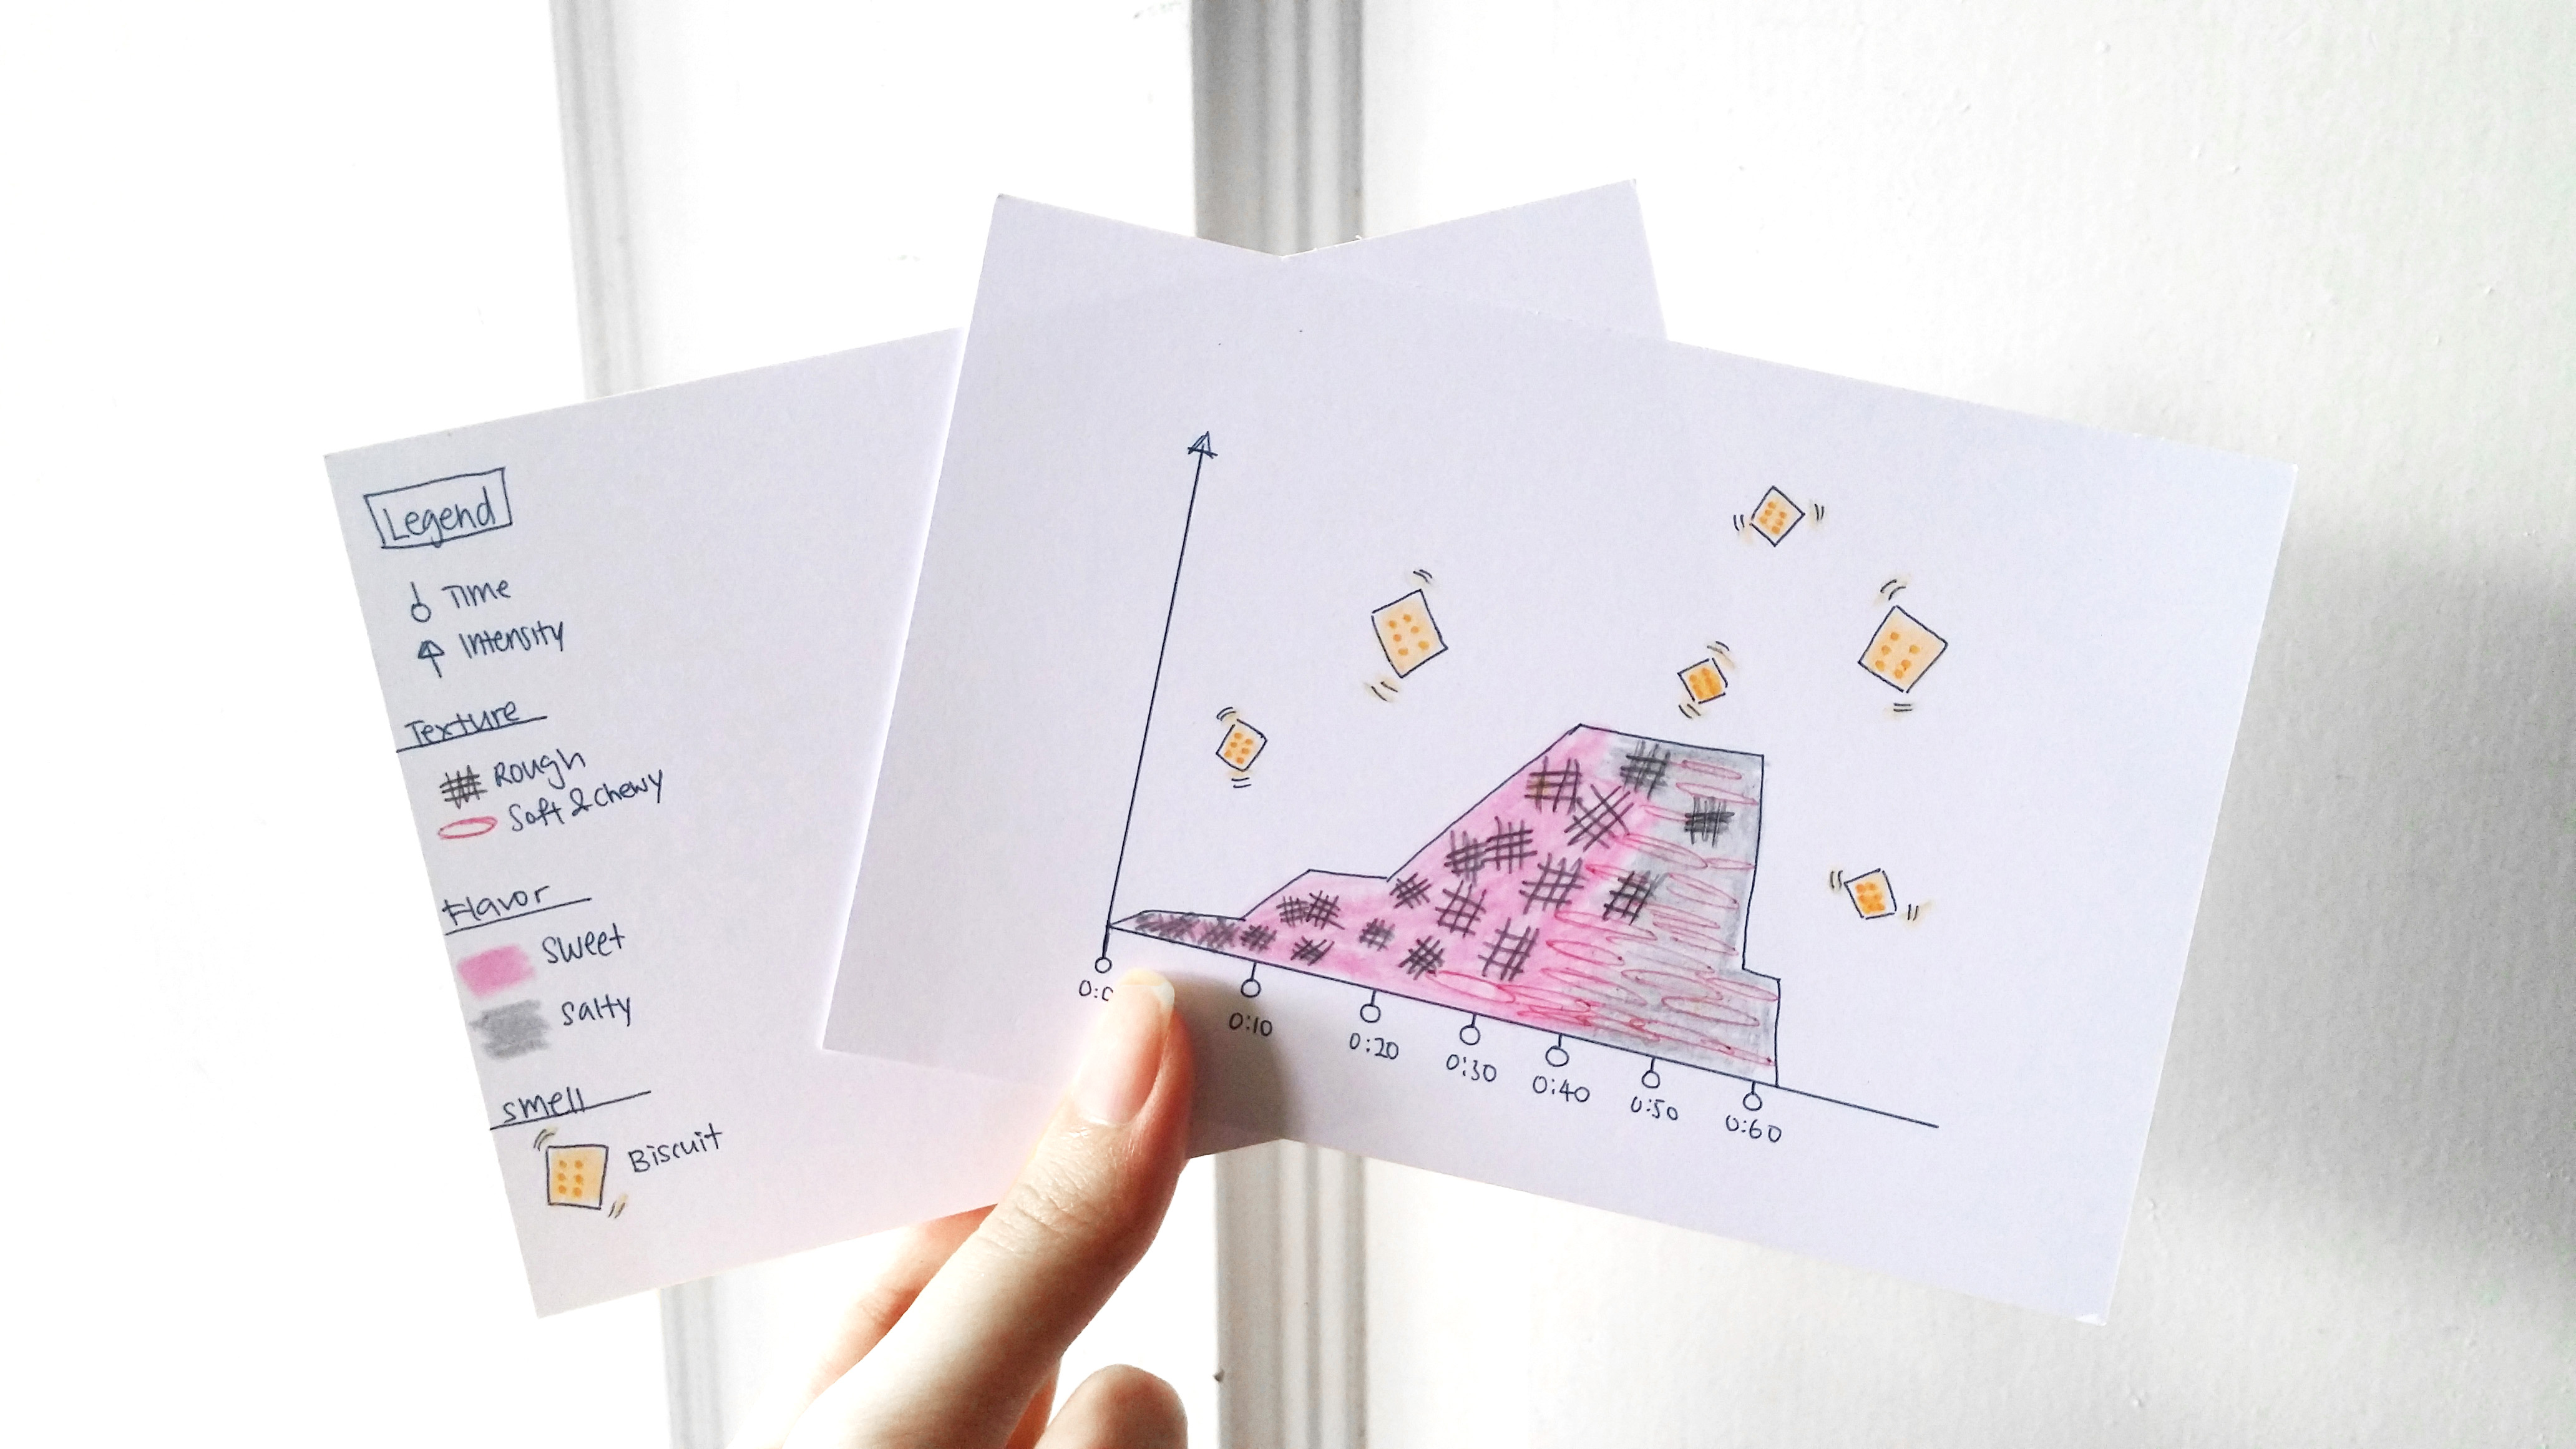 (Dulse Seaweed)
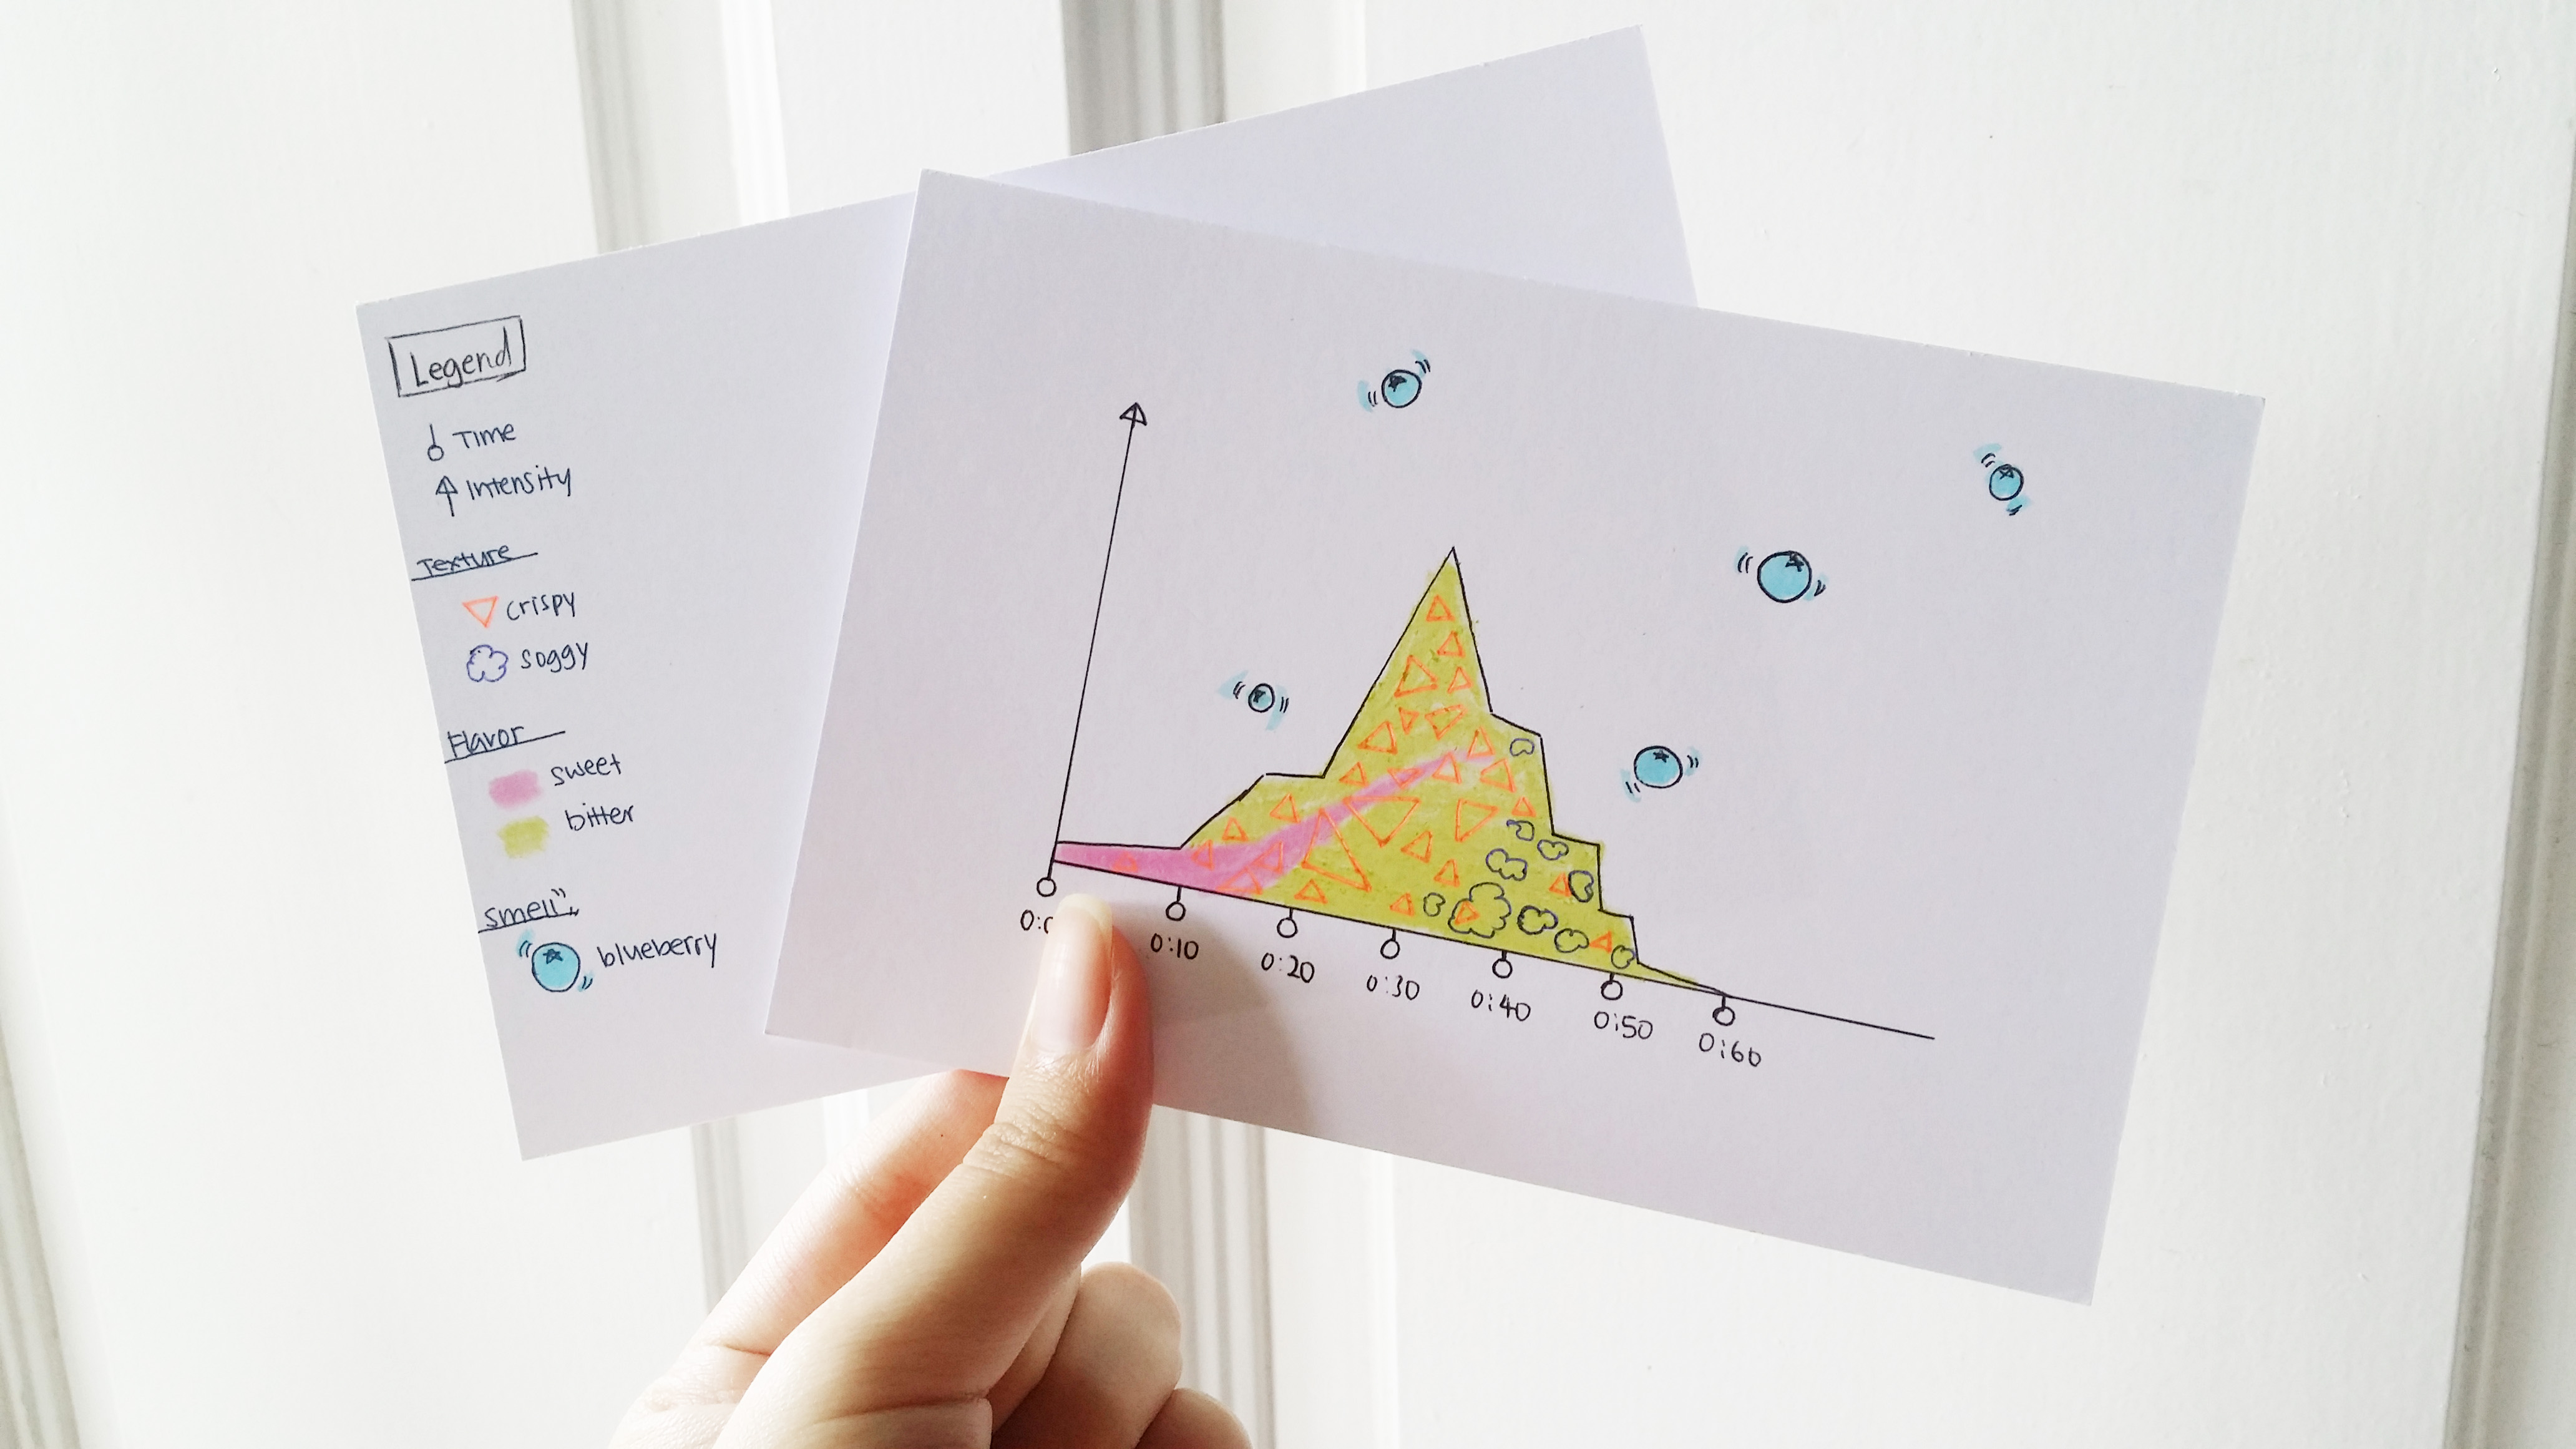
Week 3: Visualising Taste Postcard
Imaging myself being a scientist, dissecting the information and plotting it into a “scientific” graph.

 (2nd Attempt)
 (First attempt)
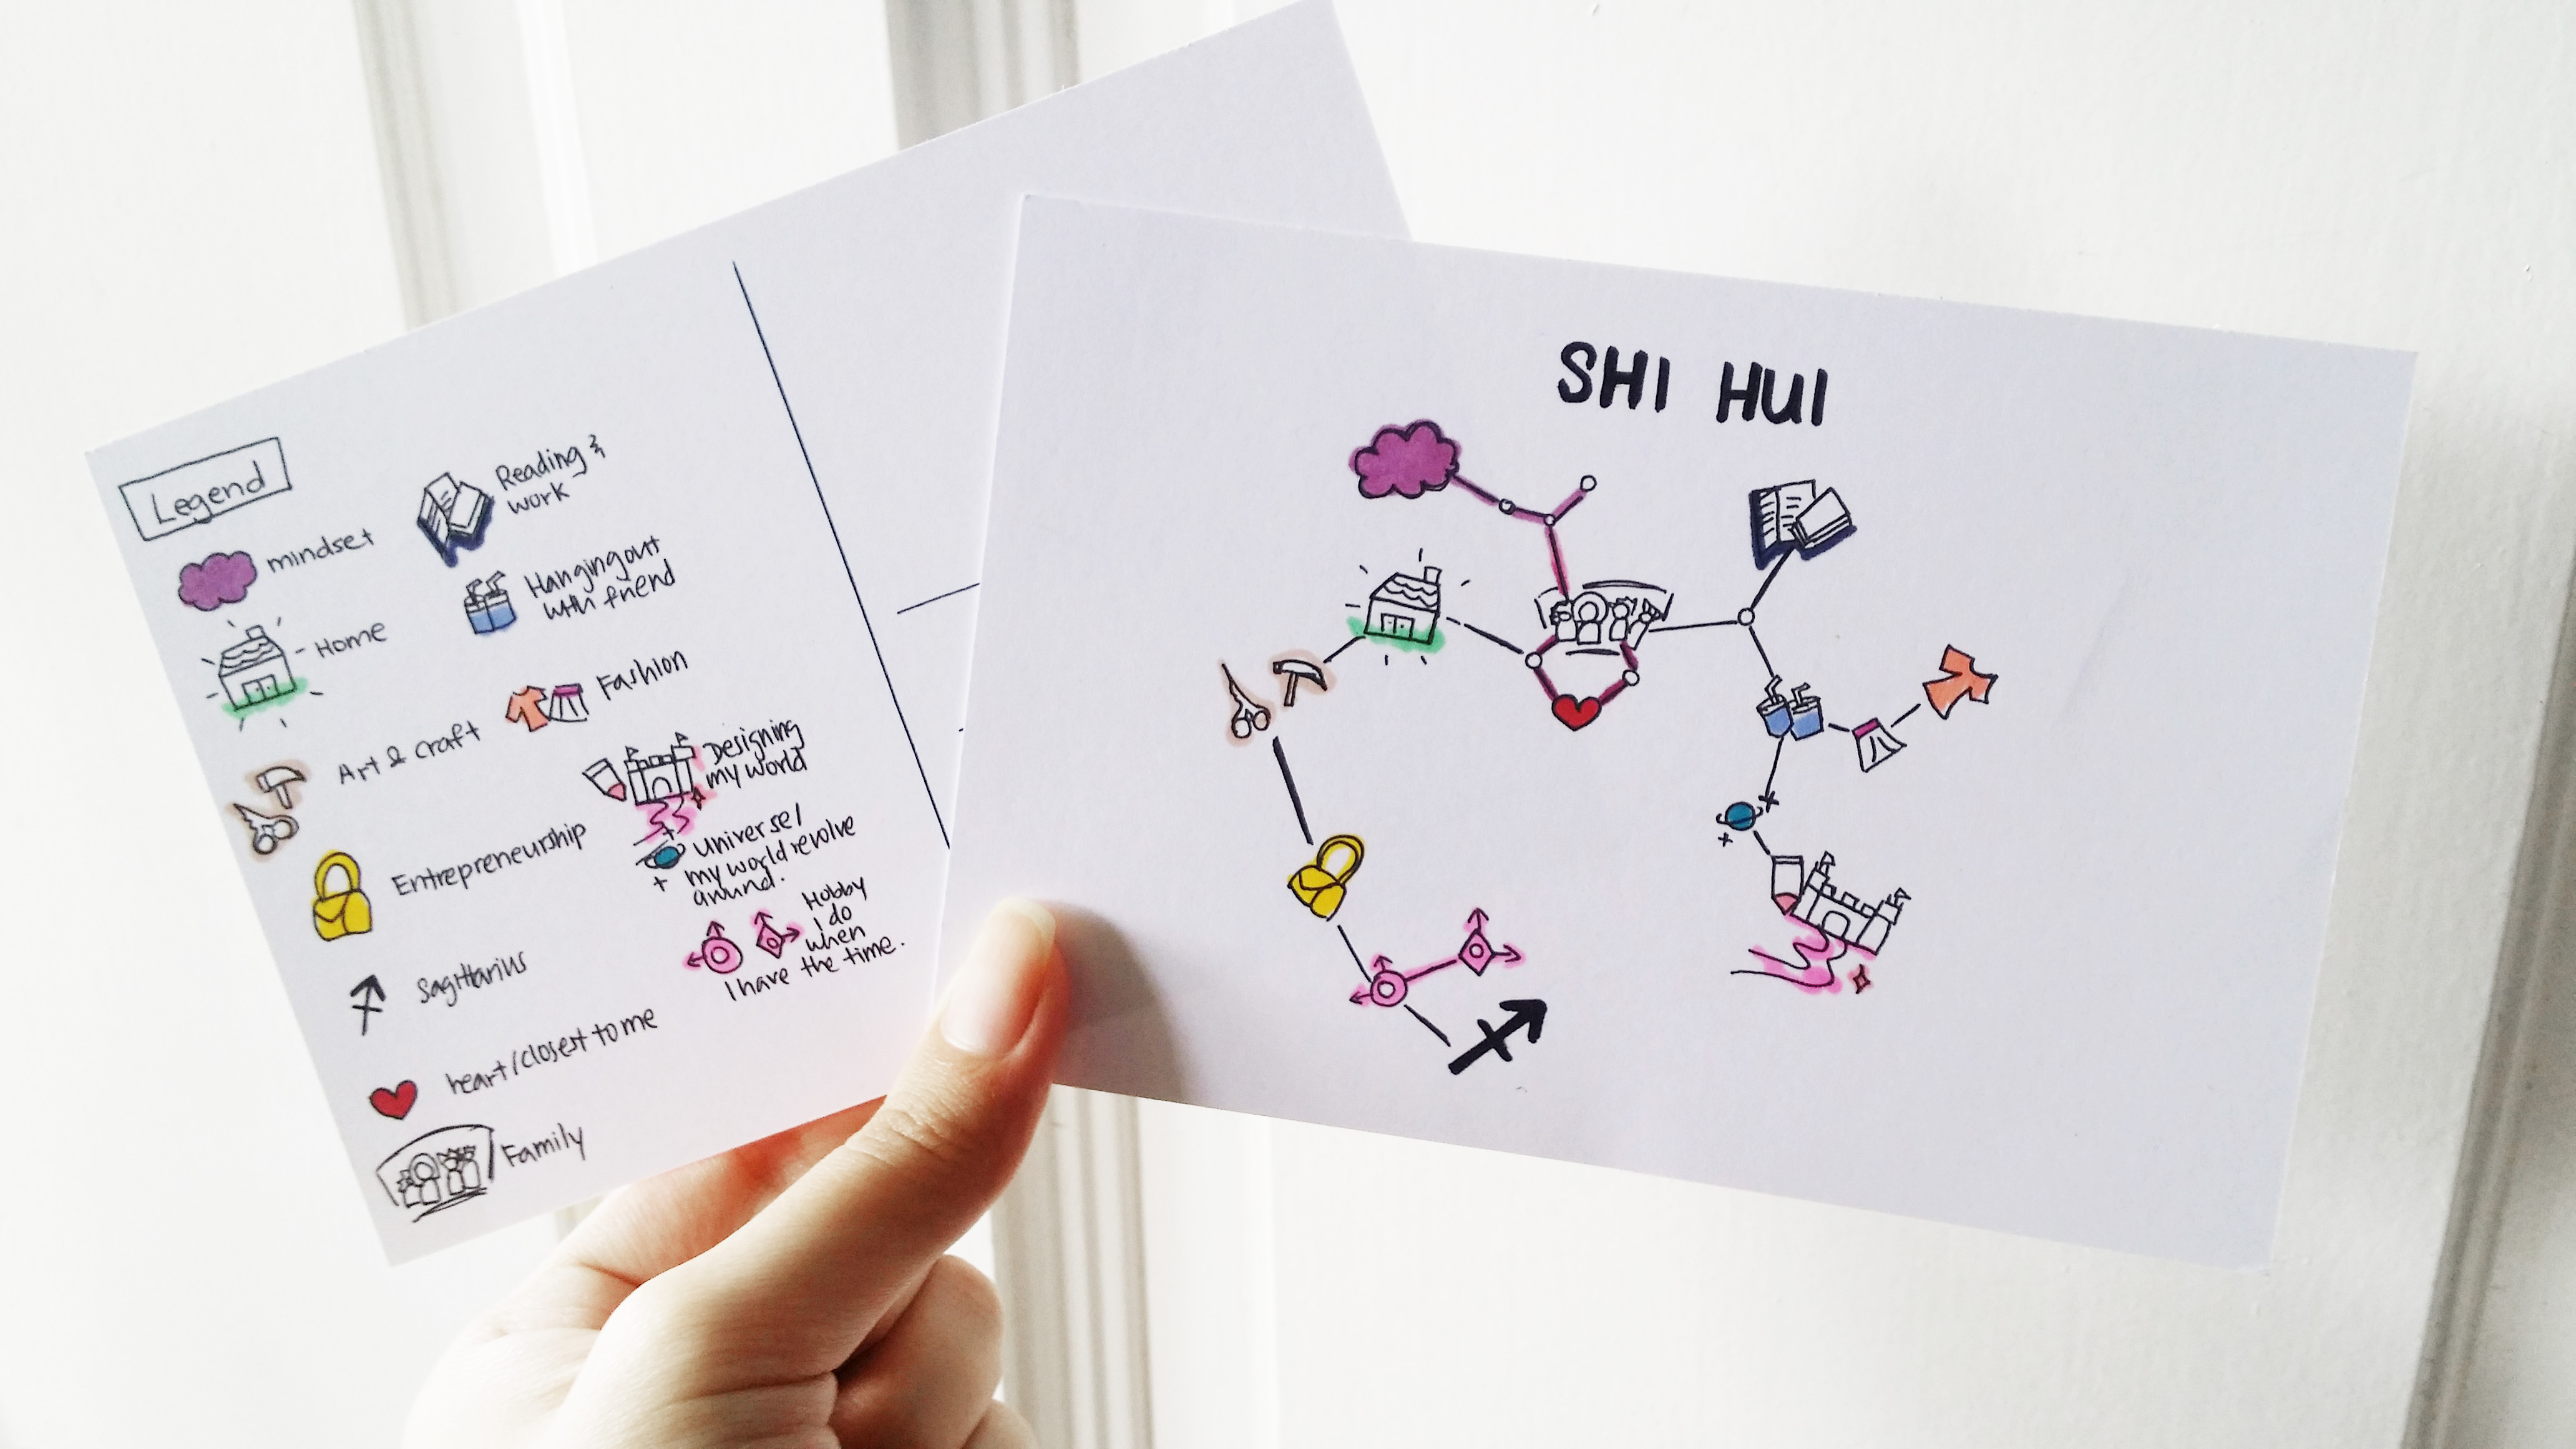
Week 2: Zodiac Man postcard
I started off with drawing a girl- myself, however, I decided to redo another piece to make it more fun and interesting.
My zodiac (wo)man is presented in the constellations of the Sagittarius. The stars are replaced by a different icon which represents the different aspect of me. At the middle of the postcard is a heart, which represents what I treasured the most, and it is linked to my family and home. While at the right side, there is a small universe, which represents the element that is revolving around my world– design. On the left side, highlighted in pink is the hobby which I love to do– art and craft.


 Week 4: Visualizing Sound, Stimmhorn – Triohatala
 Above: The Process of creating the data, lots of trial and error, but it was fun!