So during today’s consultation, I realised that Fusion Table was not presenting my data all that clearly. So Juan used another tool I had completely overlooked – Excel’s own graph generator. Which produced some interesting plots with my data (In the graphs below, I’m leaving out the numbers and grid lines since it’s the pattern that’s more interesting):
(A) Data which reveal the nature of his posts
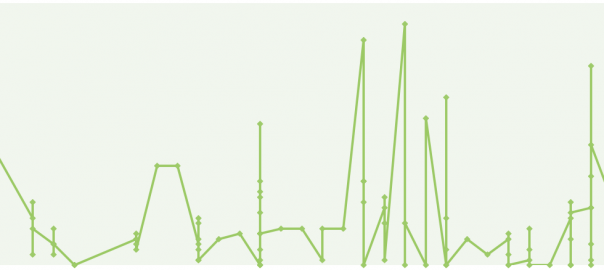
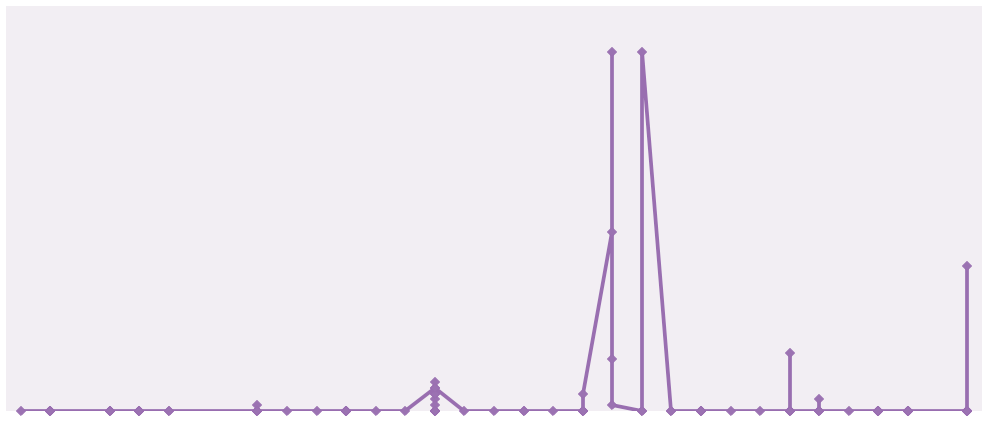
1. PM Lee’s posts’ time against the date:
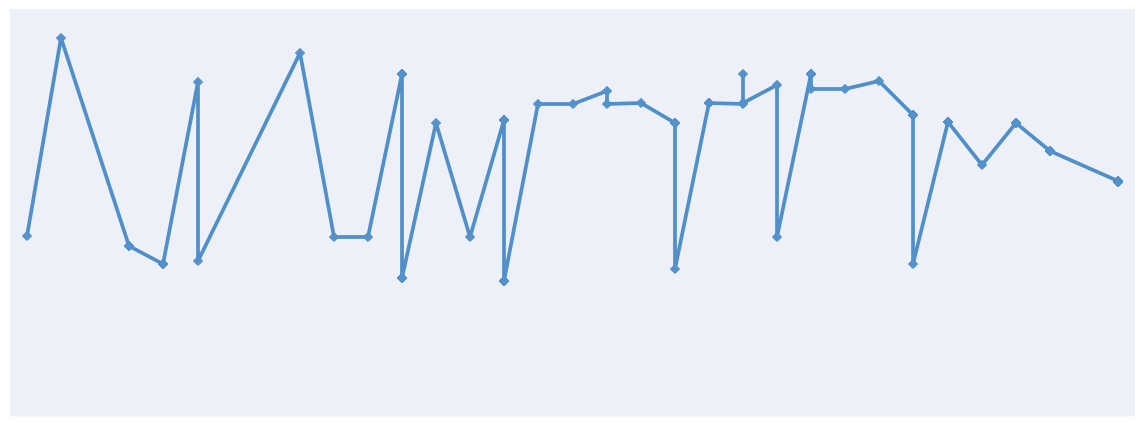
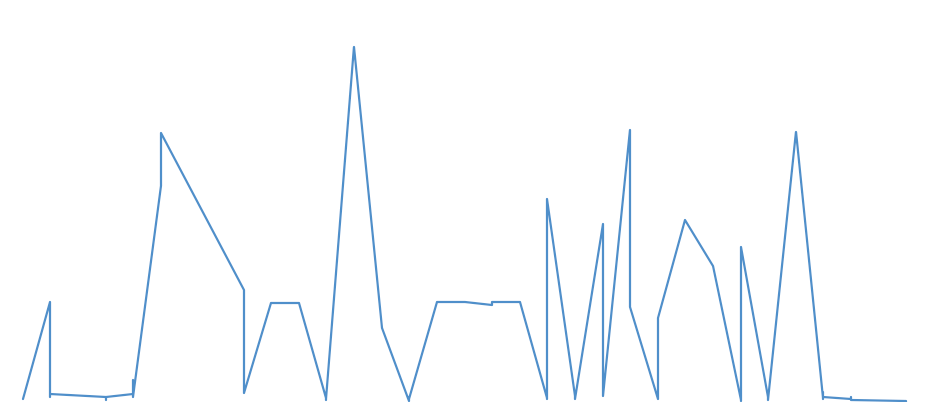
2. The number of times PM Lee appears in his photos against the date.
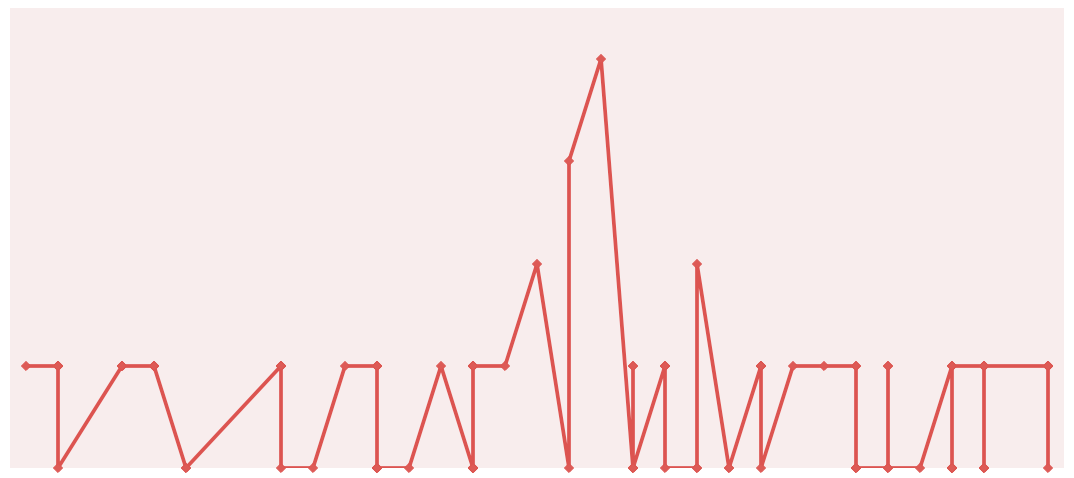
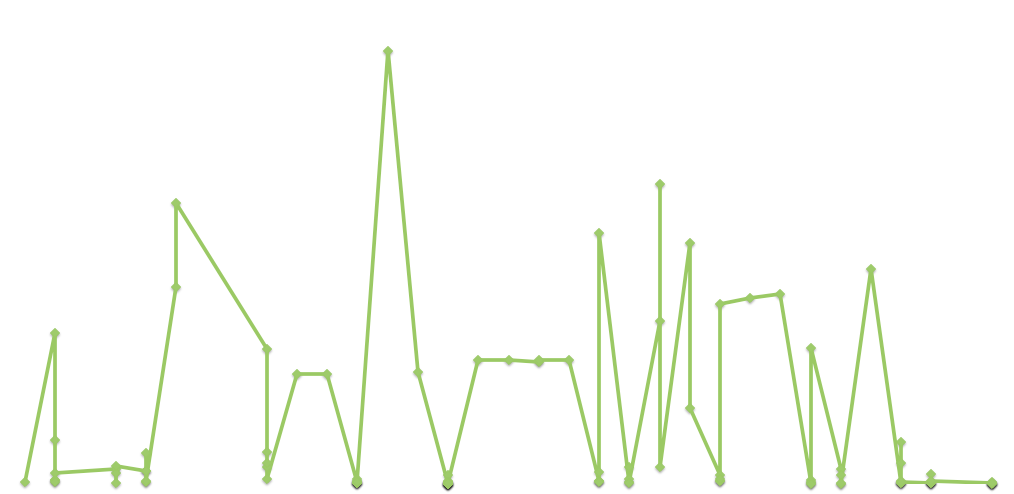
3. The number of adults in his photos against the date:
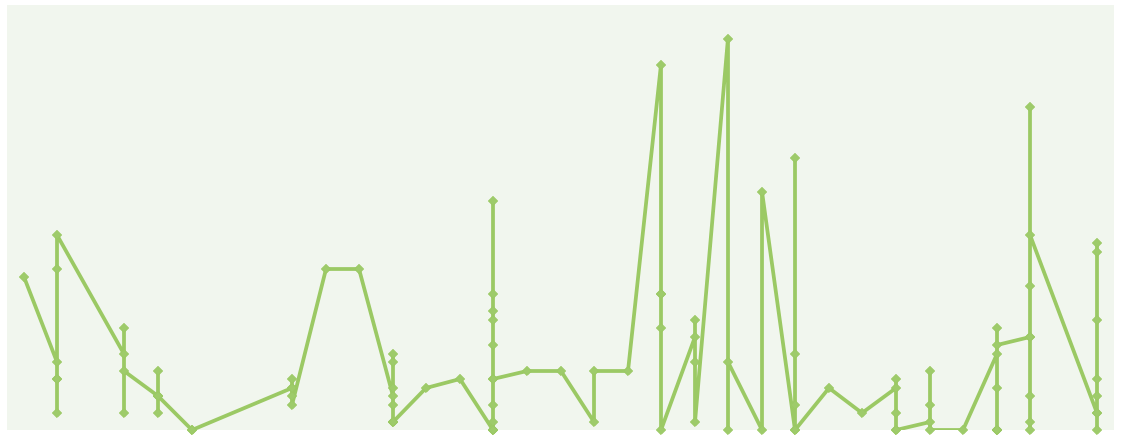
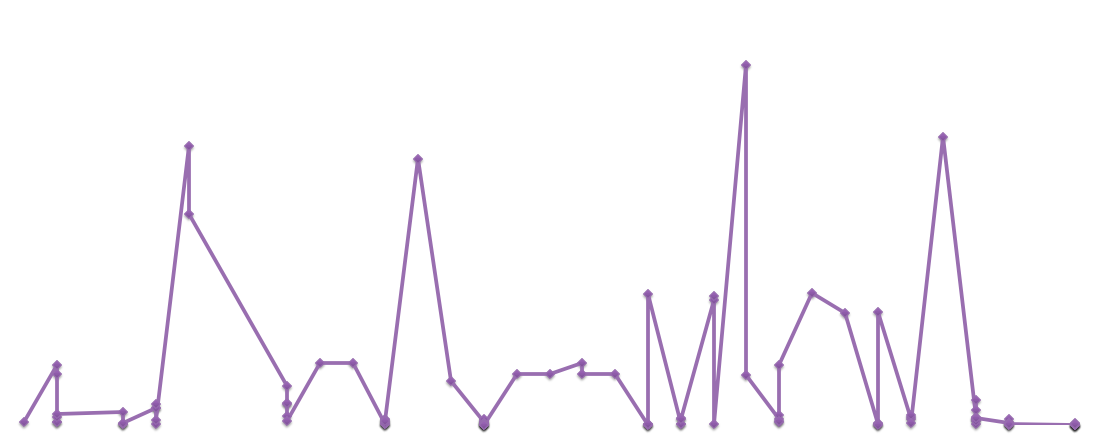
4. The number of children in his photos against the date:
(B) Data on public response to his posts
1. The number of likes against the date:
2. The number of shares against the date:
3. The number of comments against the date:
And then as we were discussing, Diana had this brilliant idea that the line graphs could be converted to music! Excited to see where this brings us.
I think it would be interesting to start superimposing different data on top of one another, with specific dates, perhaps location, events taking place, etc. For me, the data takes on meaning when it is compared to something else, even a comparison between different types of data. For example, it is interesting to compare shares and comments to see that they are similar, but then is it possible to compare comments/shares with the photos that Lee appears in. Is there a correlation between sharing/commenting and Lee’s image? That is the kind of juxtaposition of data that could reveal some very interesting strategies at play in terms of how social media is being used as a political tool.