Final Project – What Is A Child Worth?

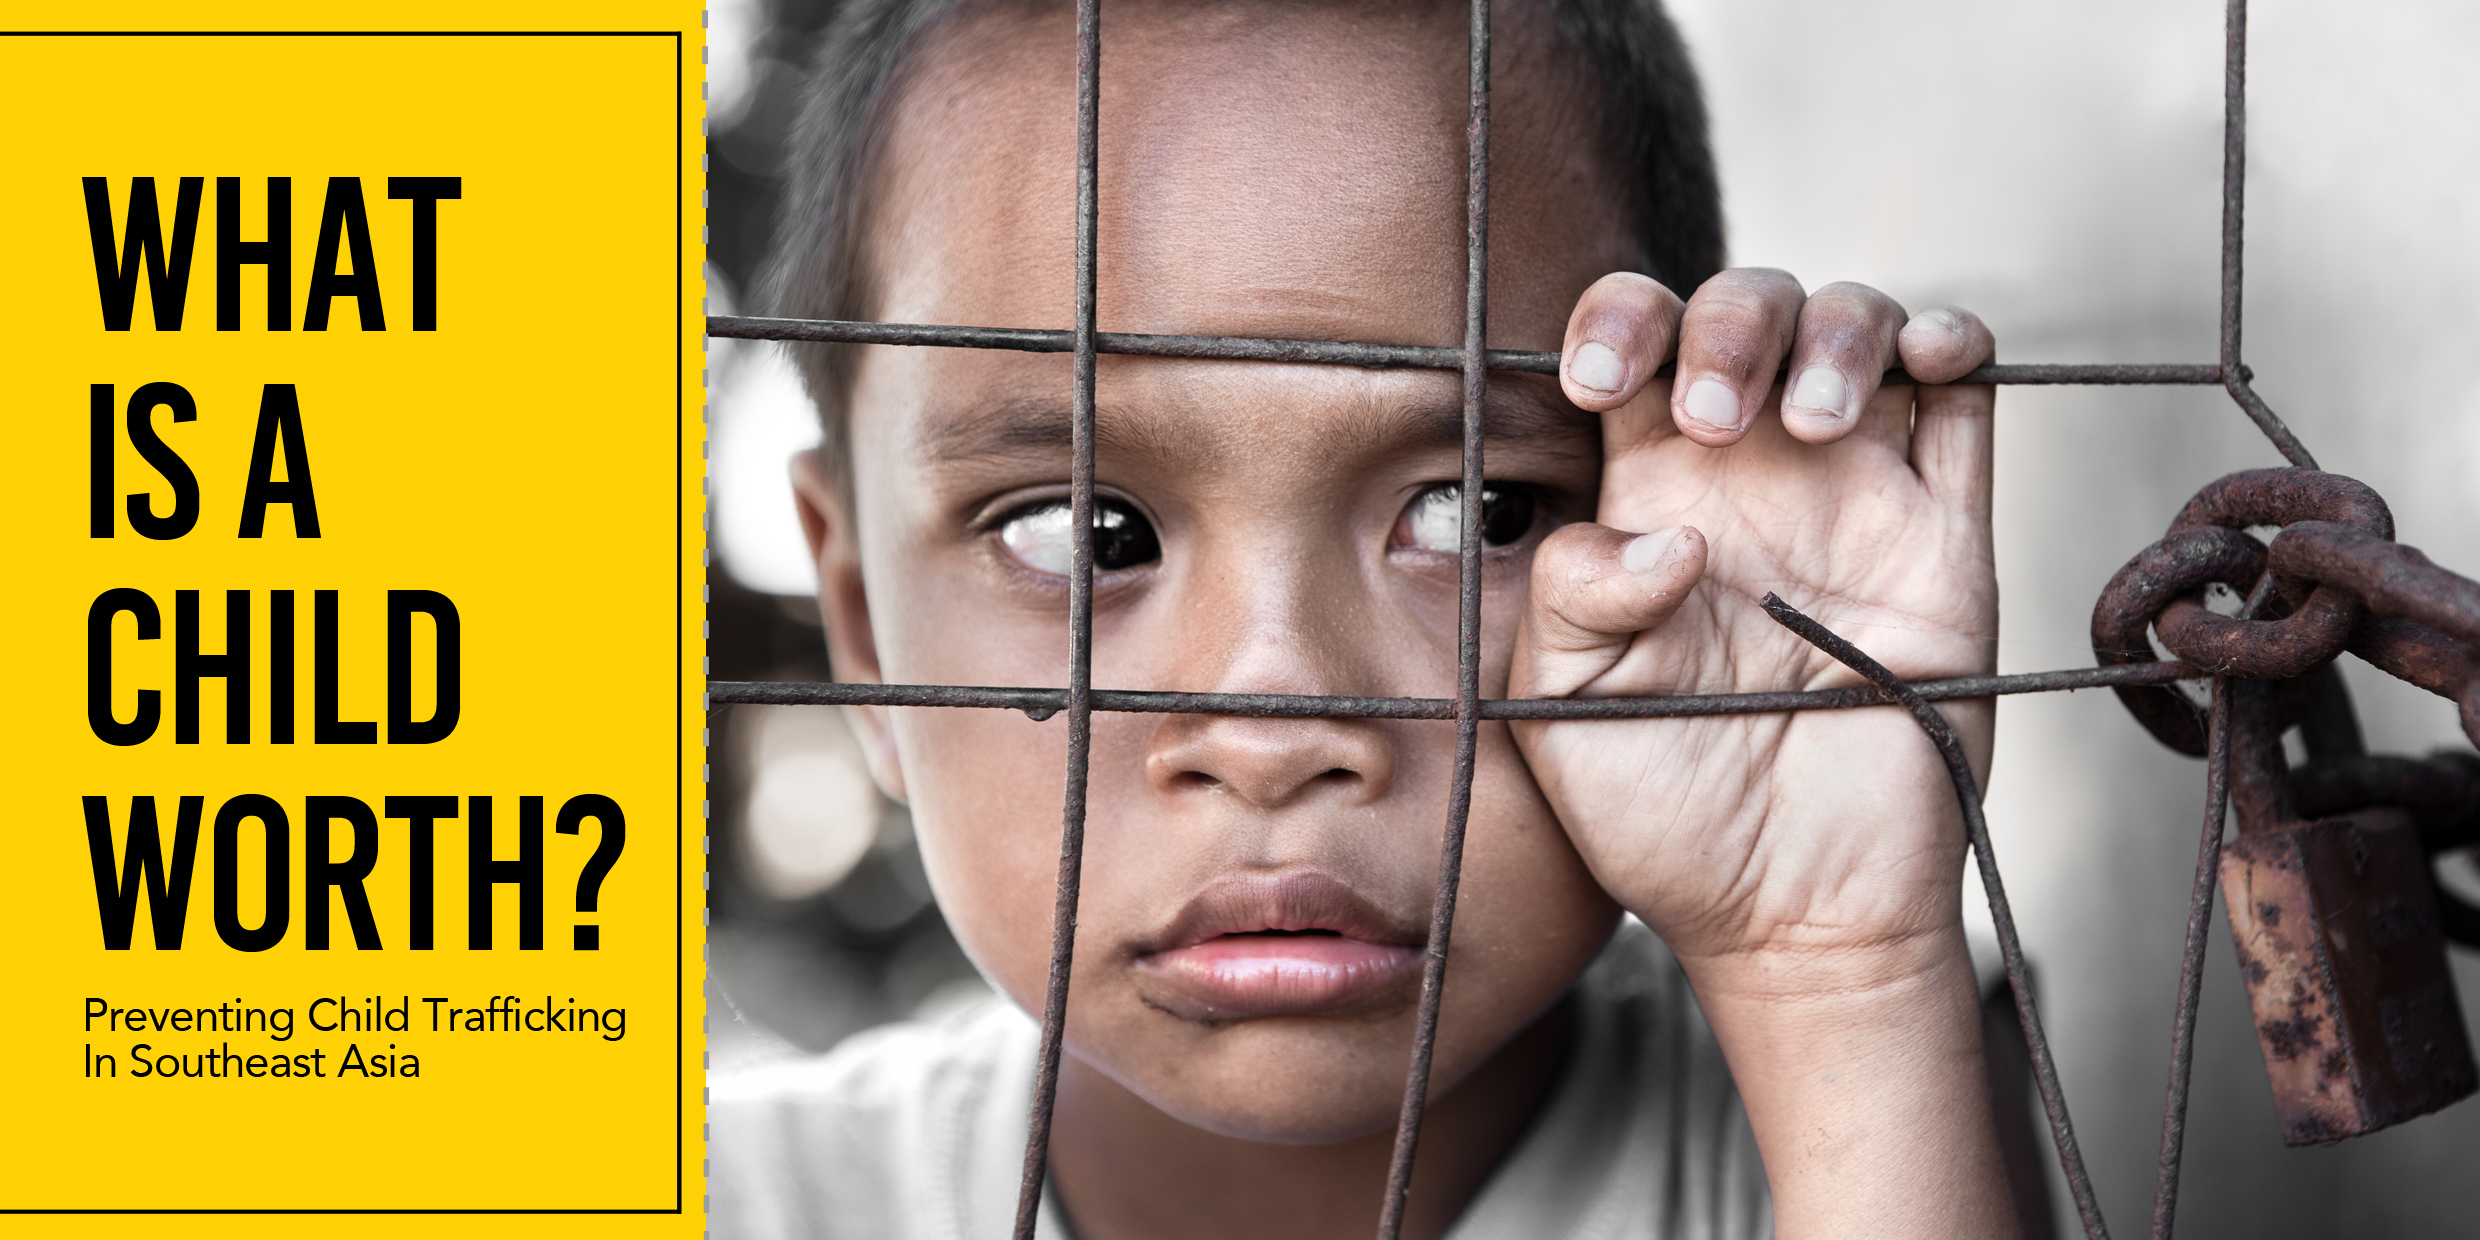
For this project, I chose to focus on the topic of child trafficking in Southeast Asia. Child trafficking is a serious and poignant subject to delve into, and it was not very pleasant digging through sources and sources for information because there were many things that were quite terrible stories and facts that I came across, but when choosing the topic for our final, I knew instantly that I wanted to do this because I felt it was something that was sort of taboo to talk about in society and that made it something that wasn’t usually broached. Also, I felt that just because it was not as common in Singapore as it is overseas, it was still something that needed more coverage. 

I began by asking around my peers, to try to see what information they knew about child trafficking. However, time after time, the answer would be the same – vague. I also asked what would really leave an impact on them if they were to be told about the subject, and they mostly said if it were people they know that it happened to, or people they knew who told them about it, and one common answer was the survival stories of victims.

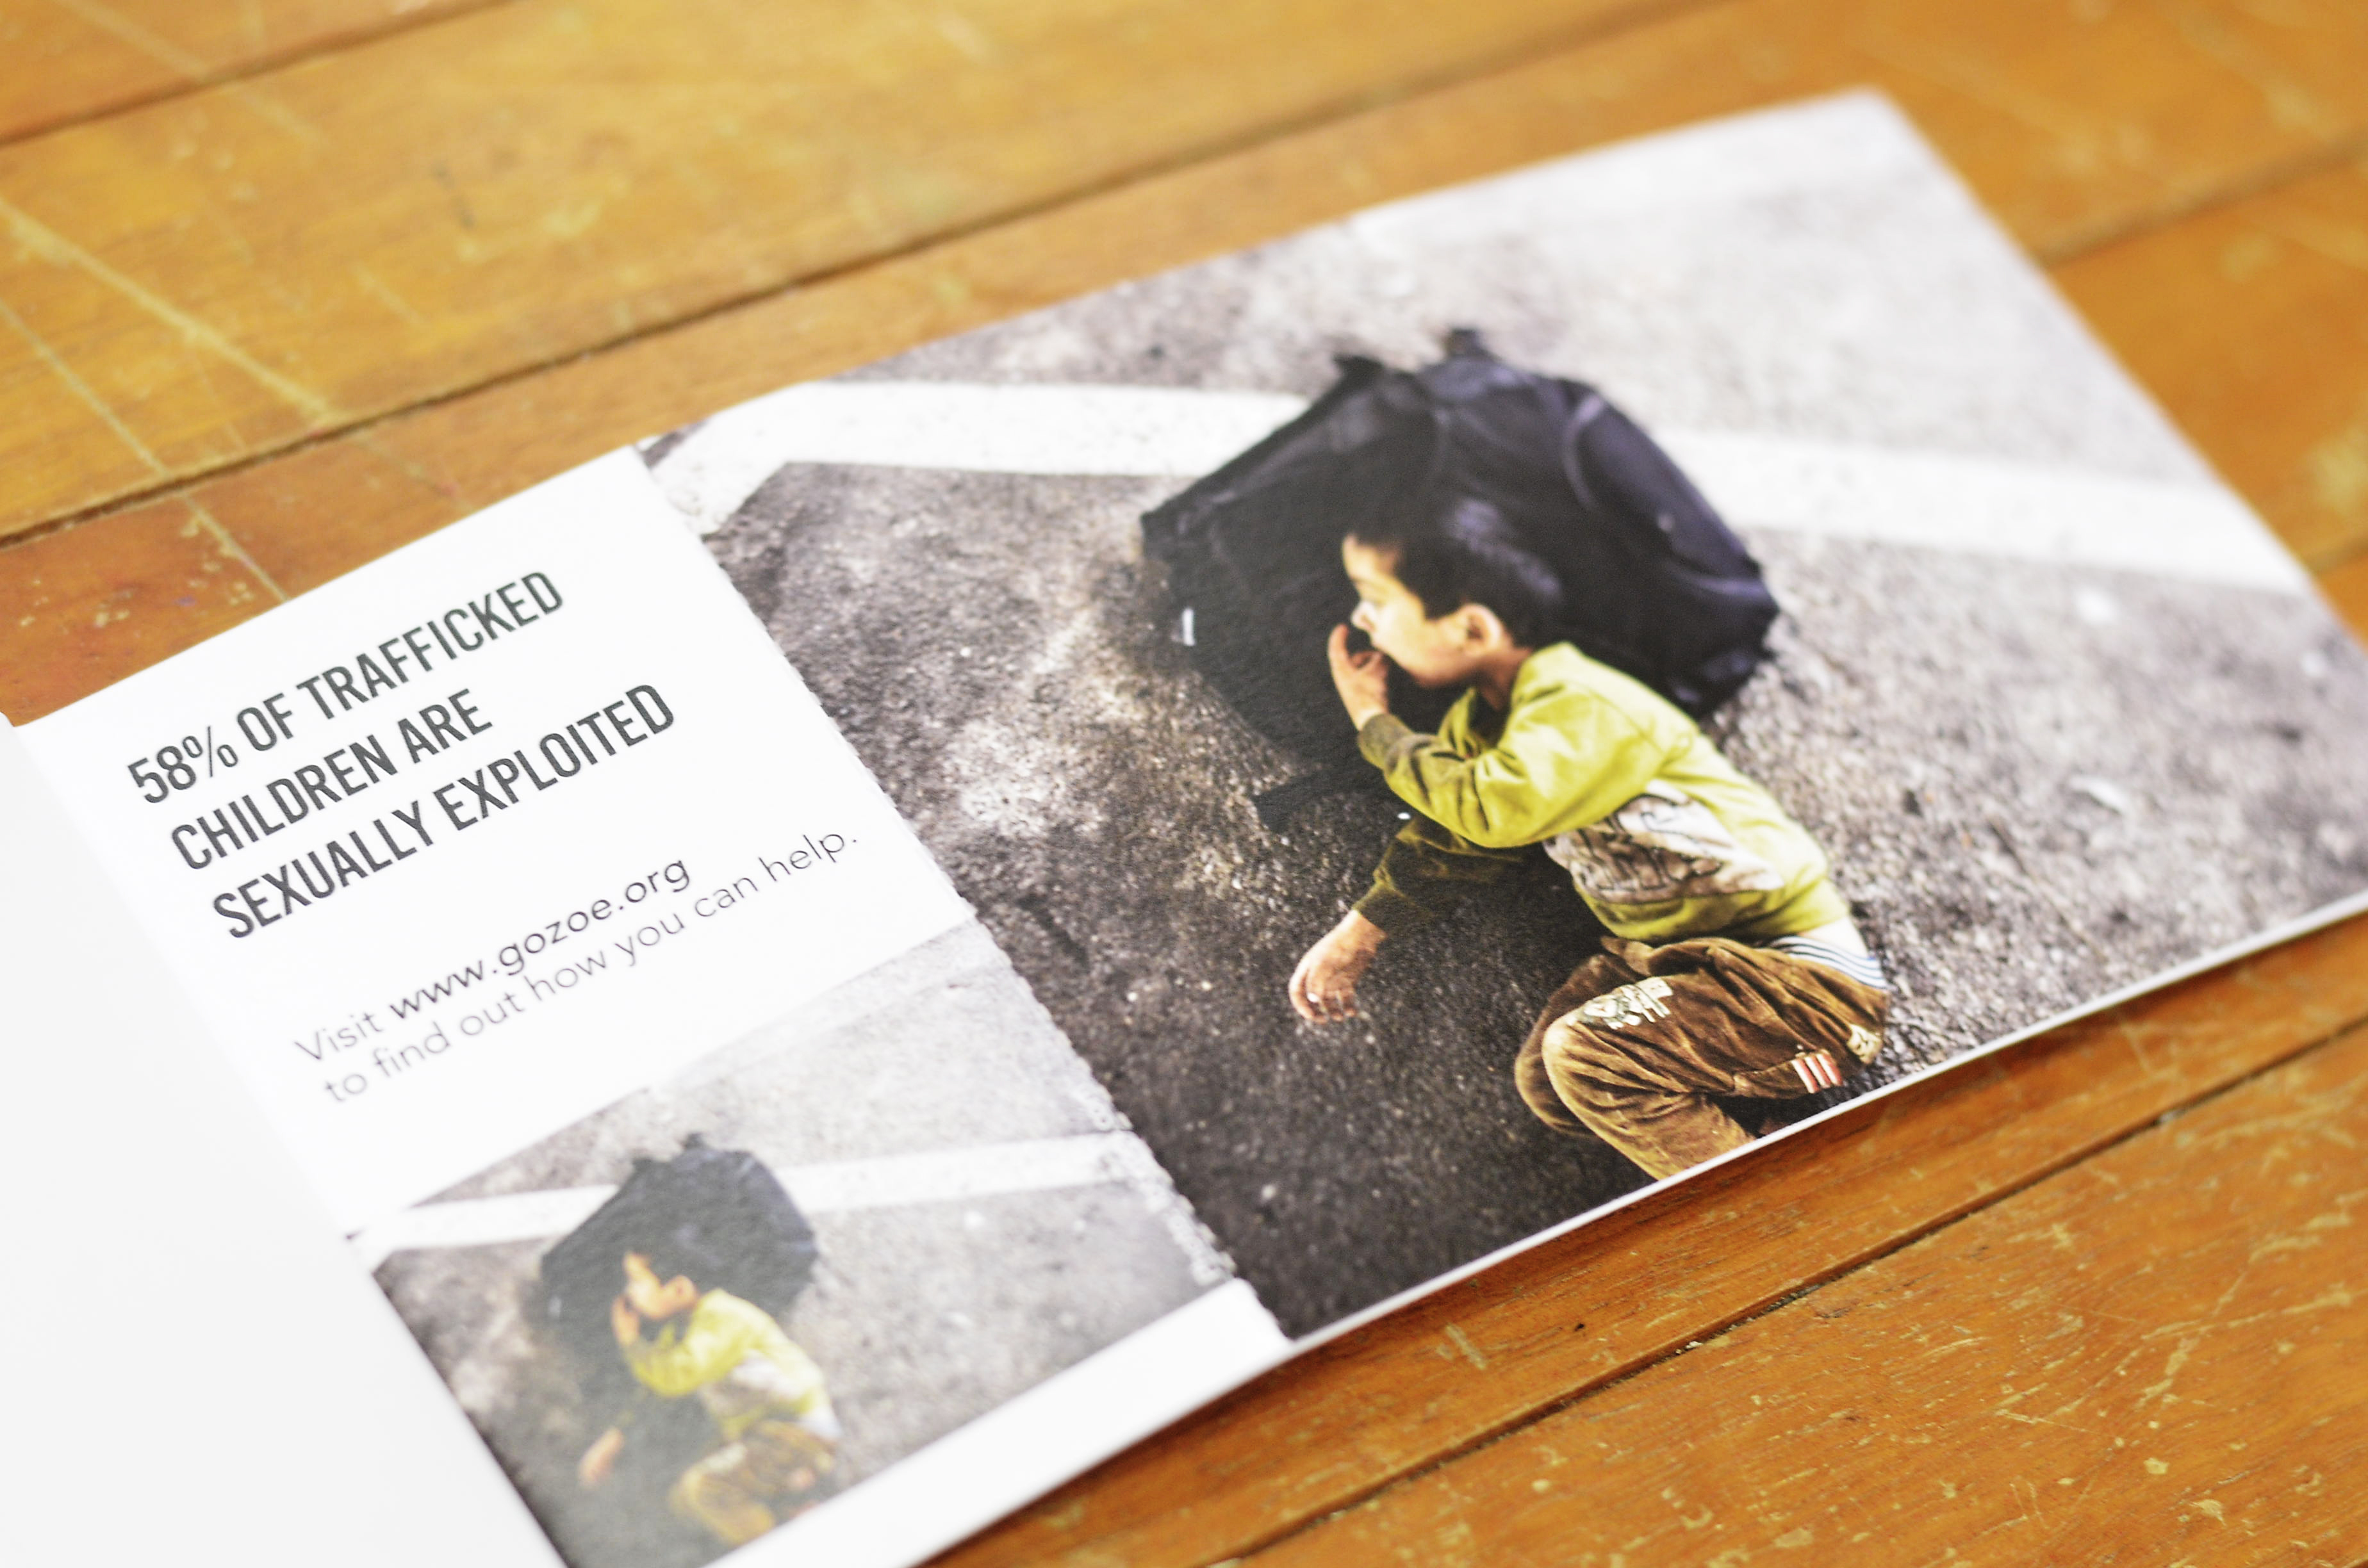
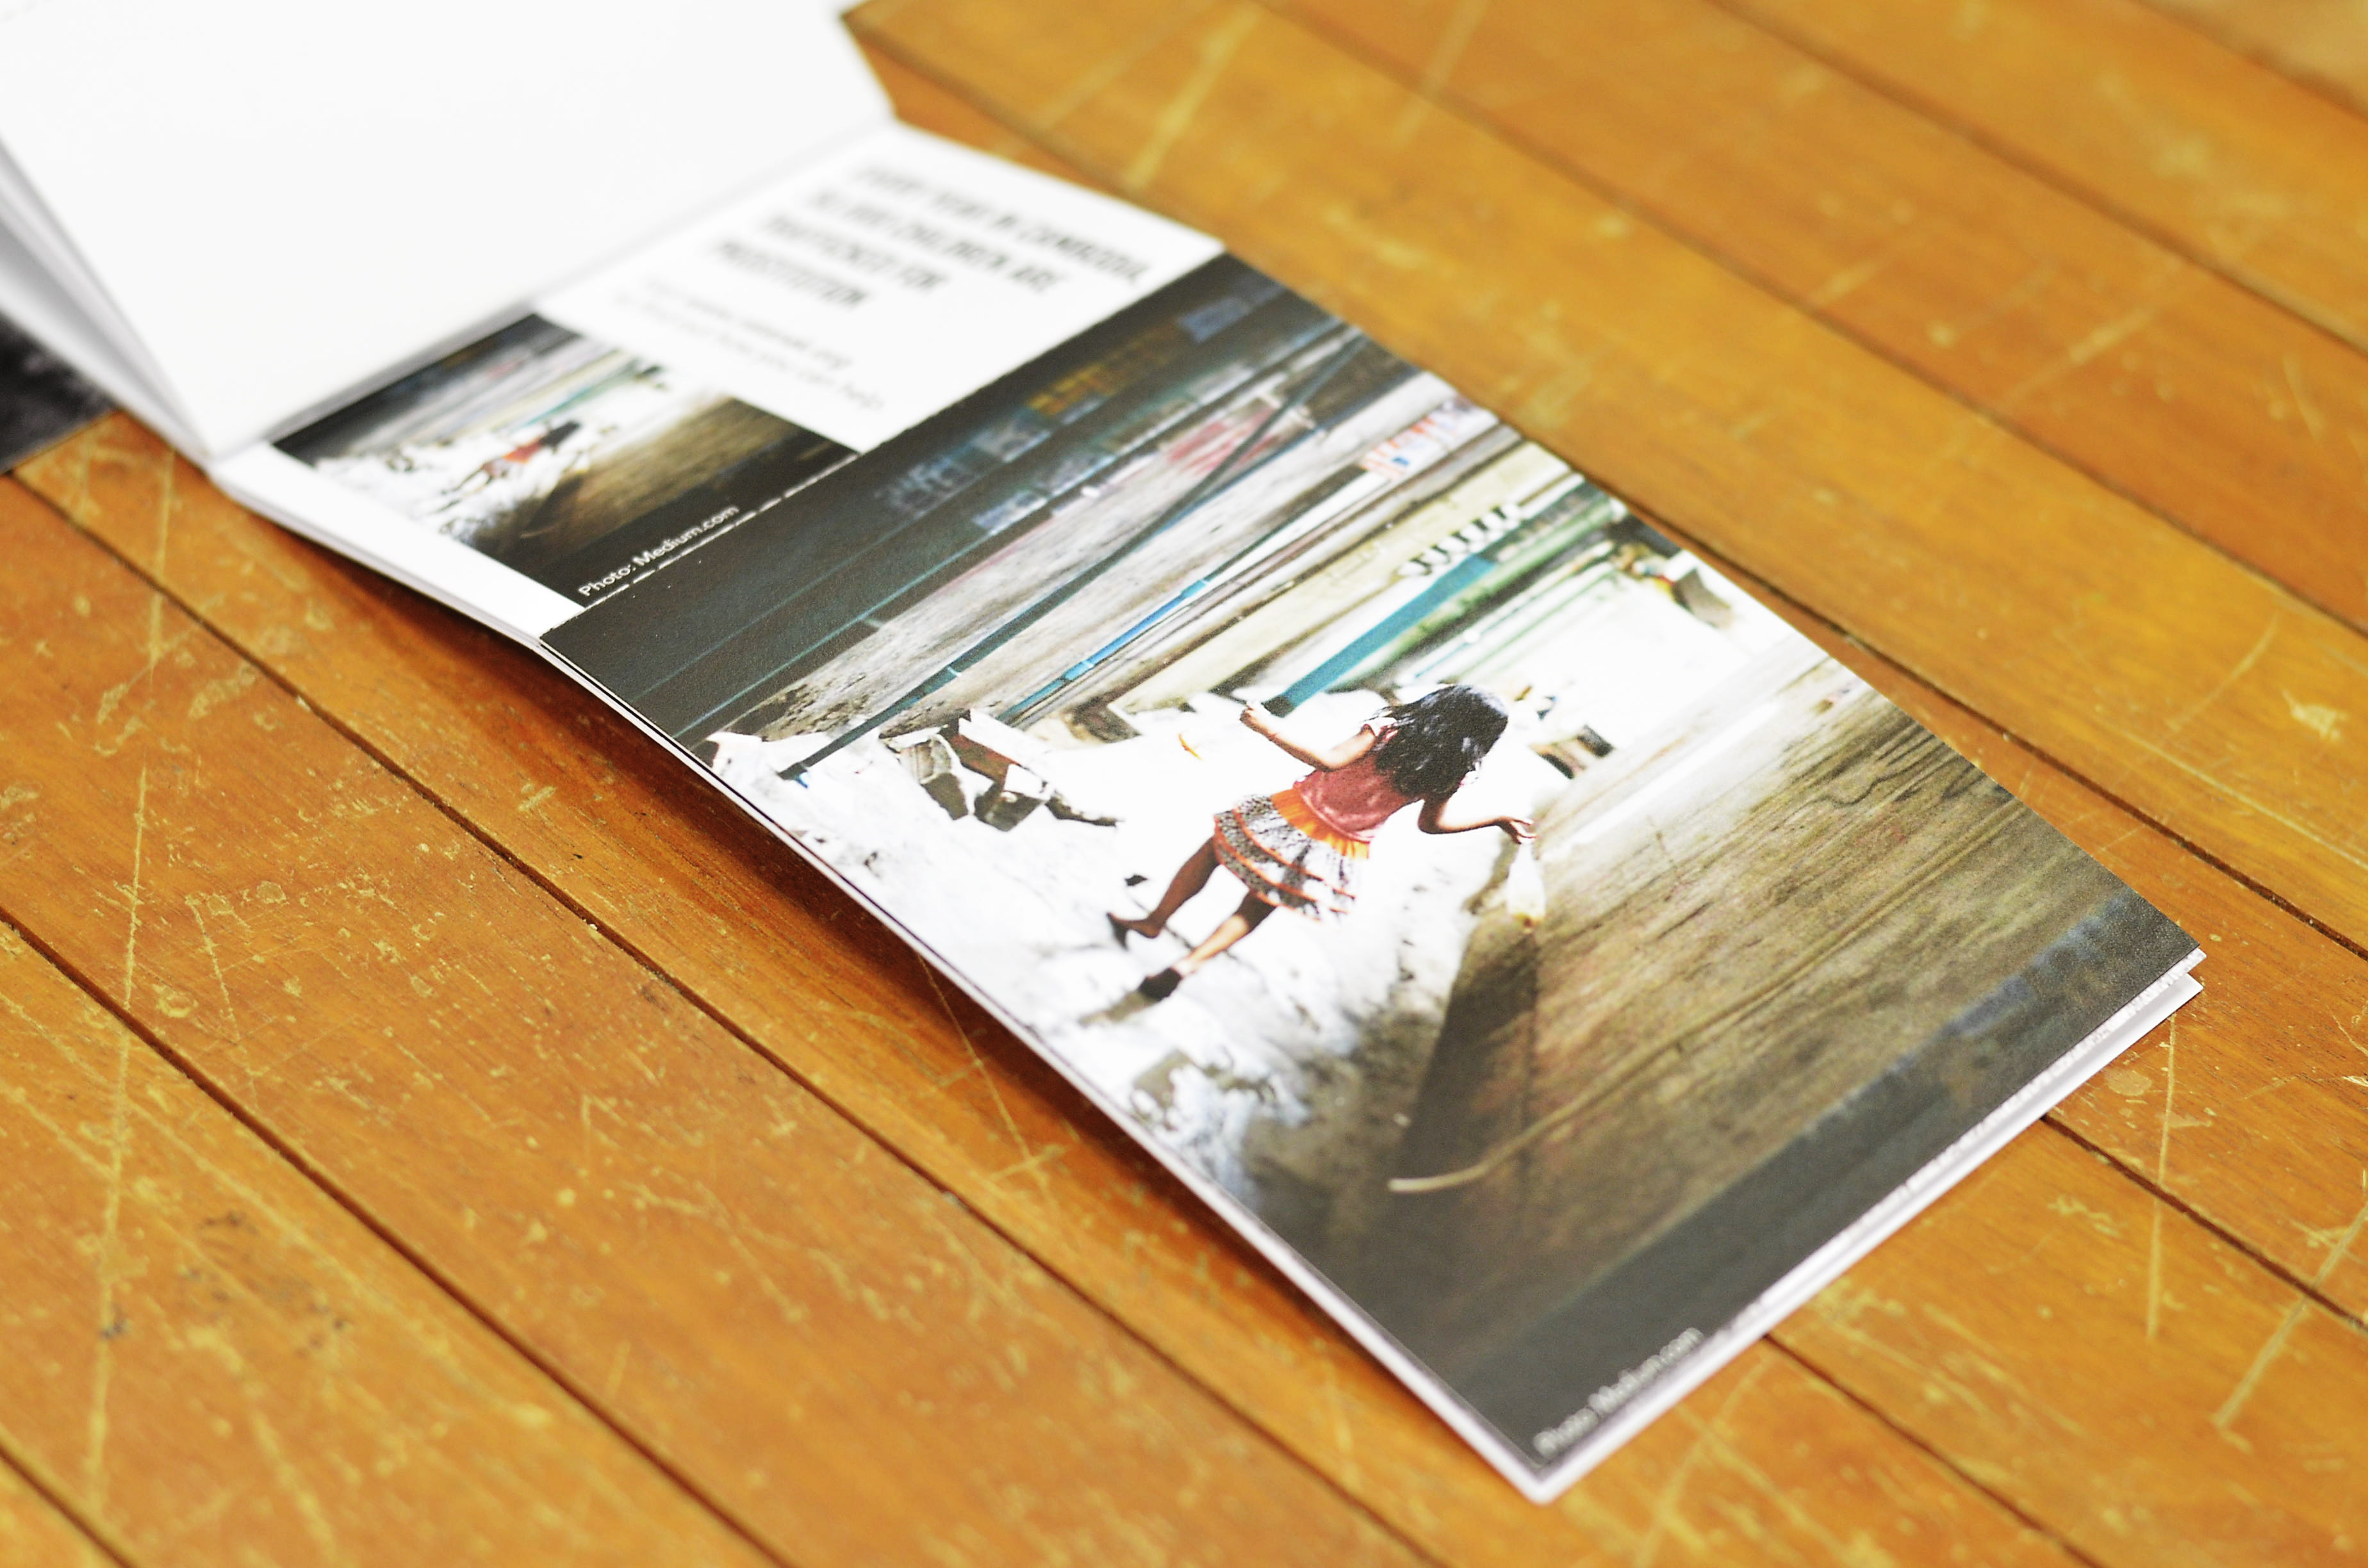
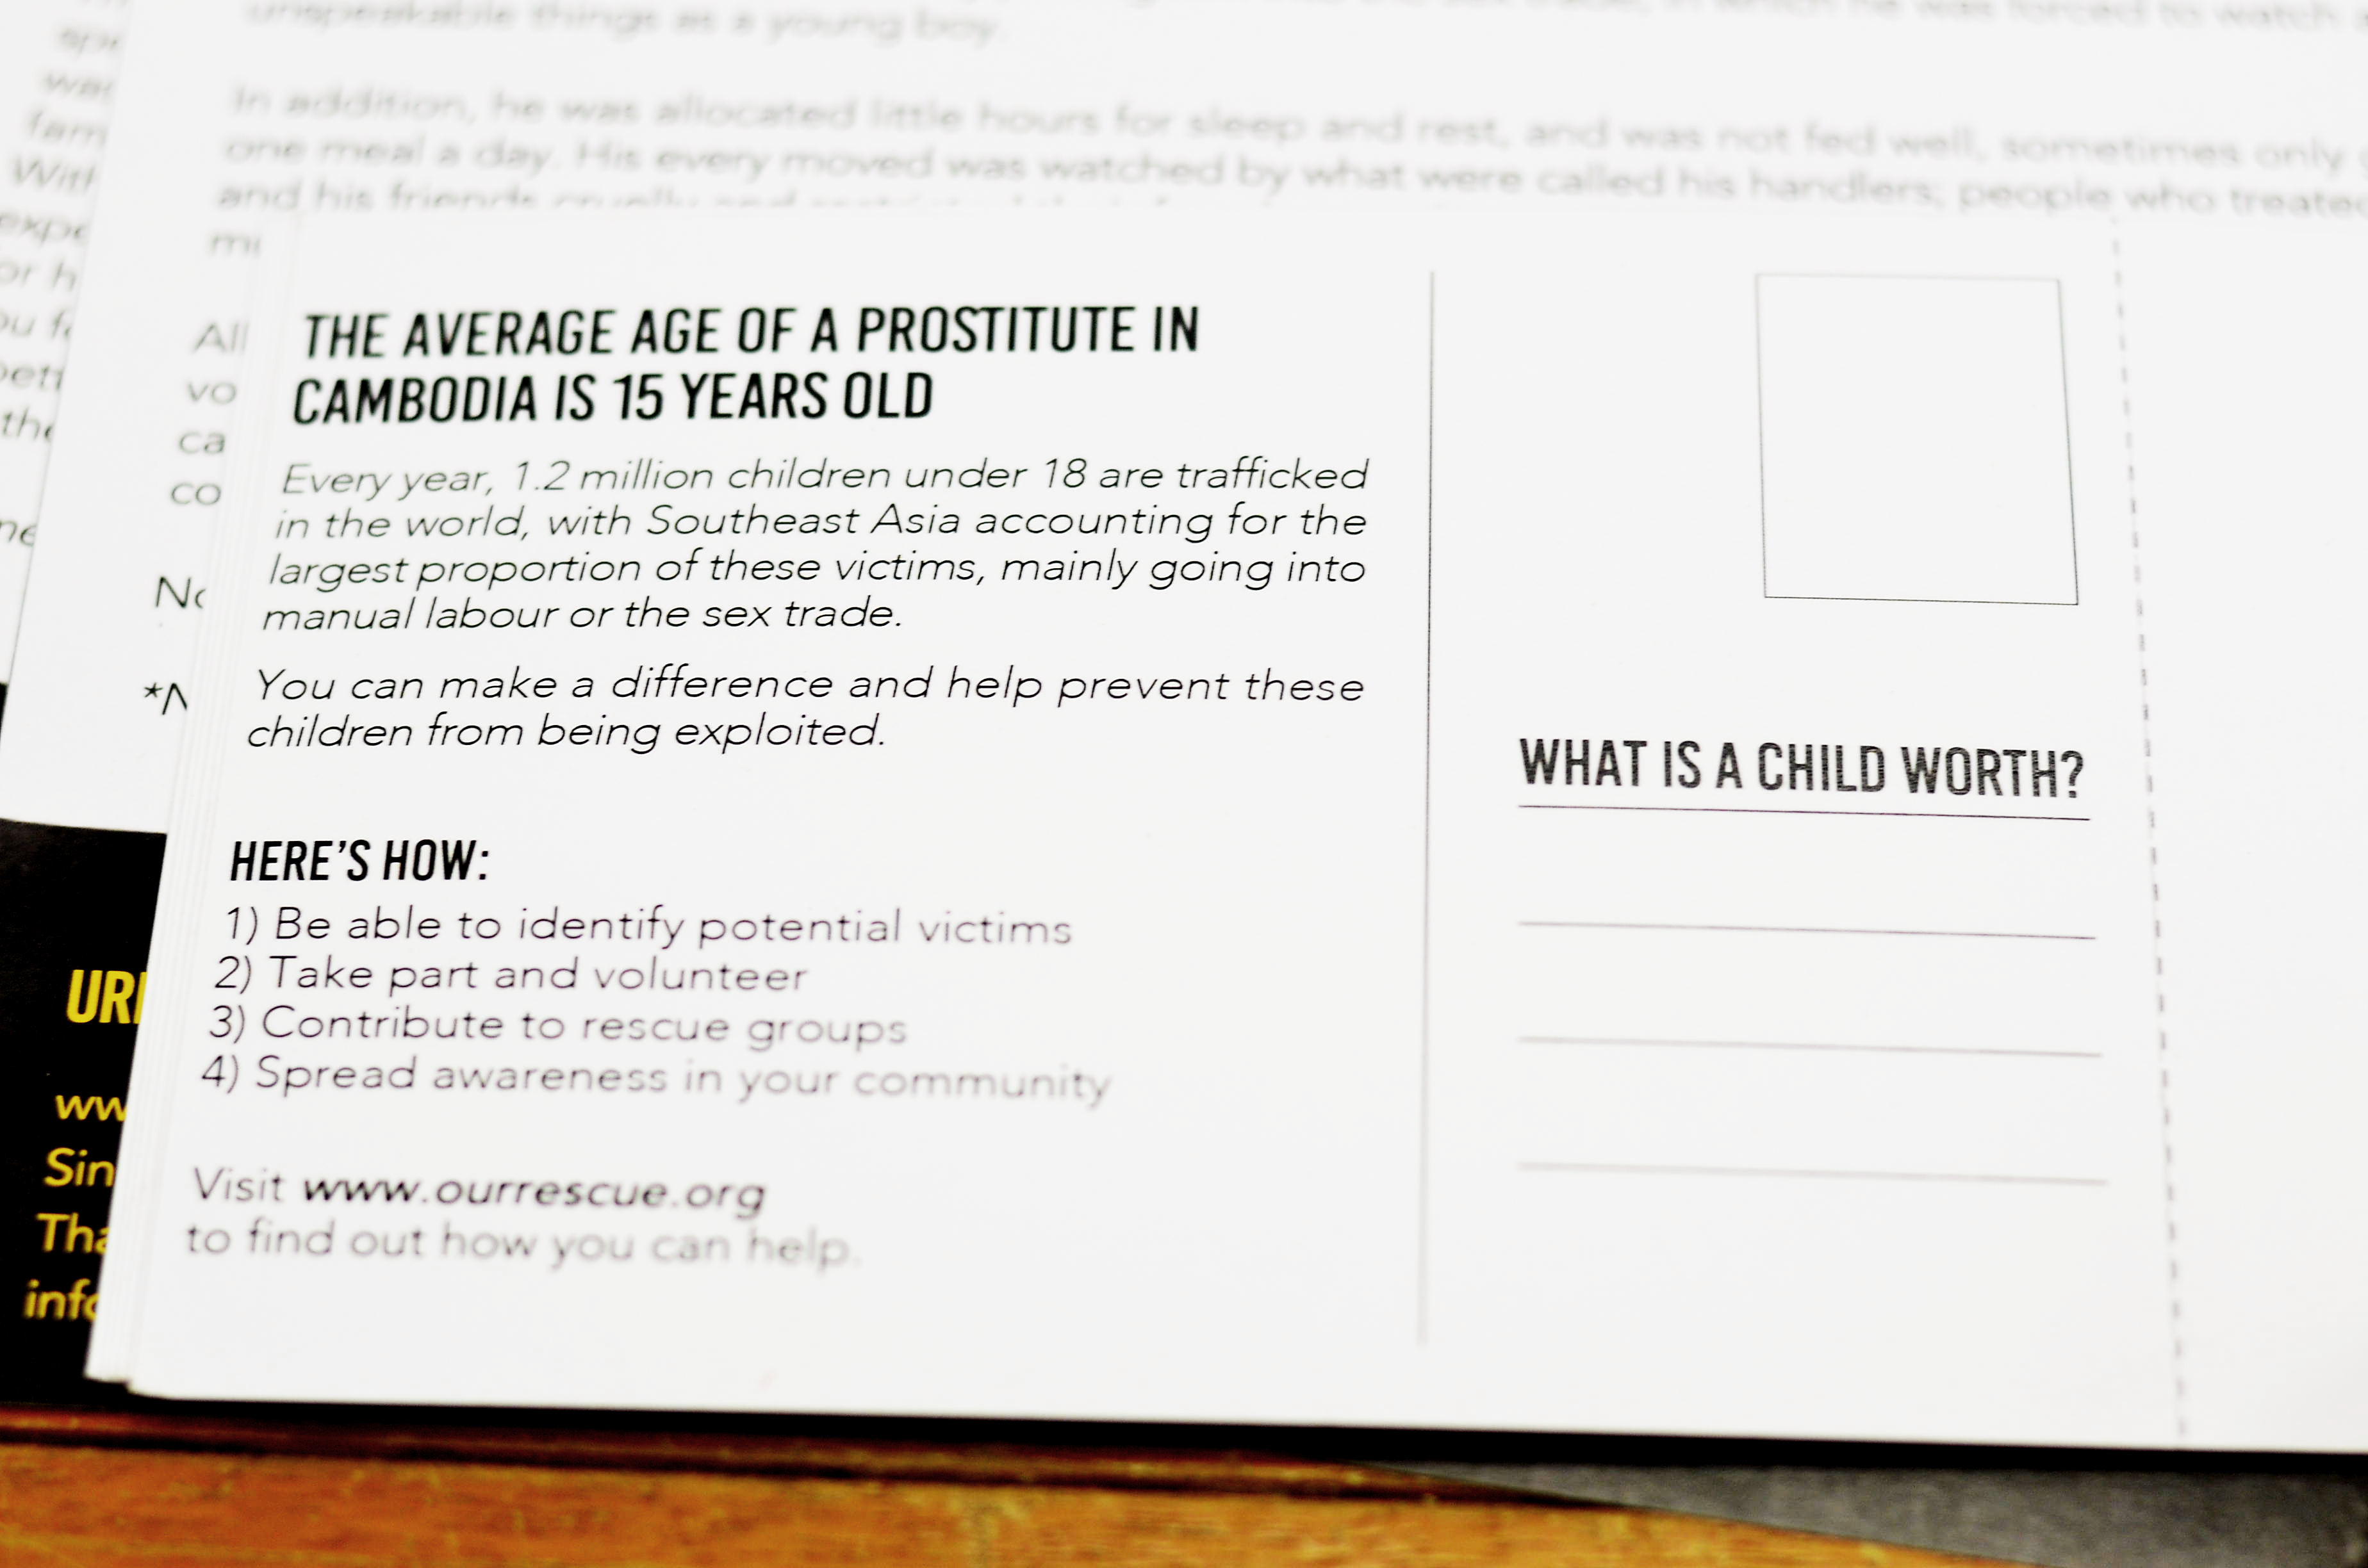
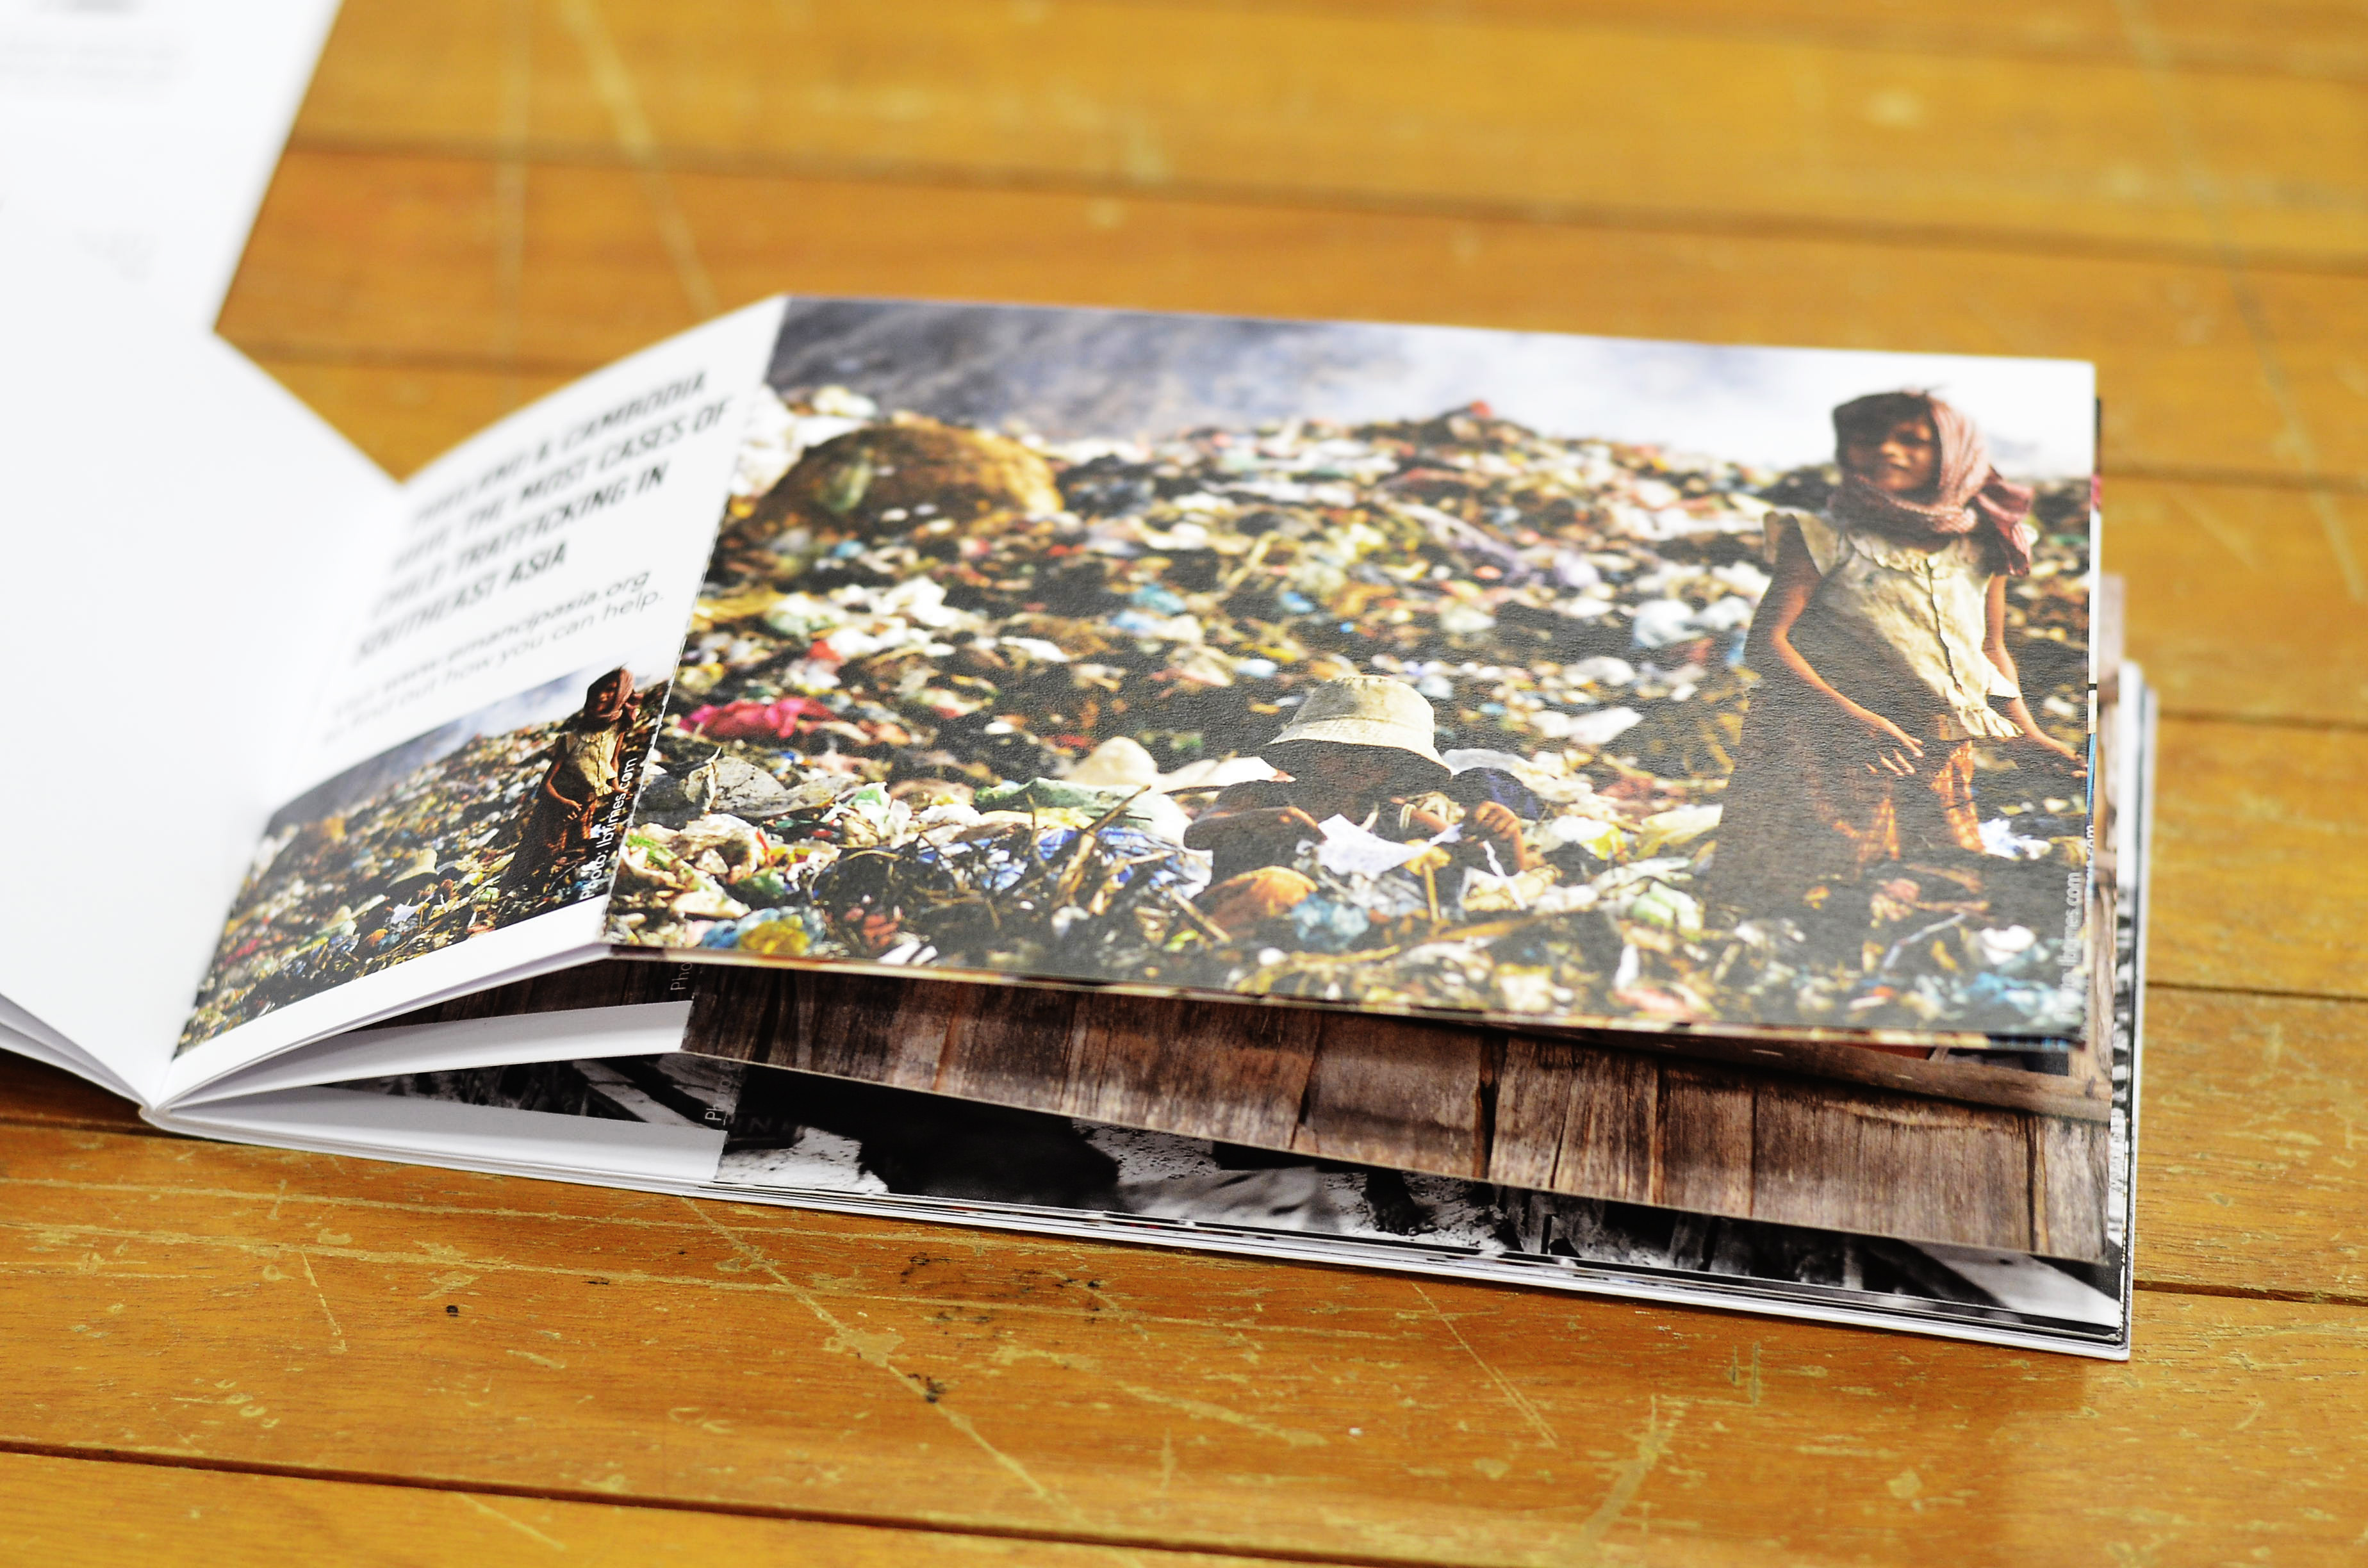
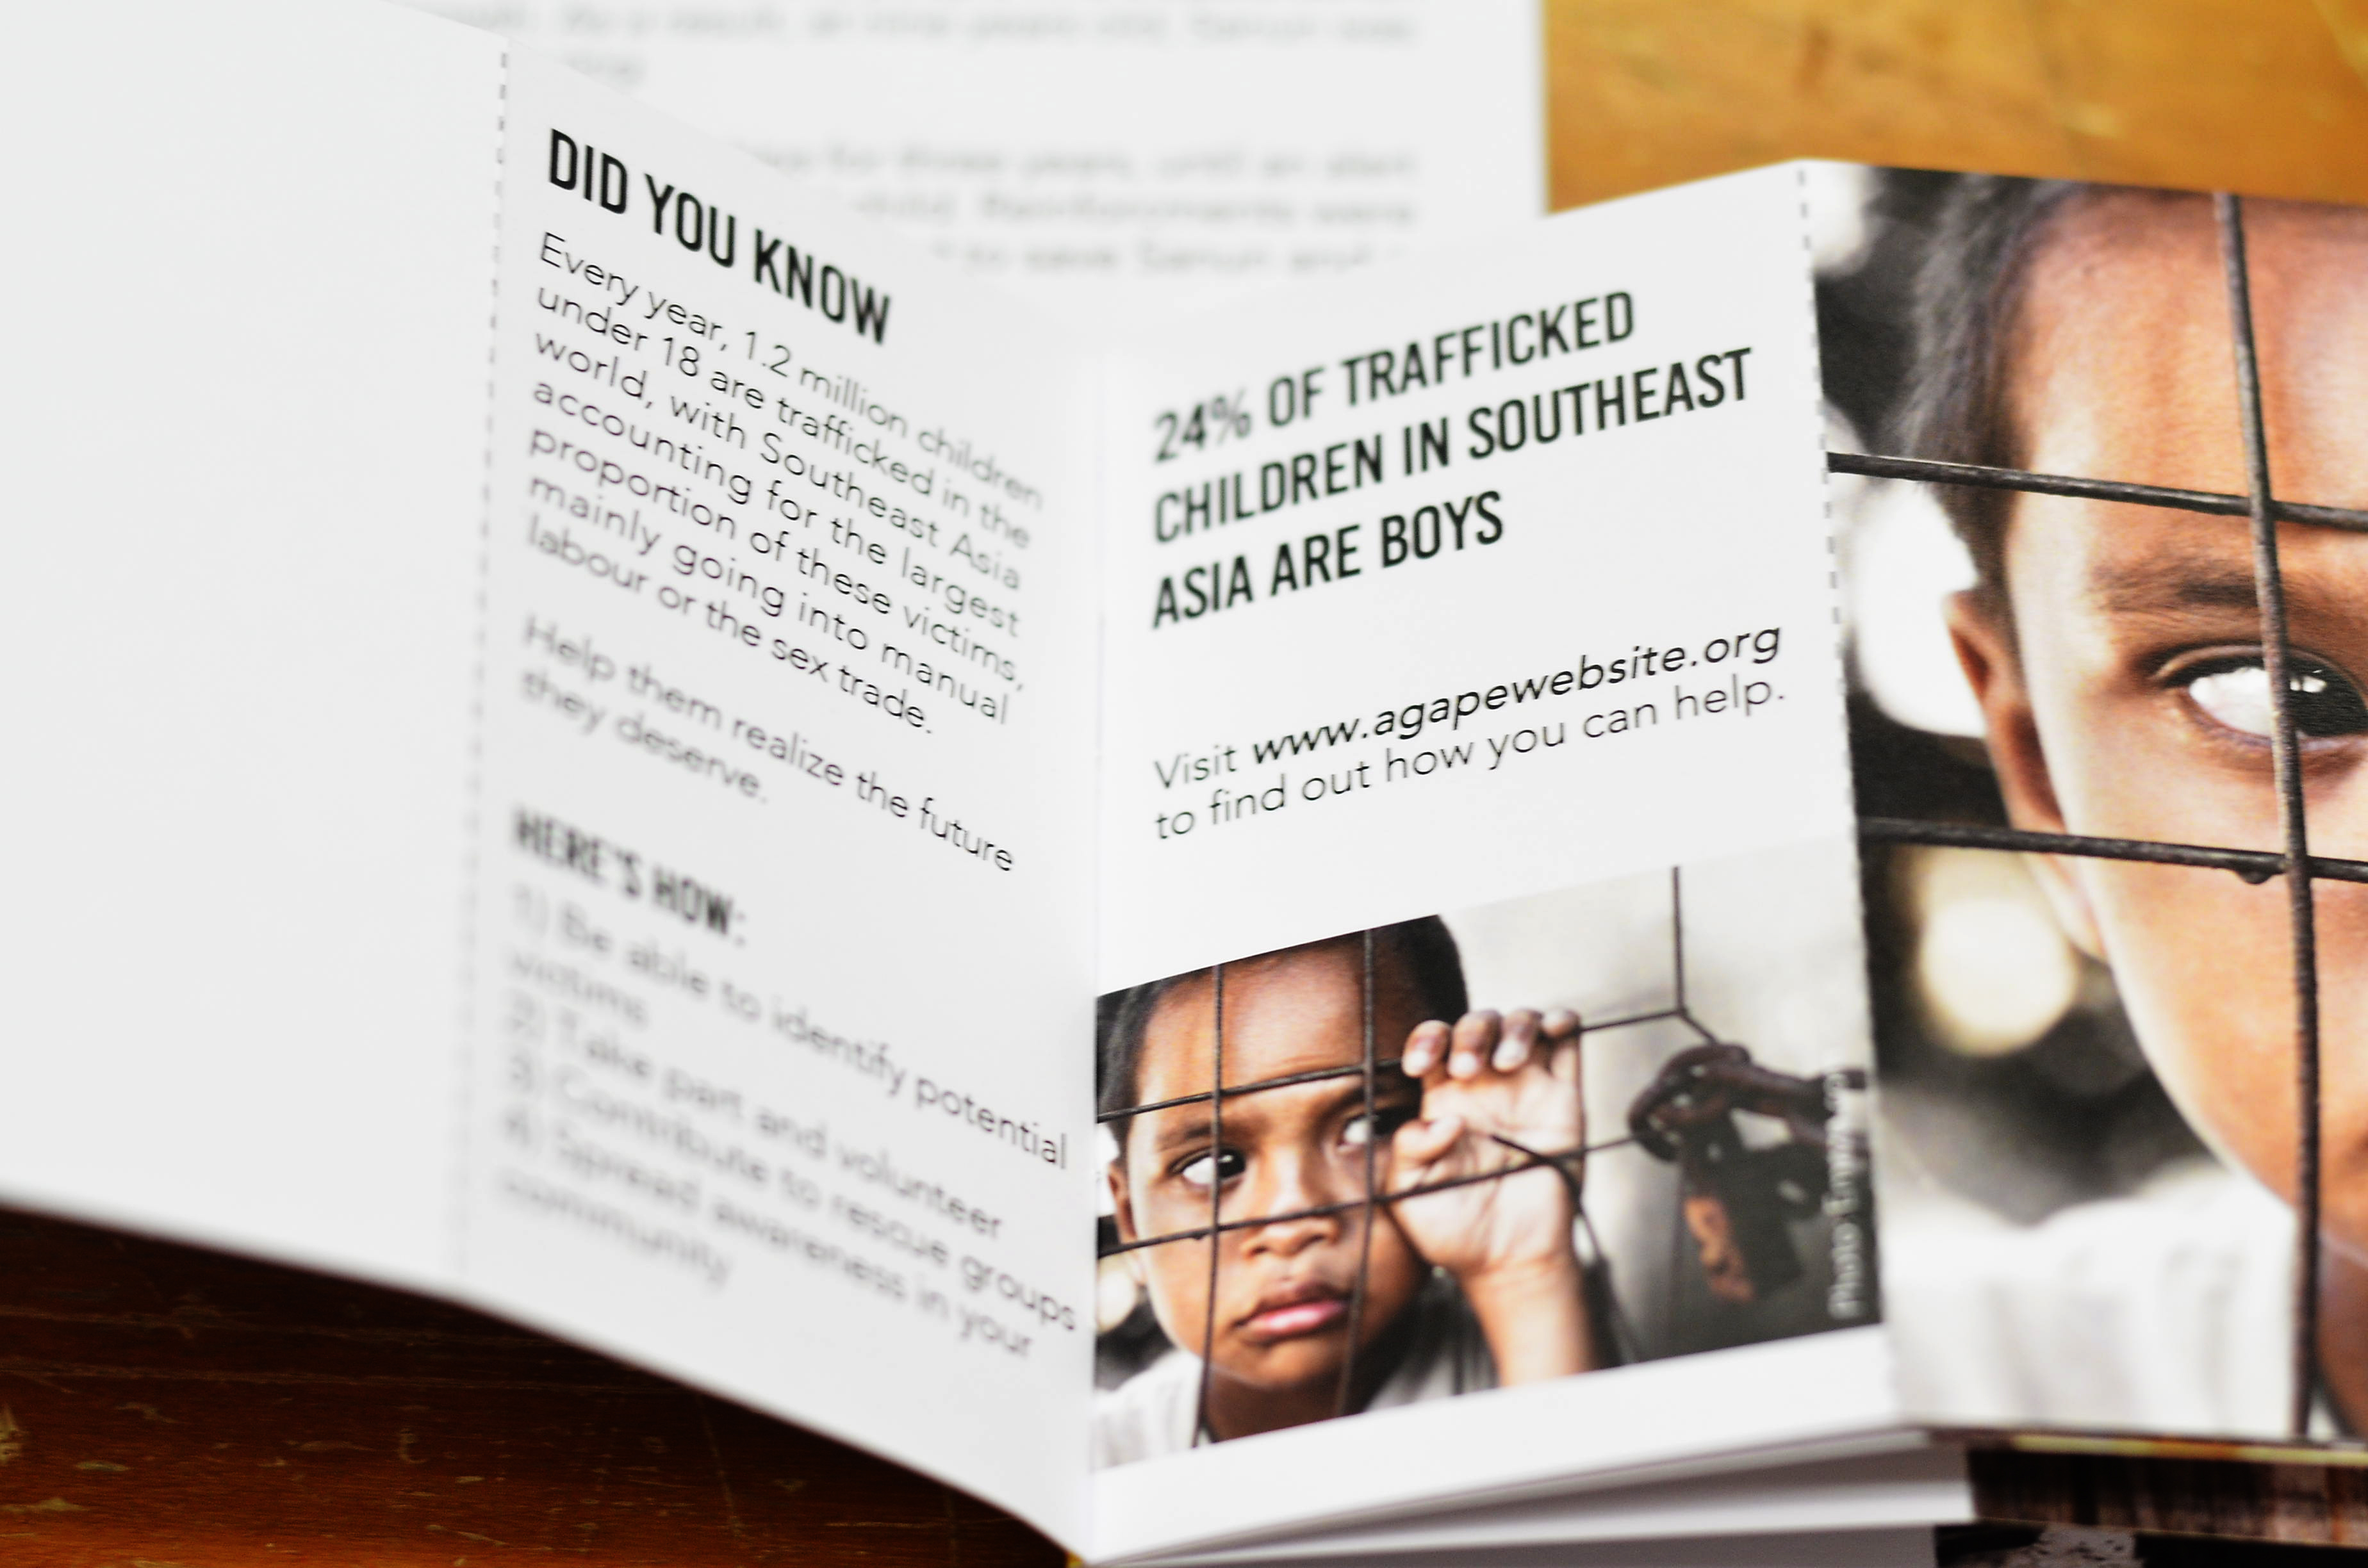
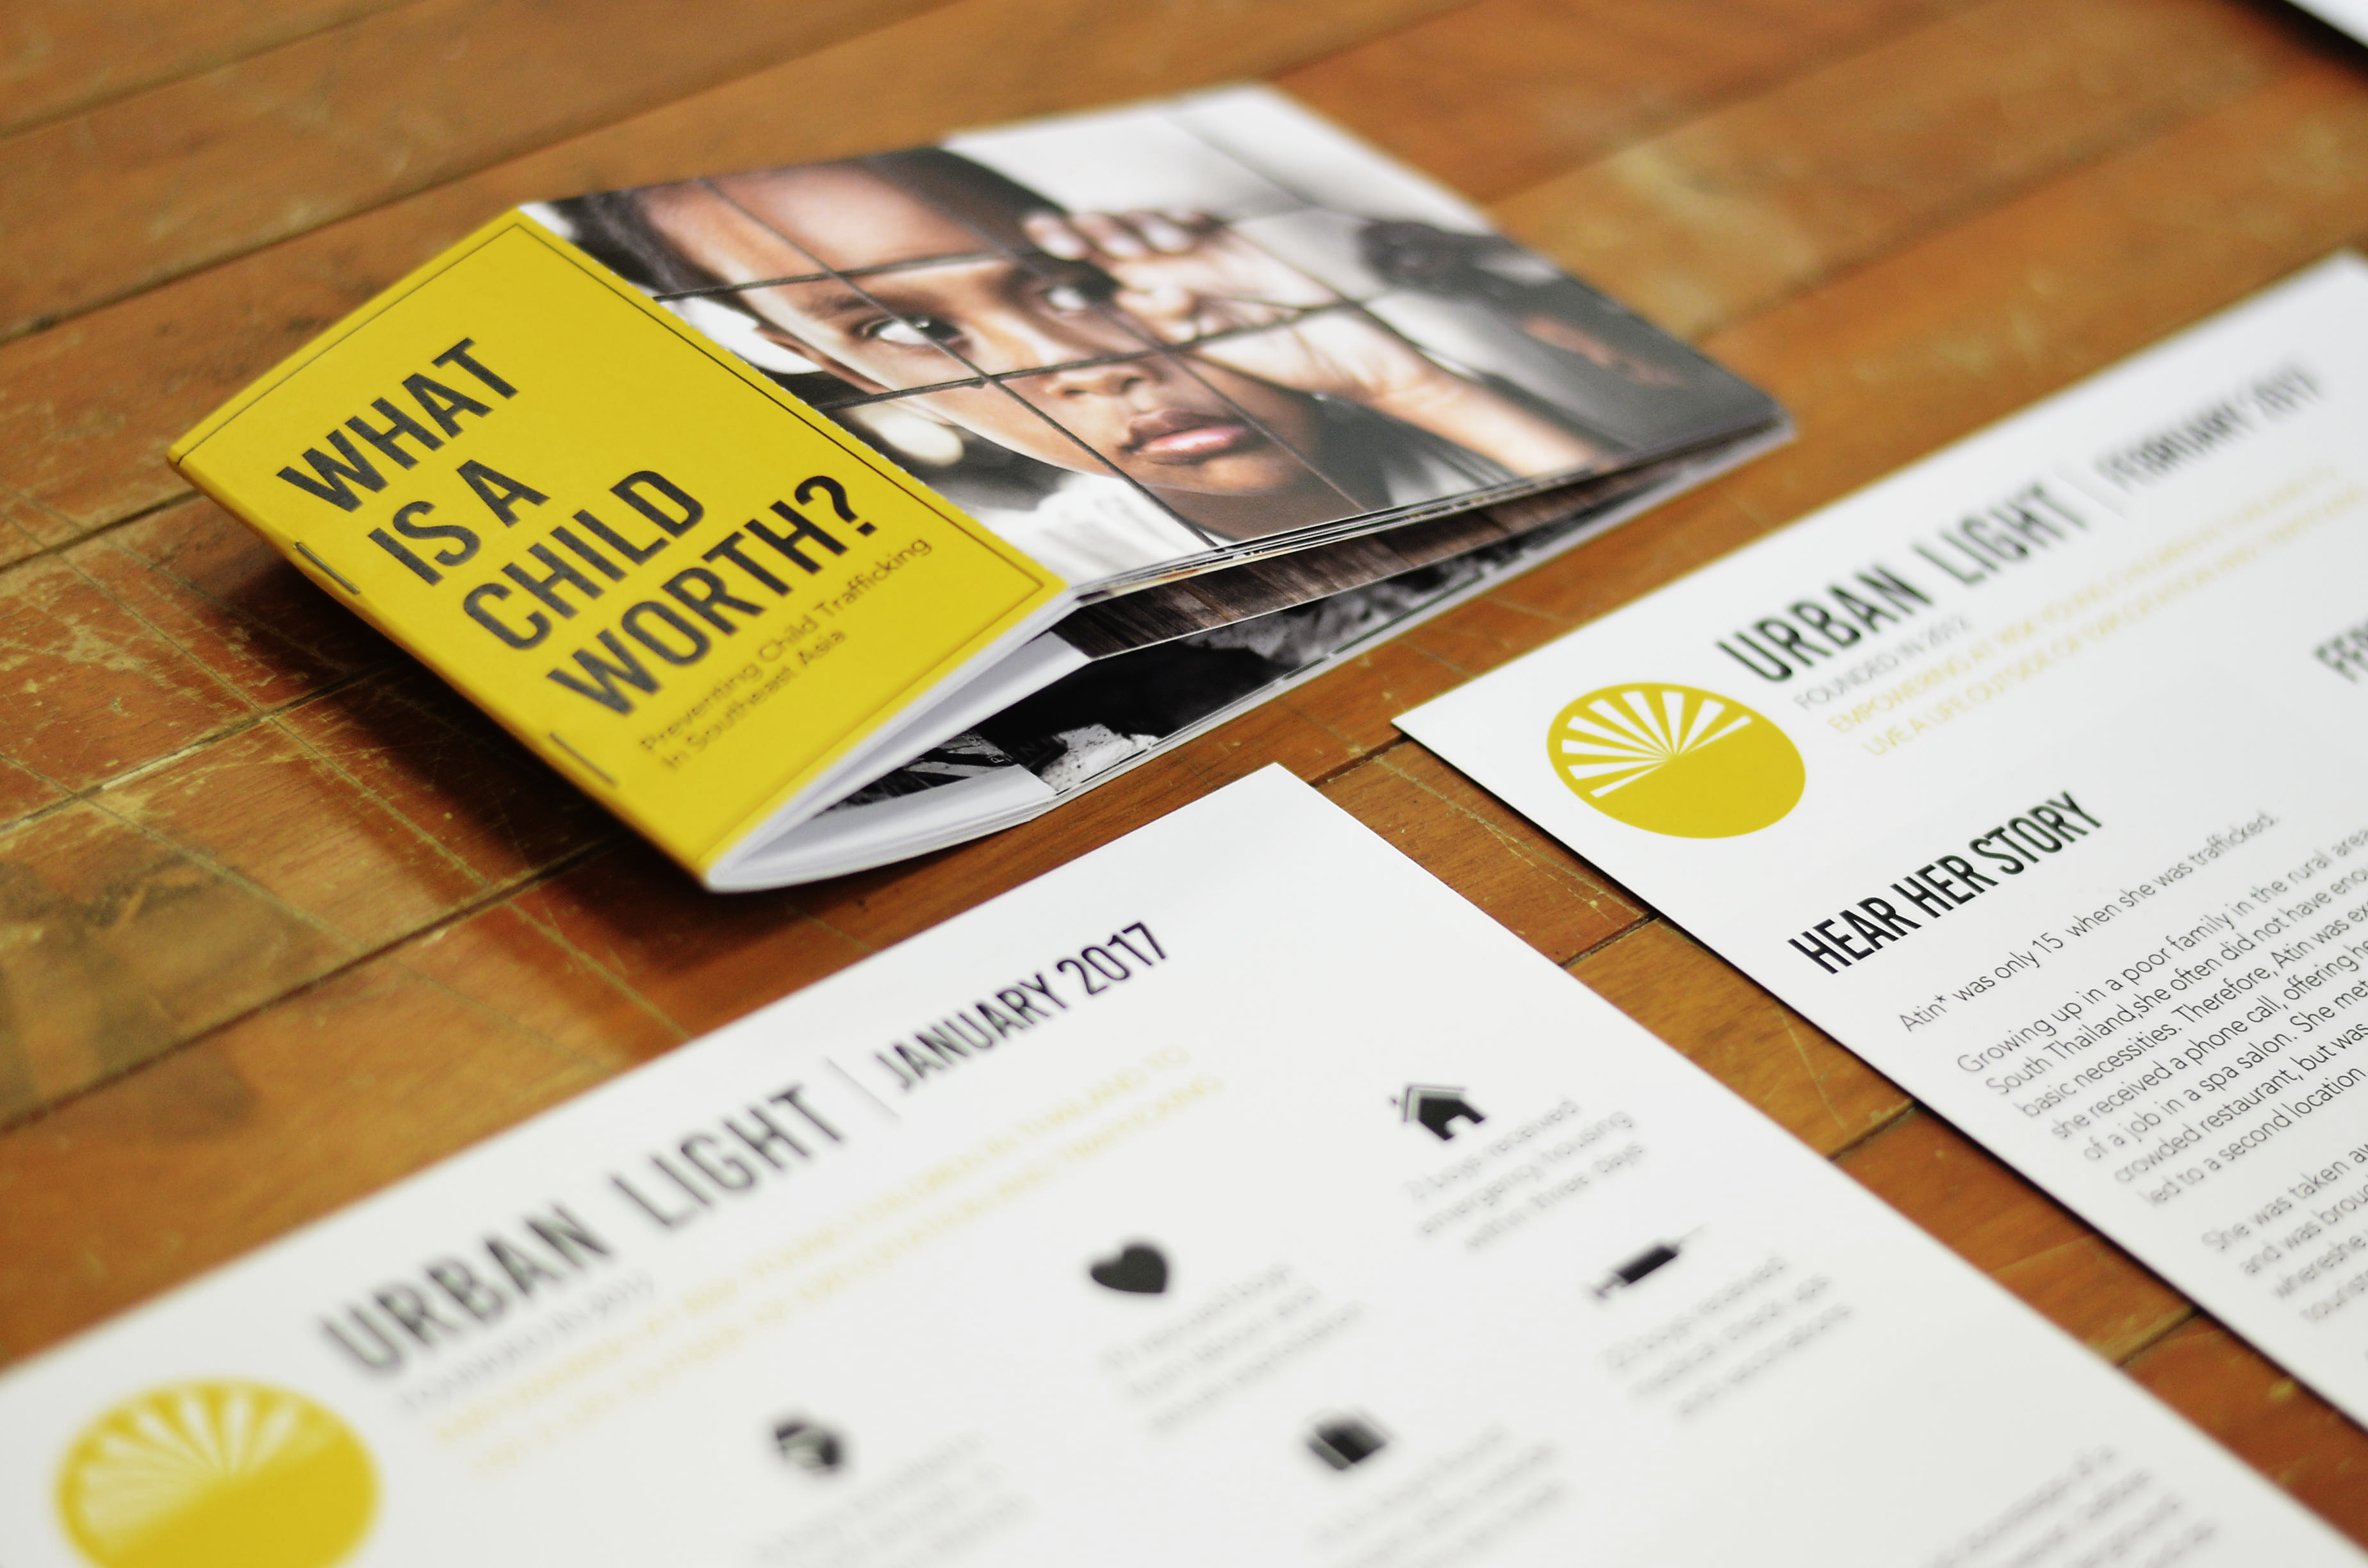
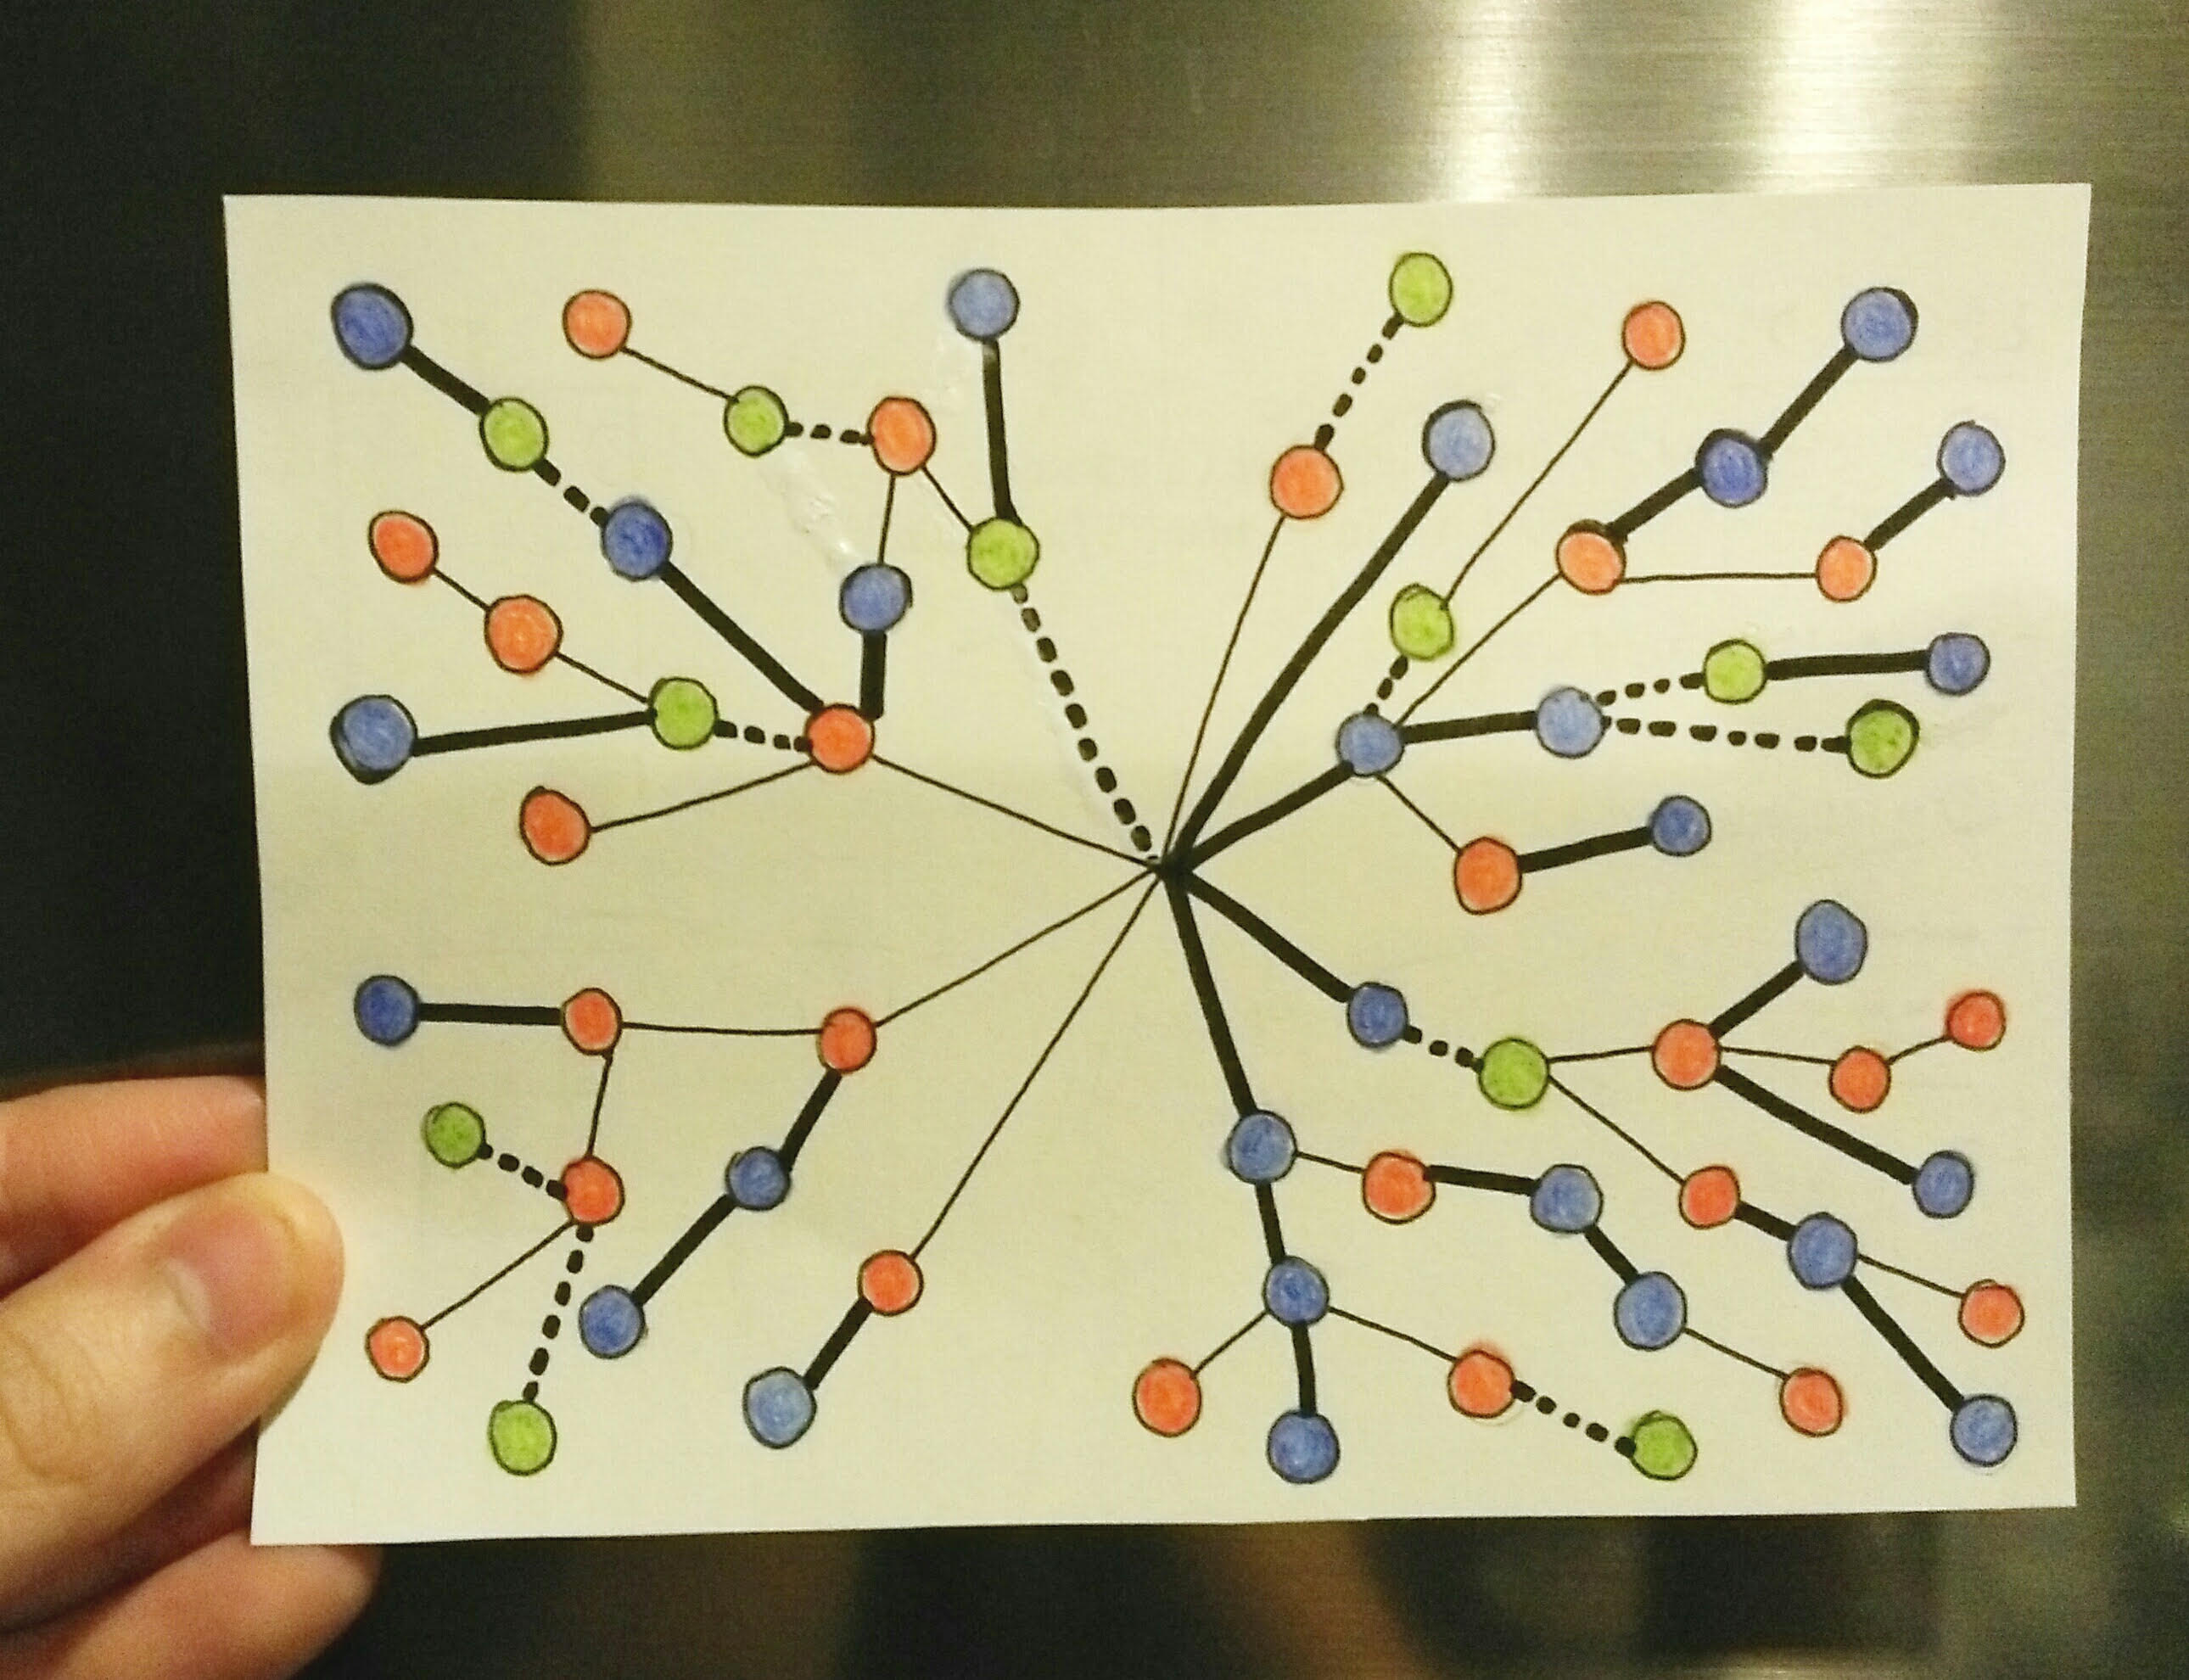
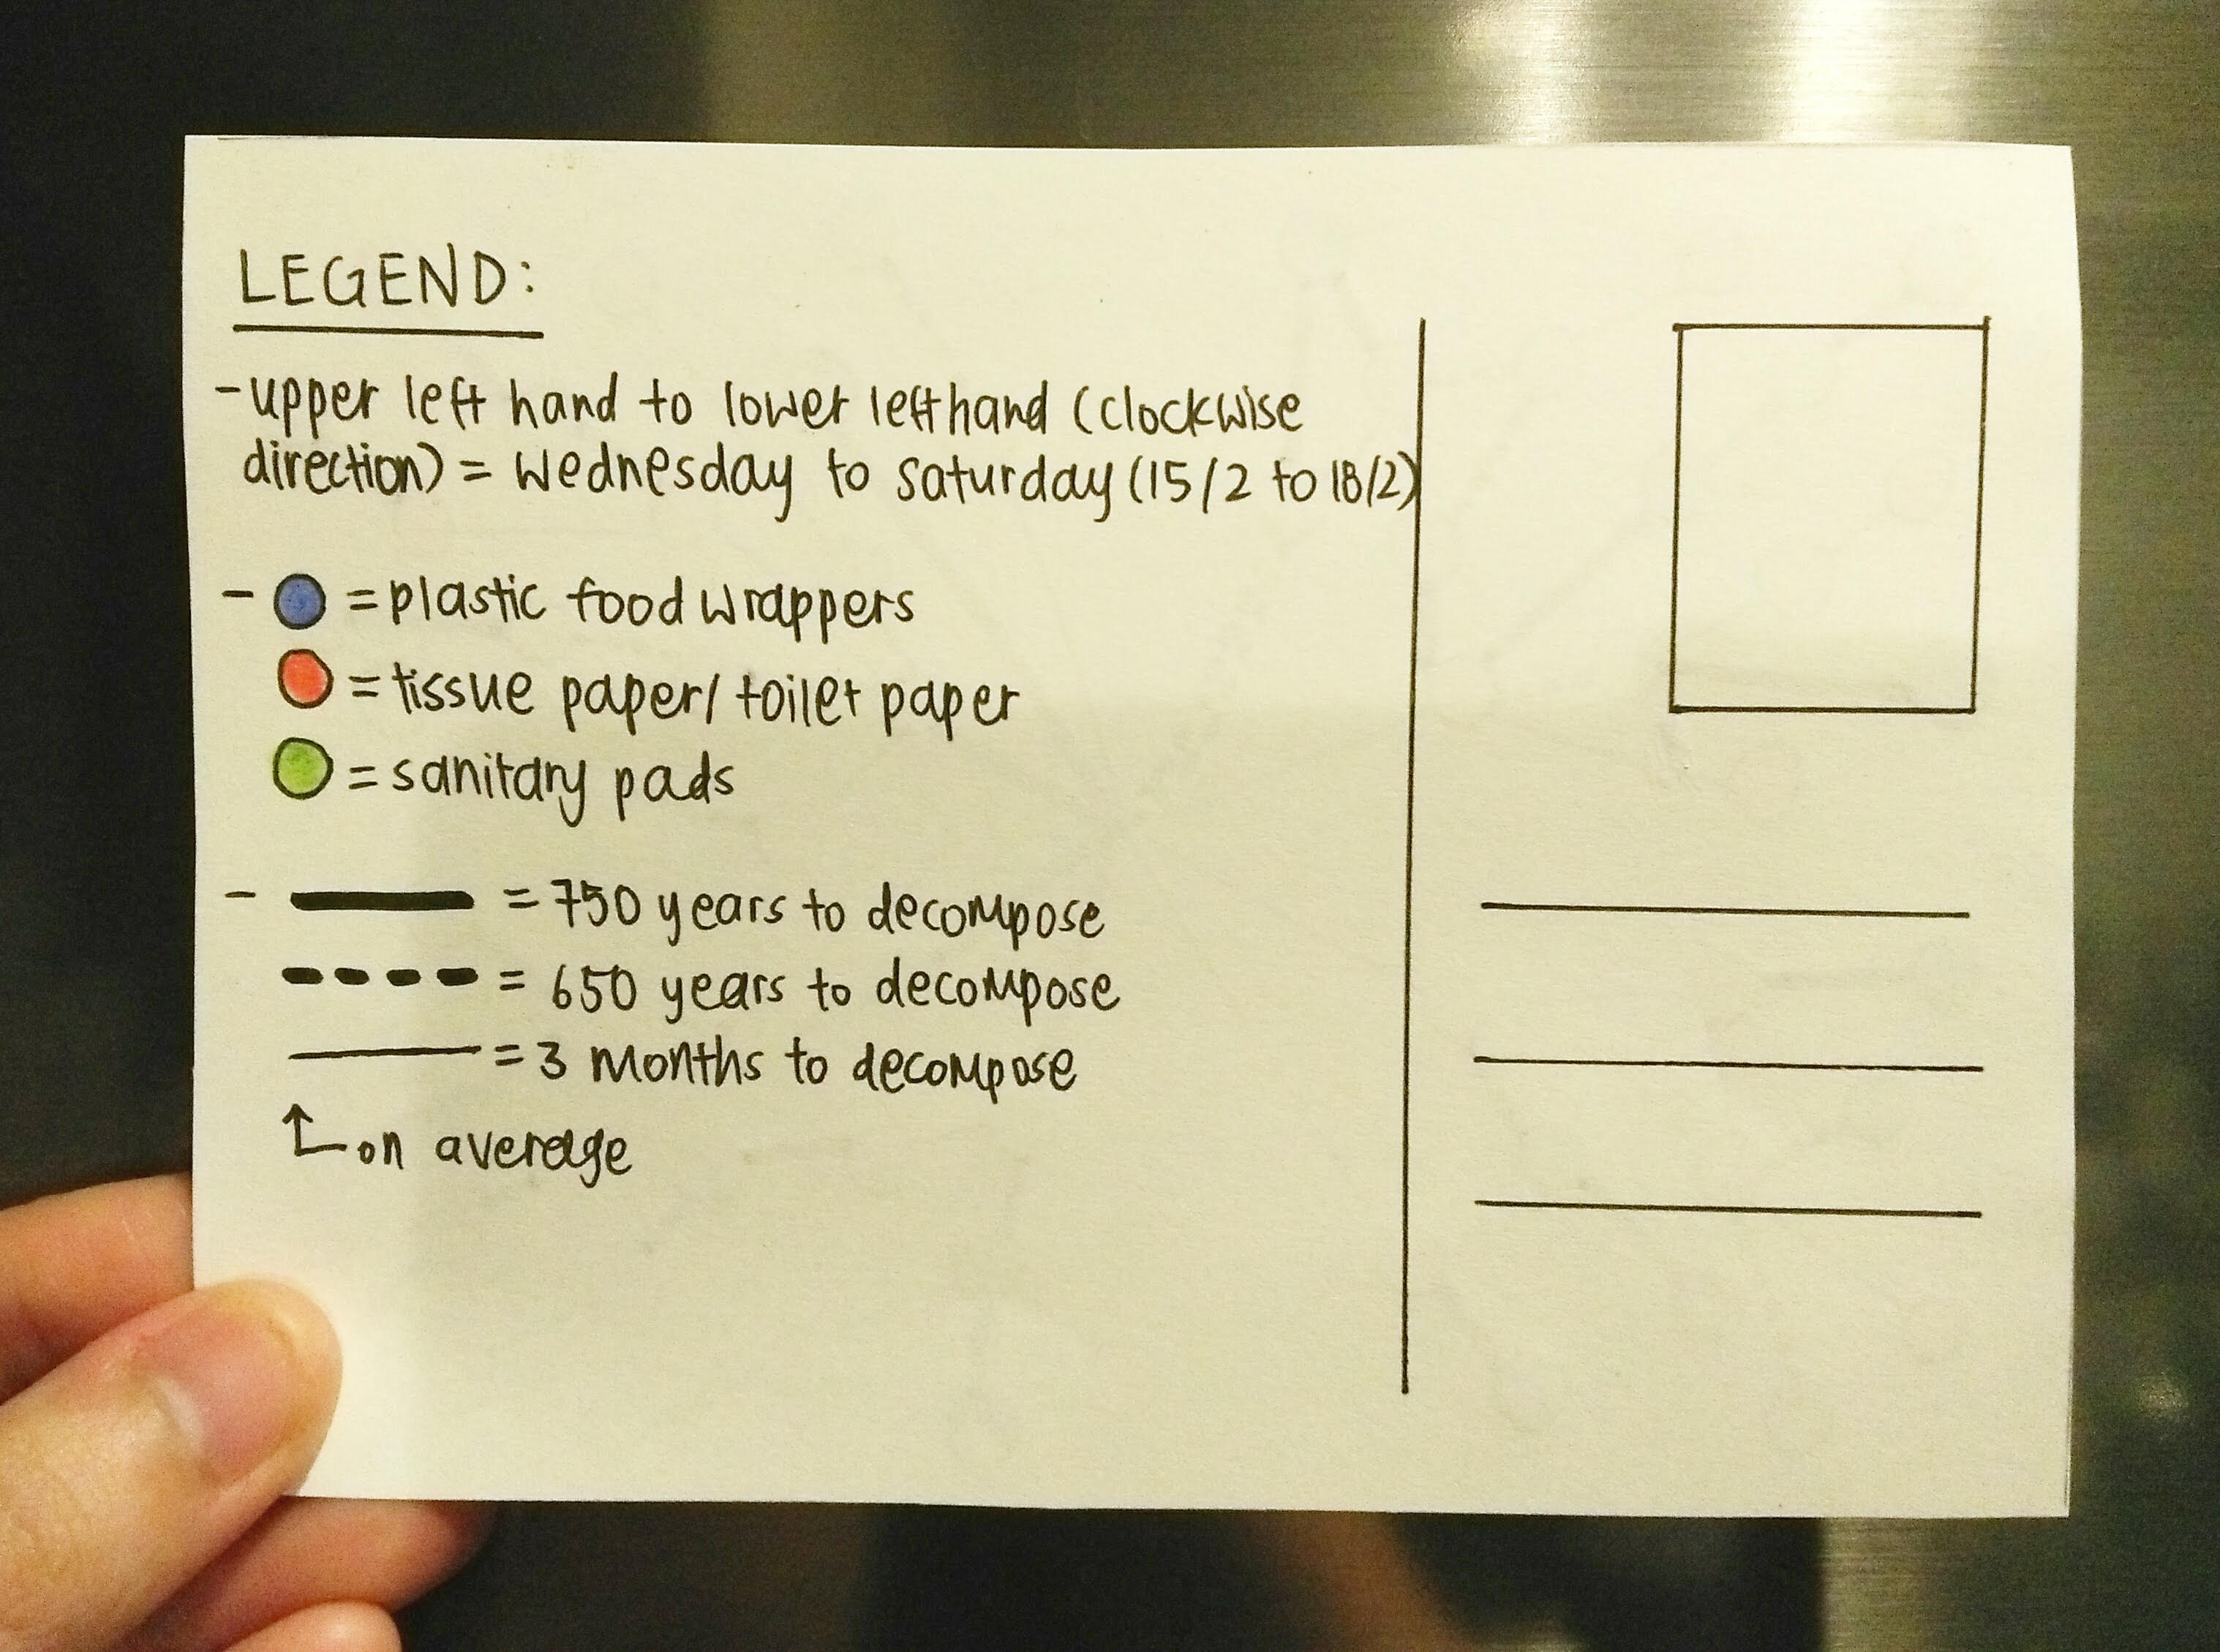
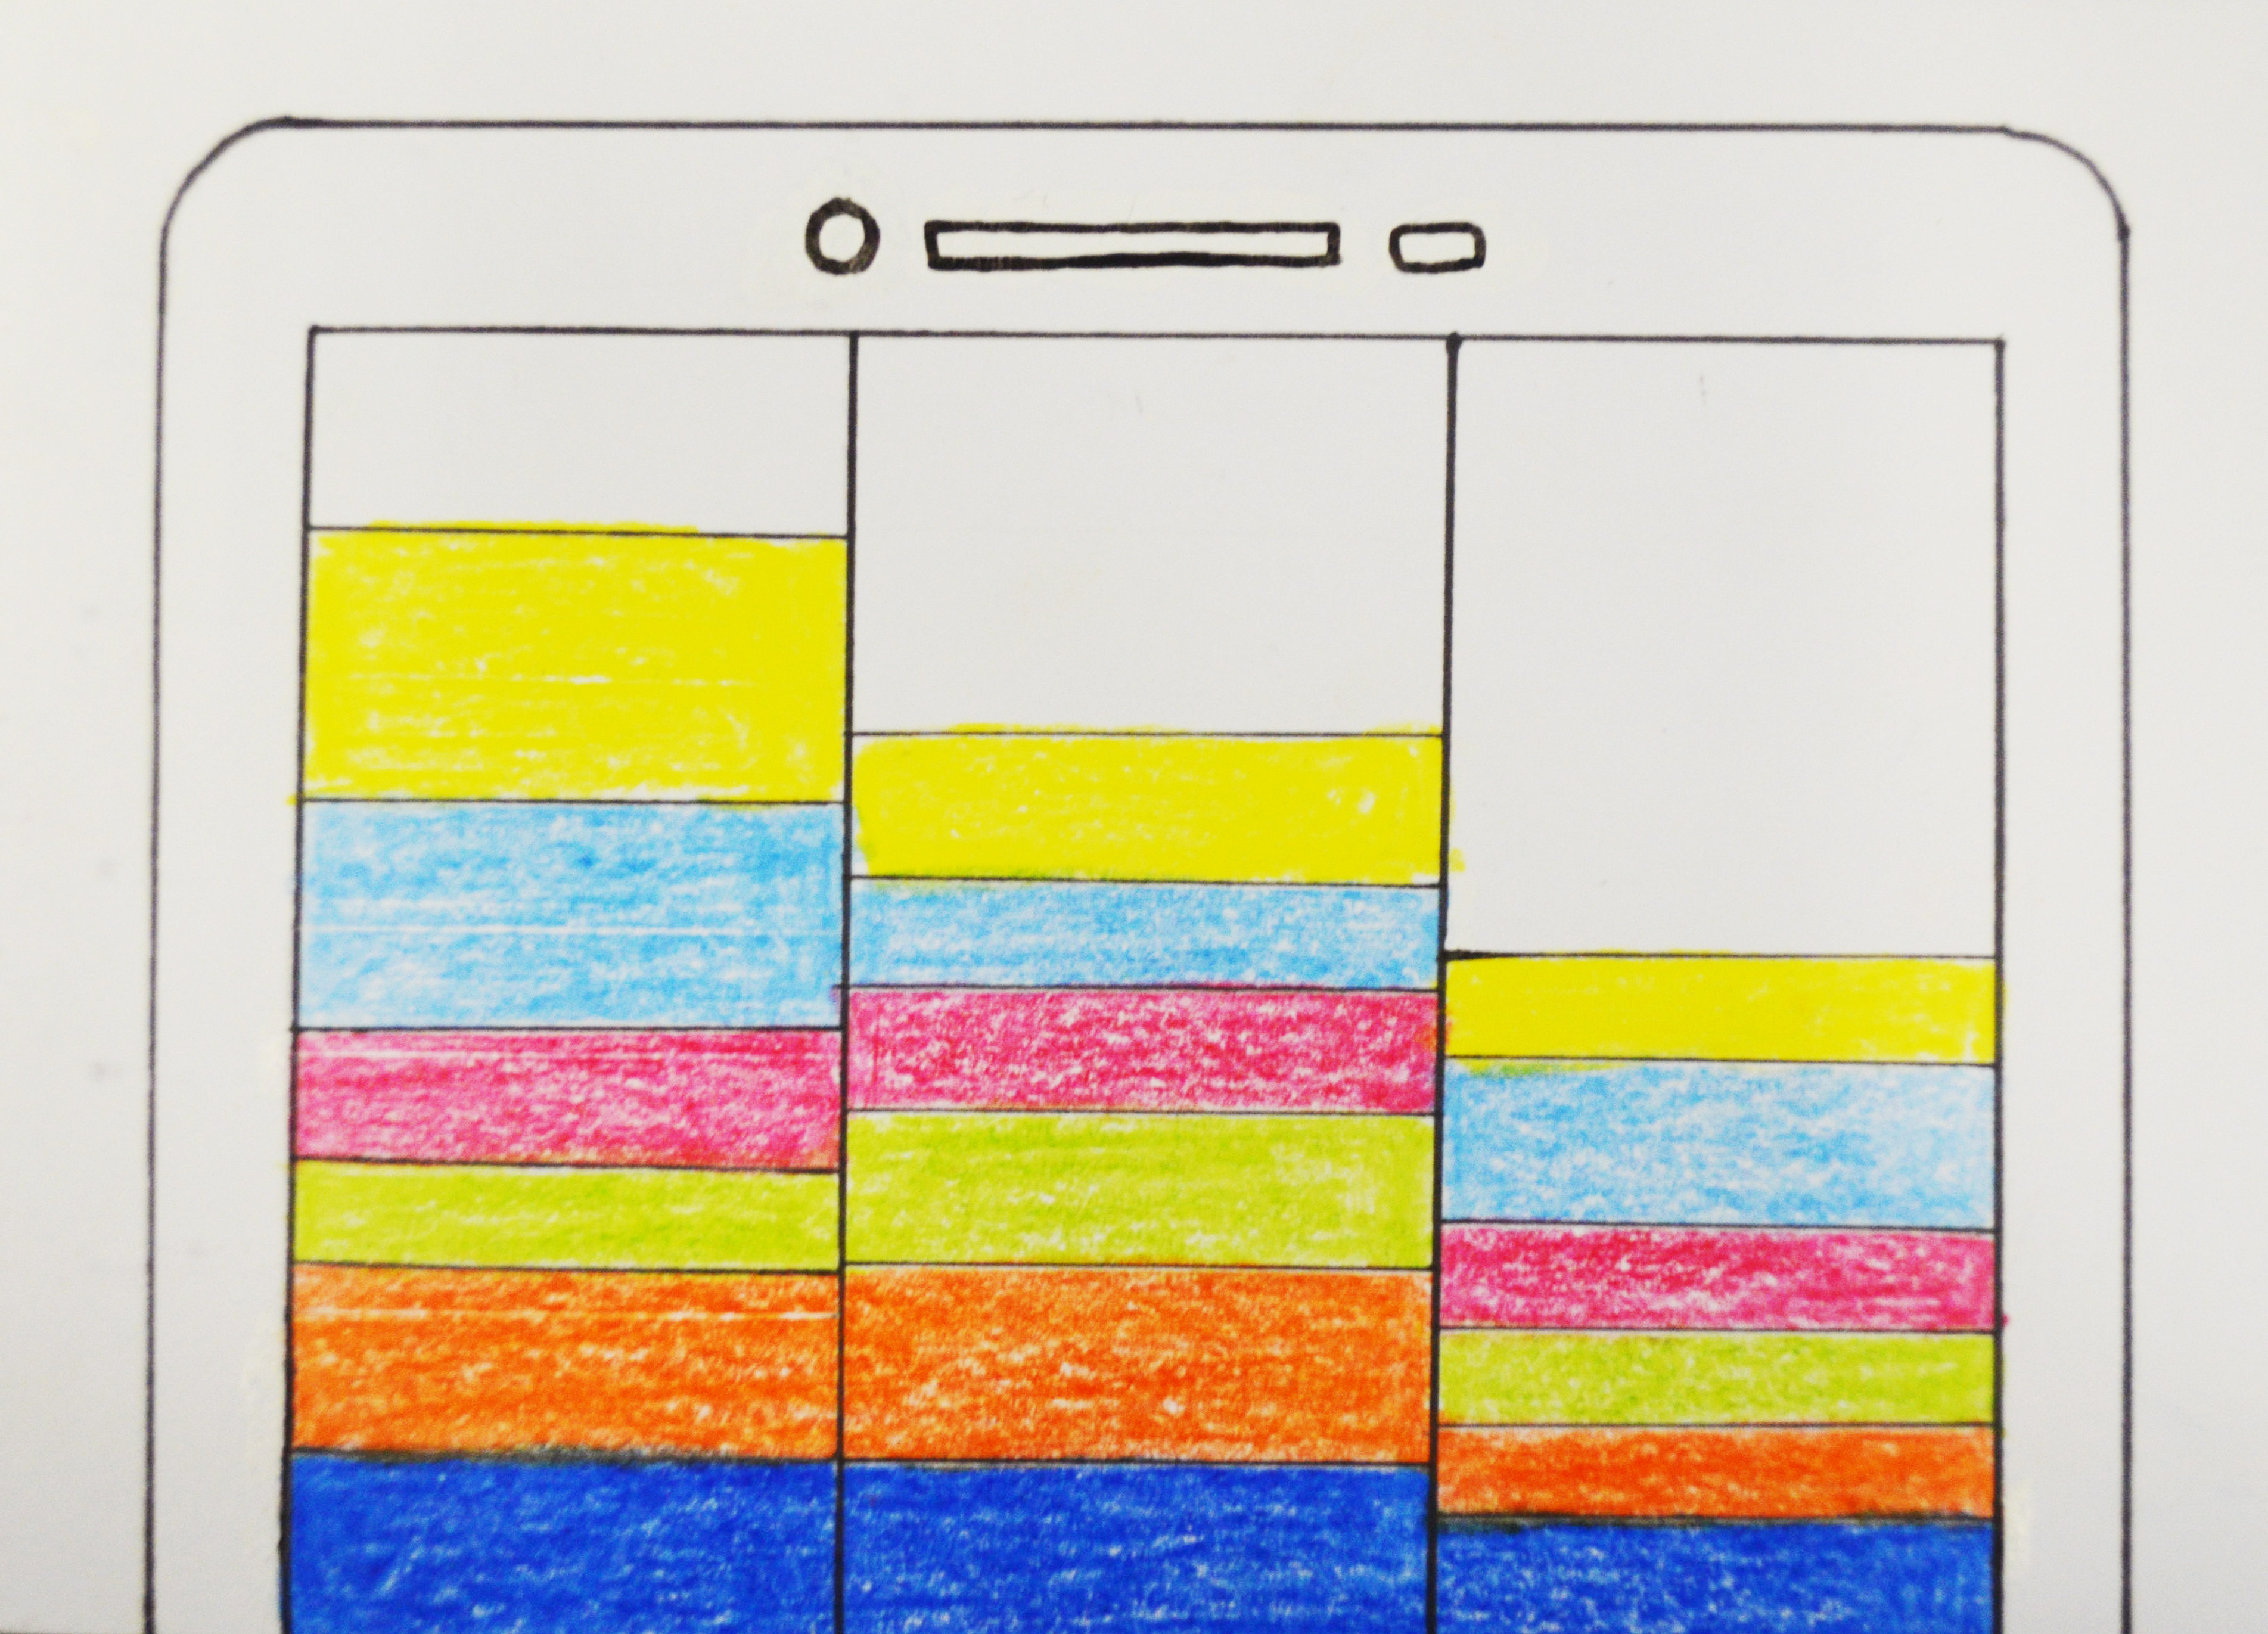
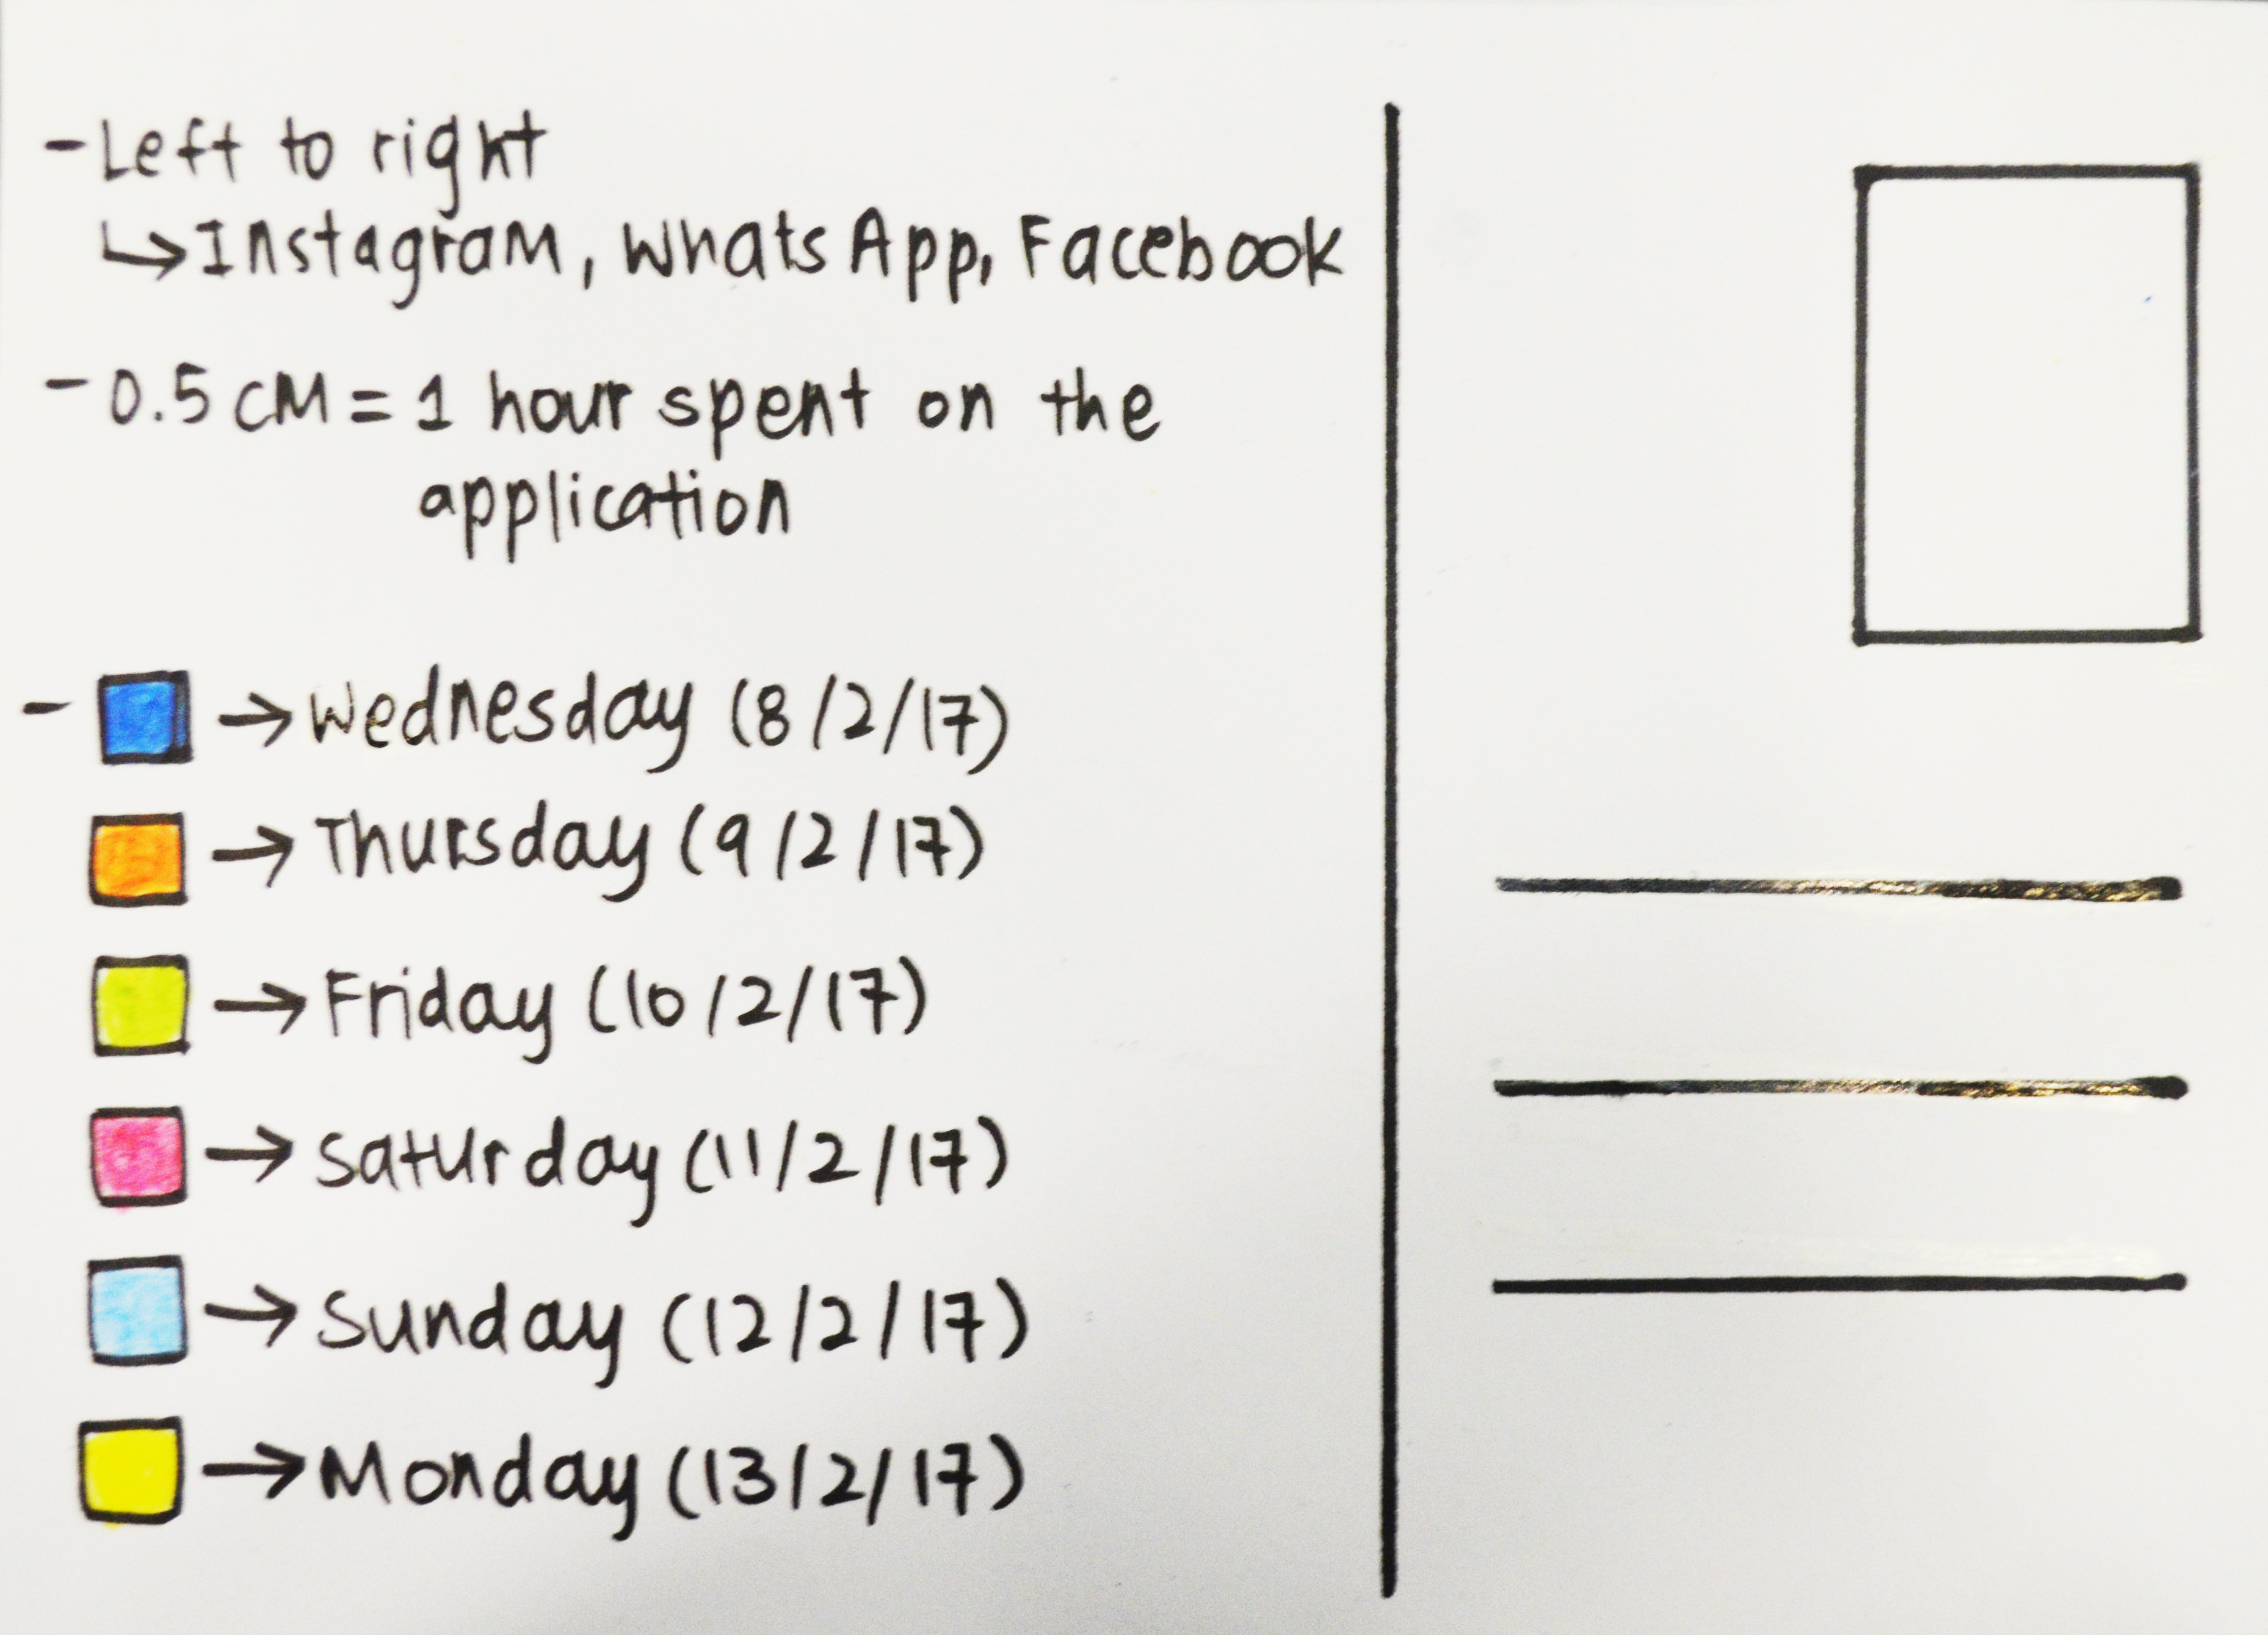
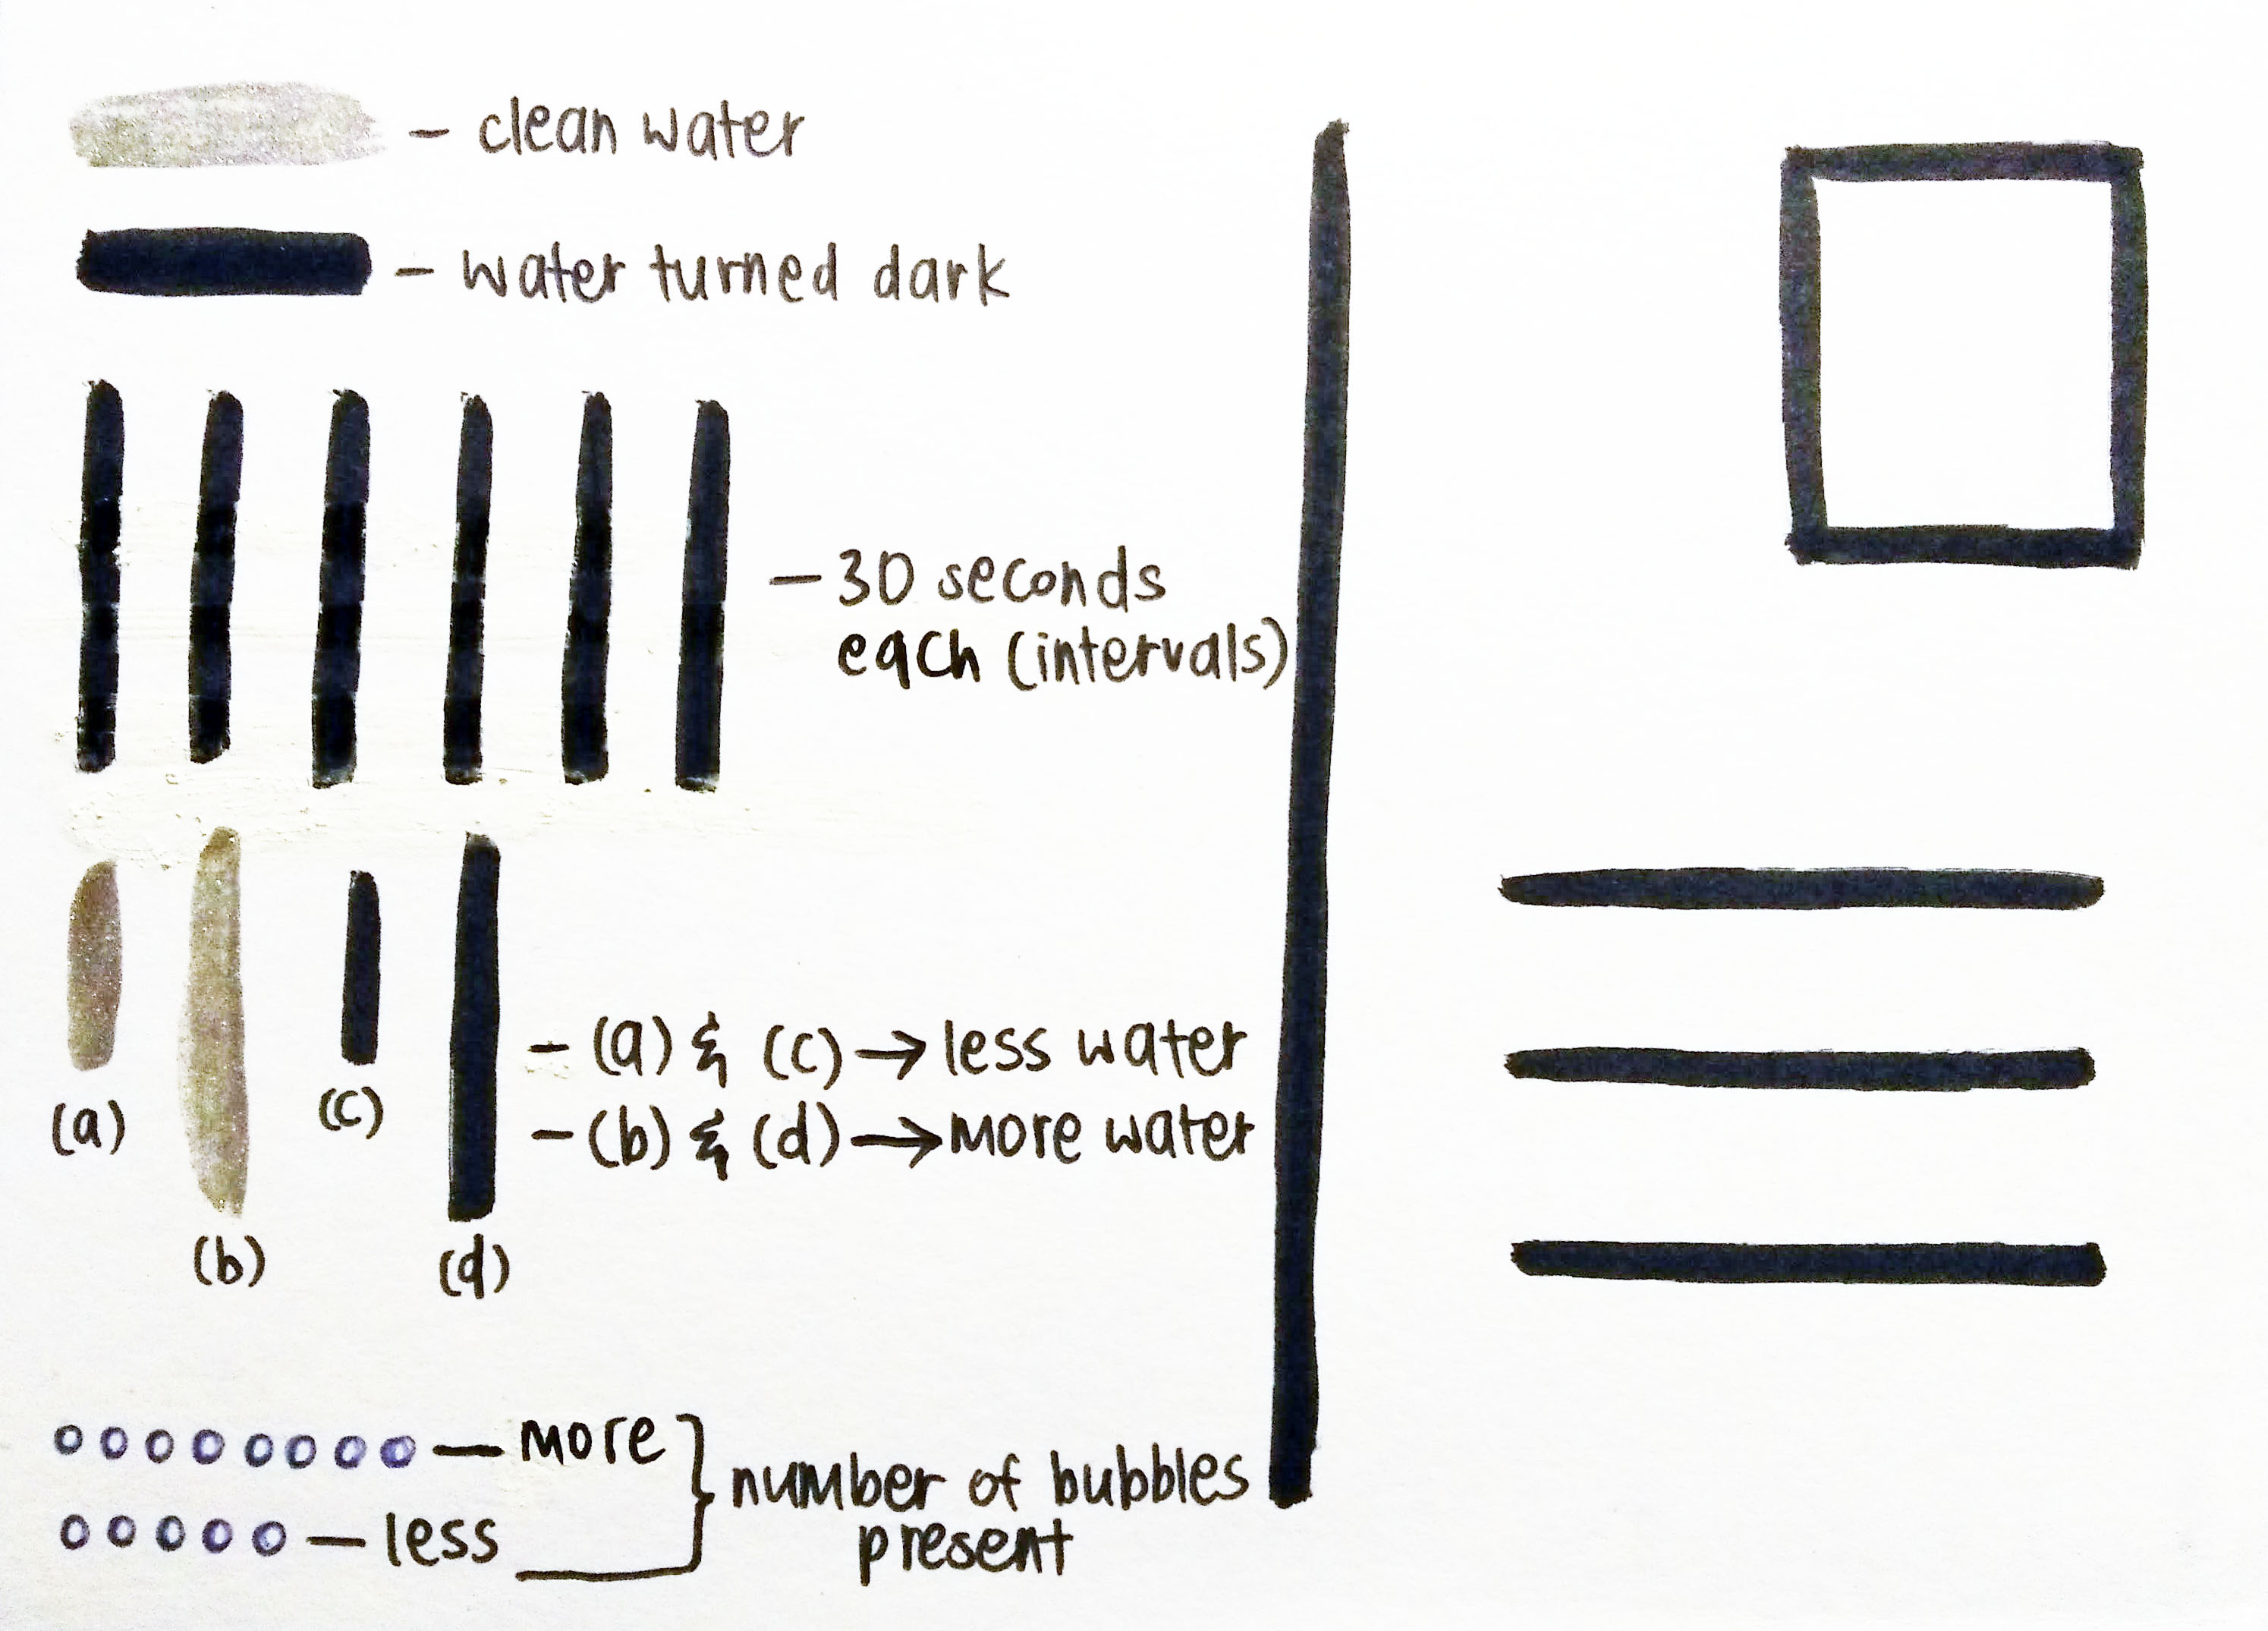
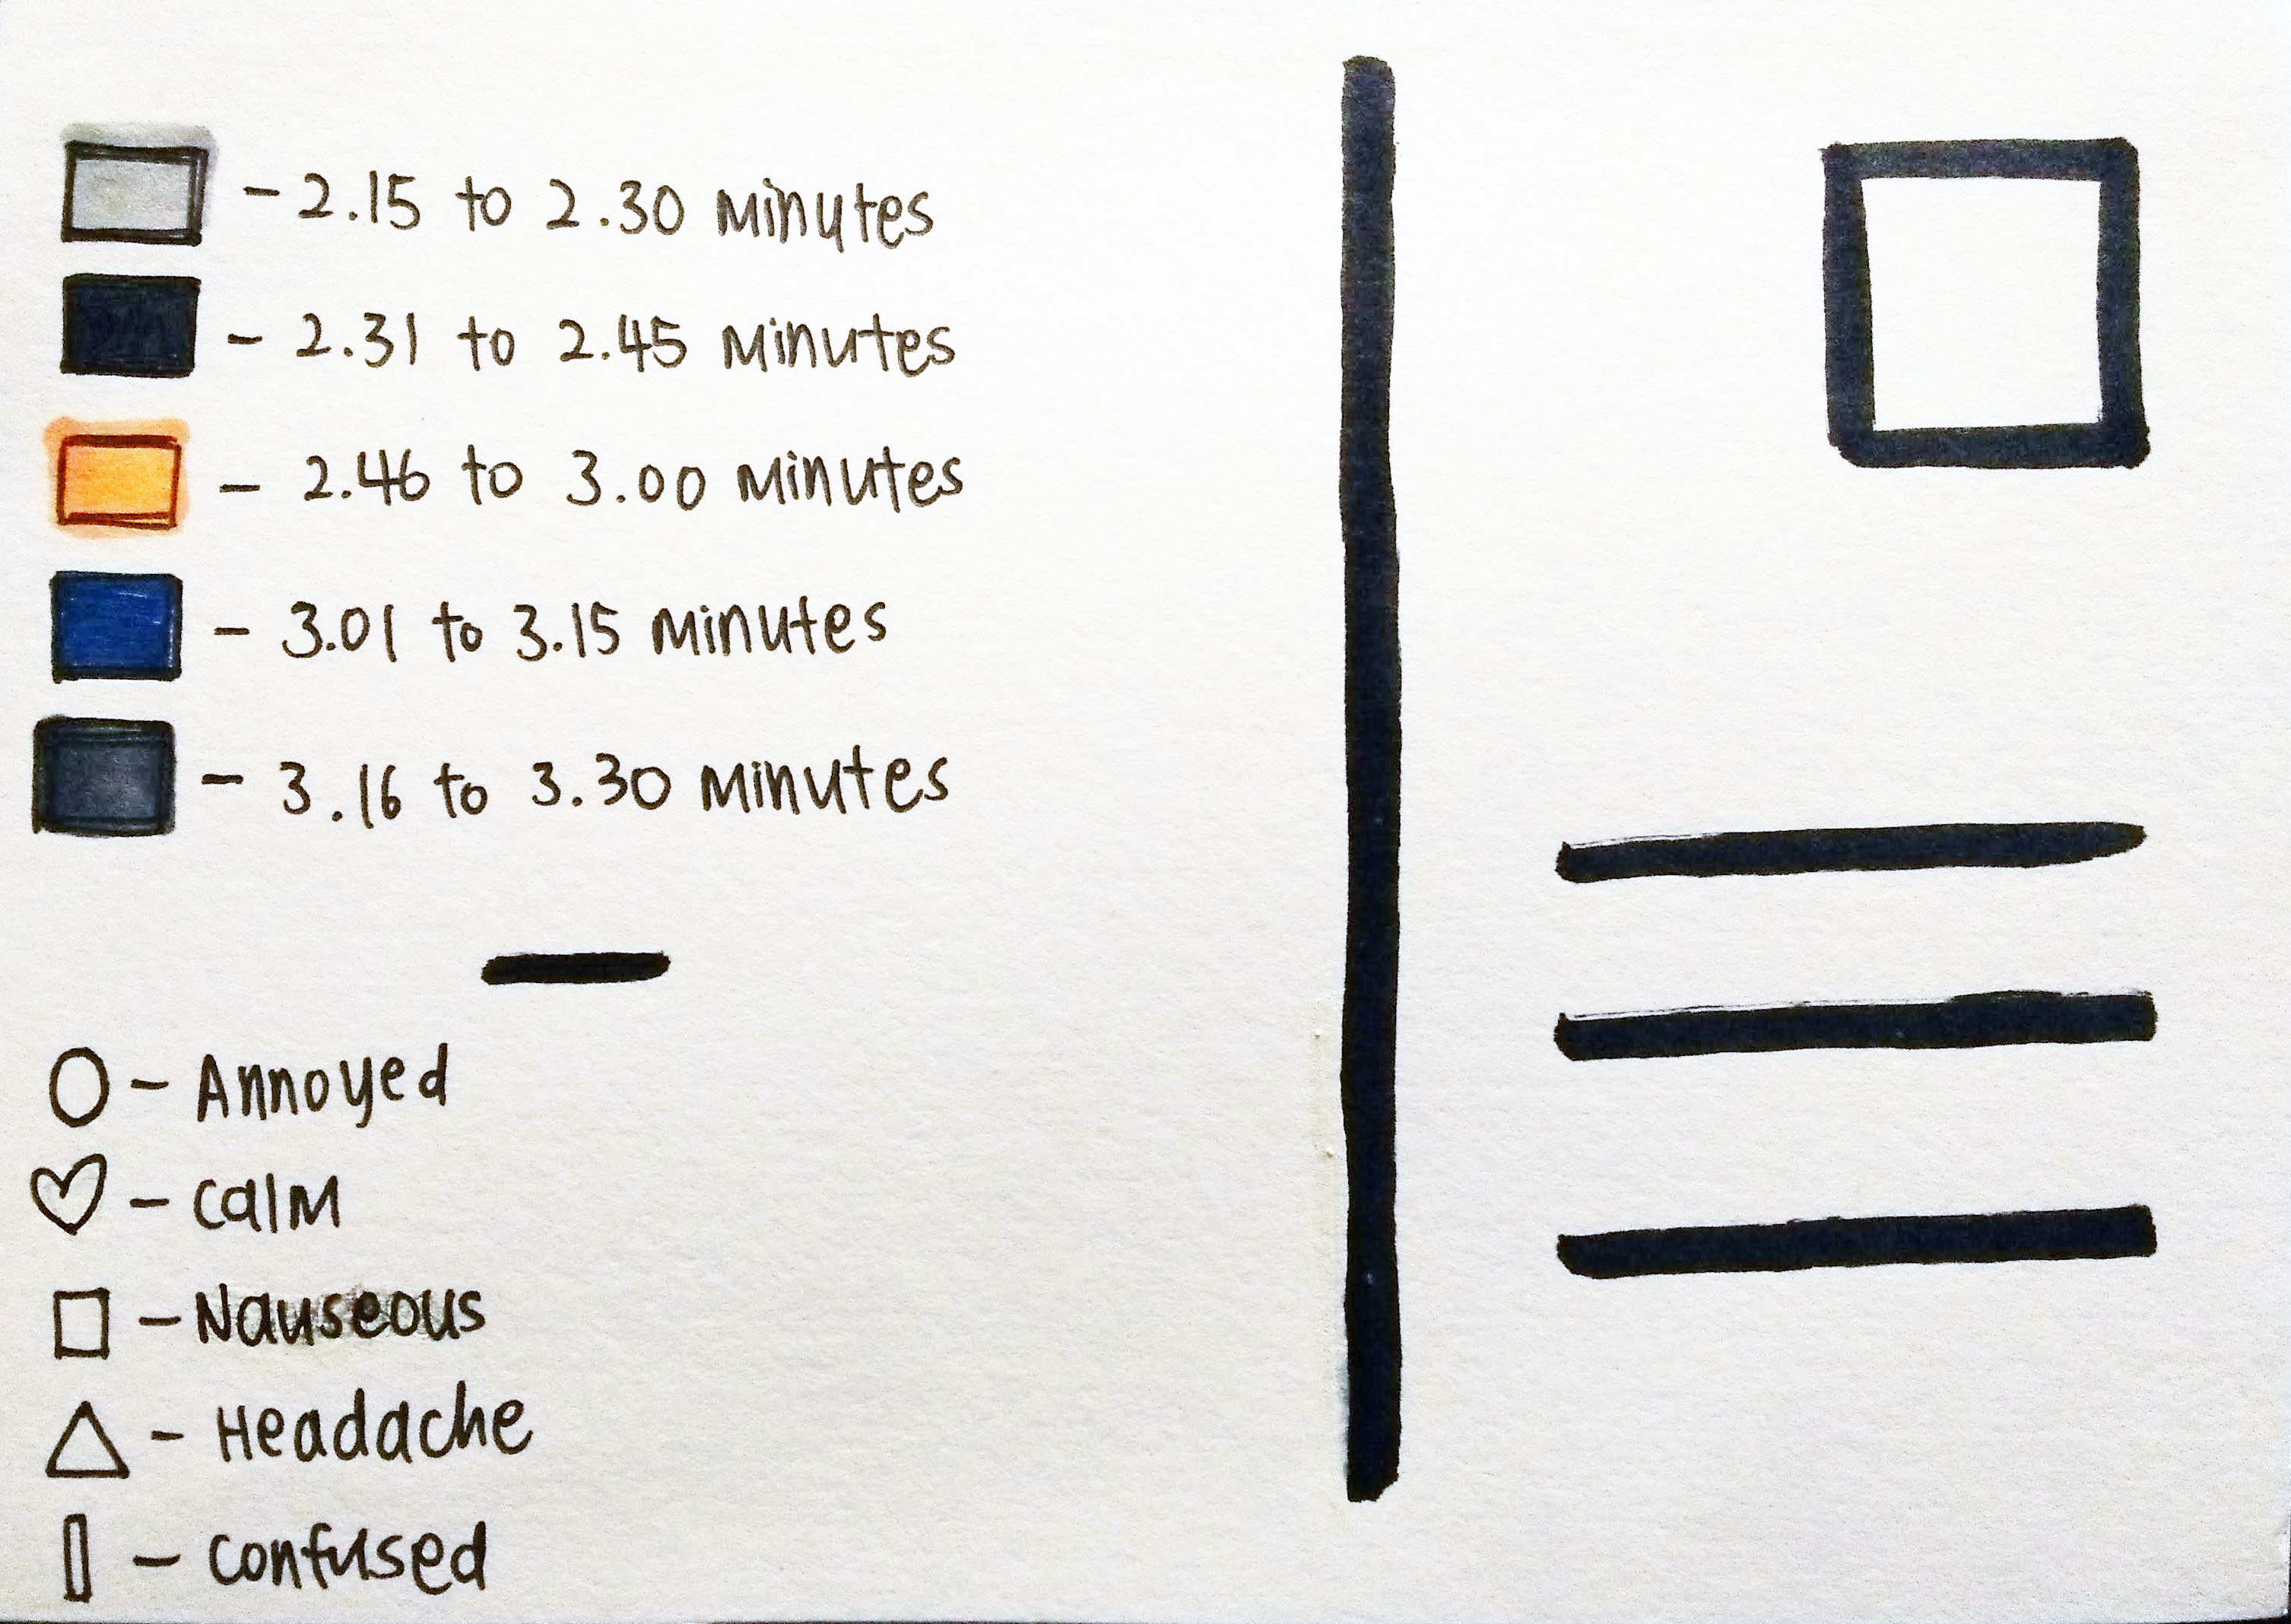
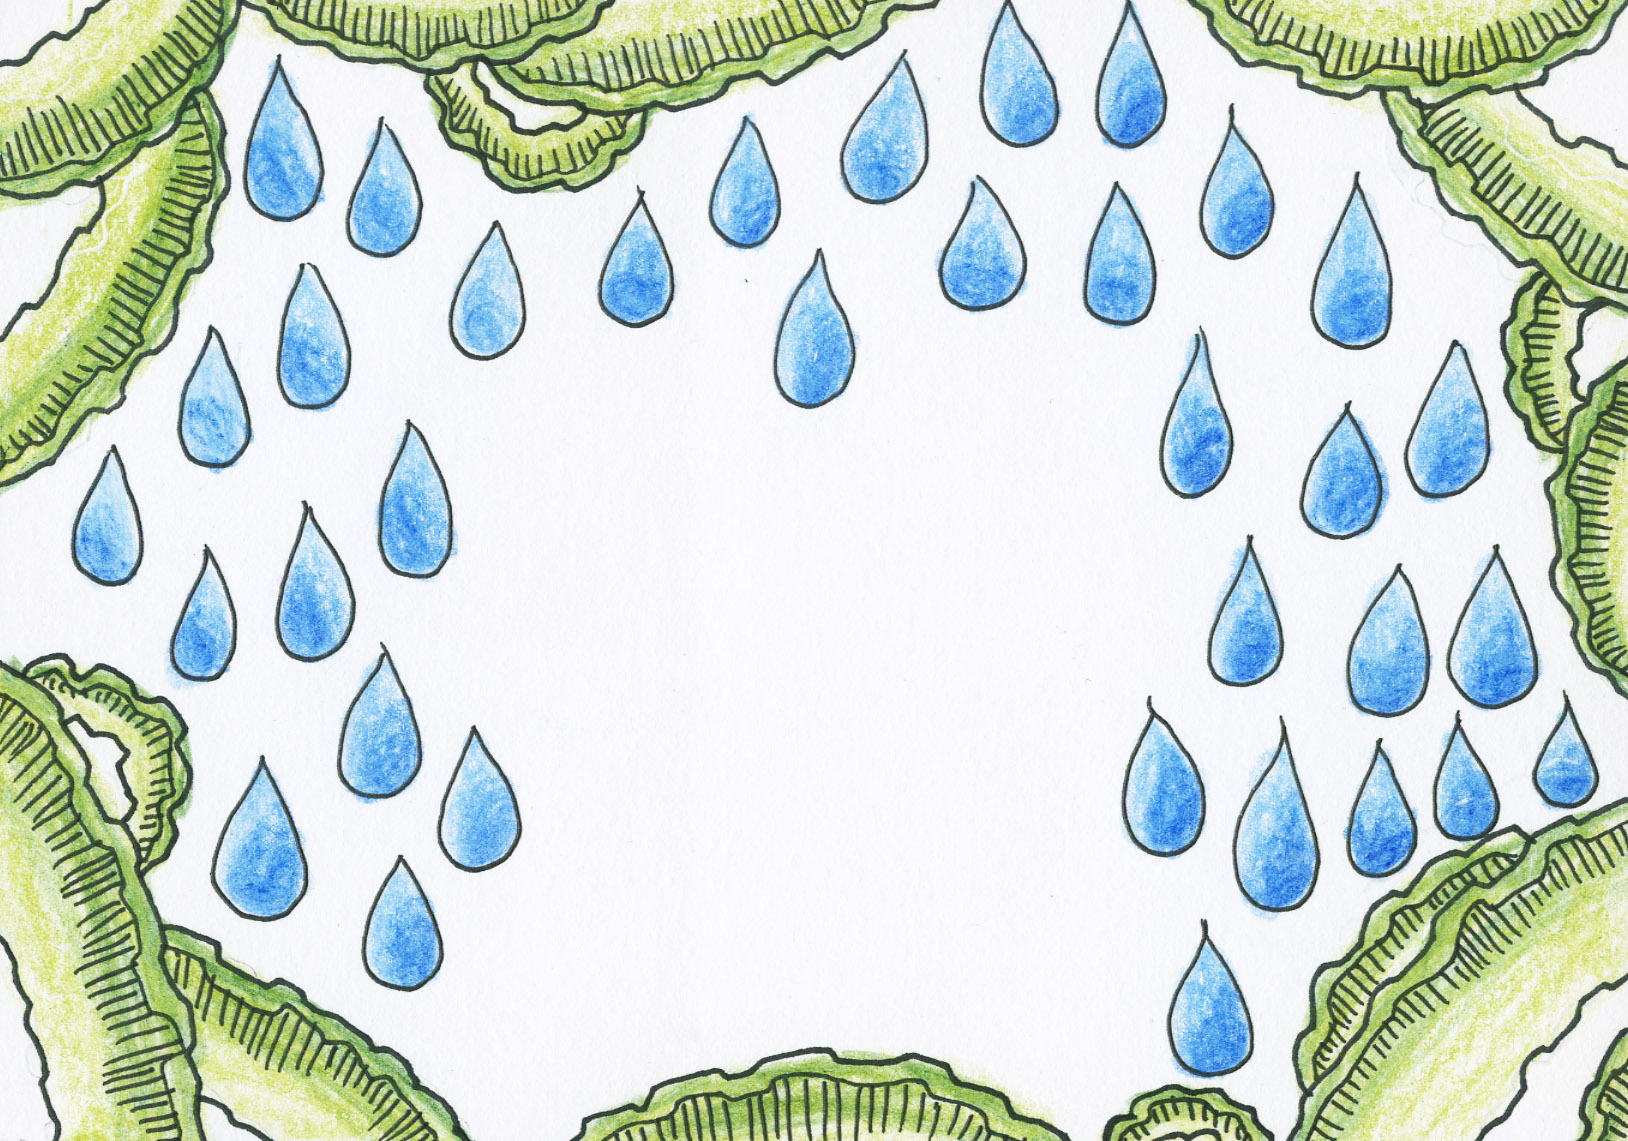
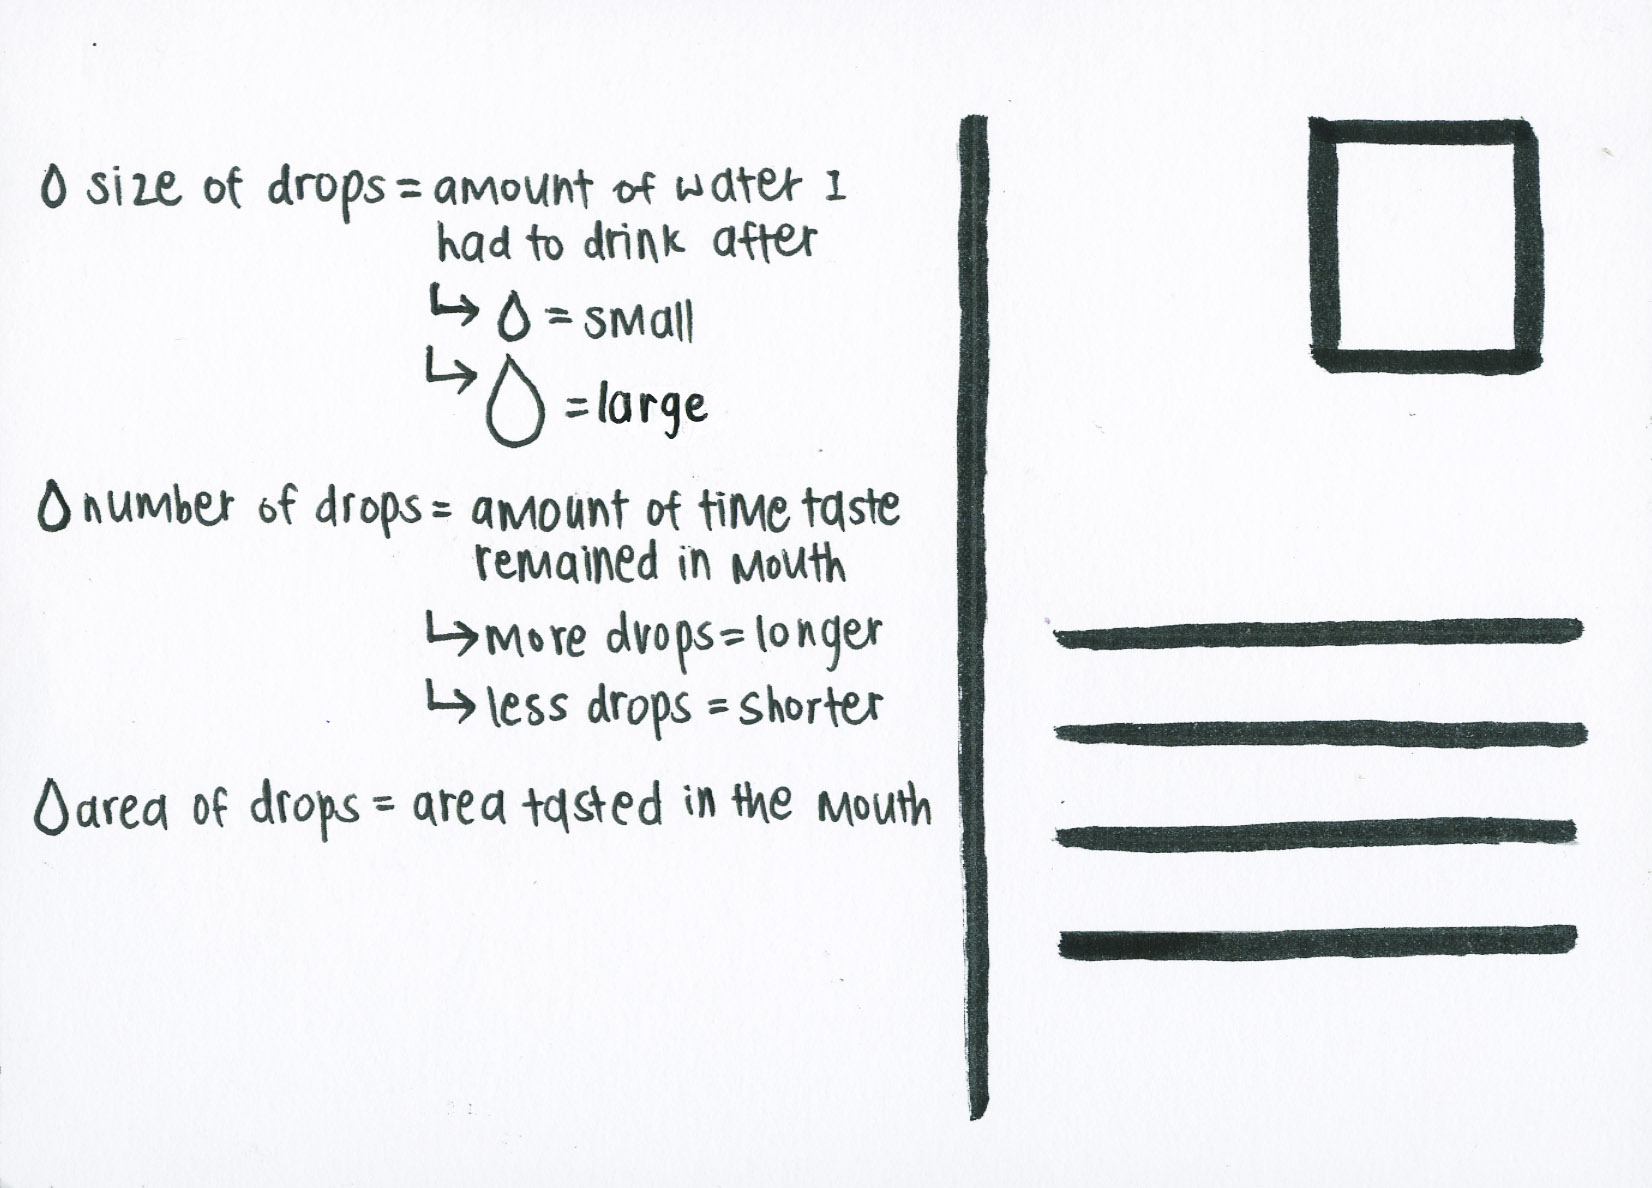
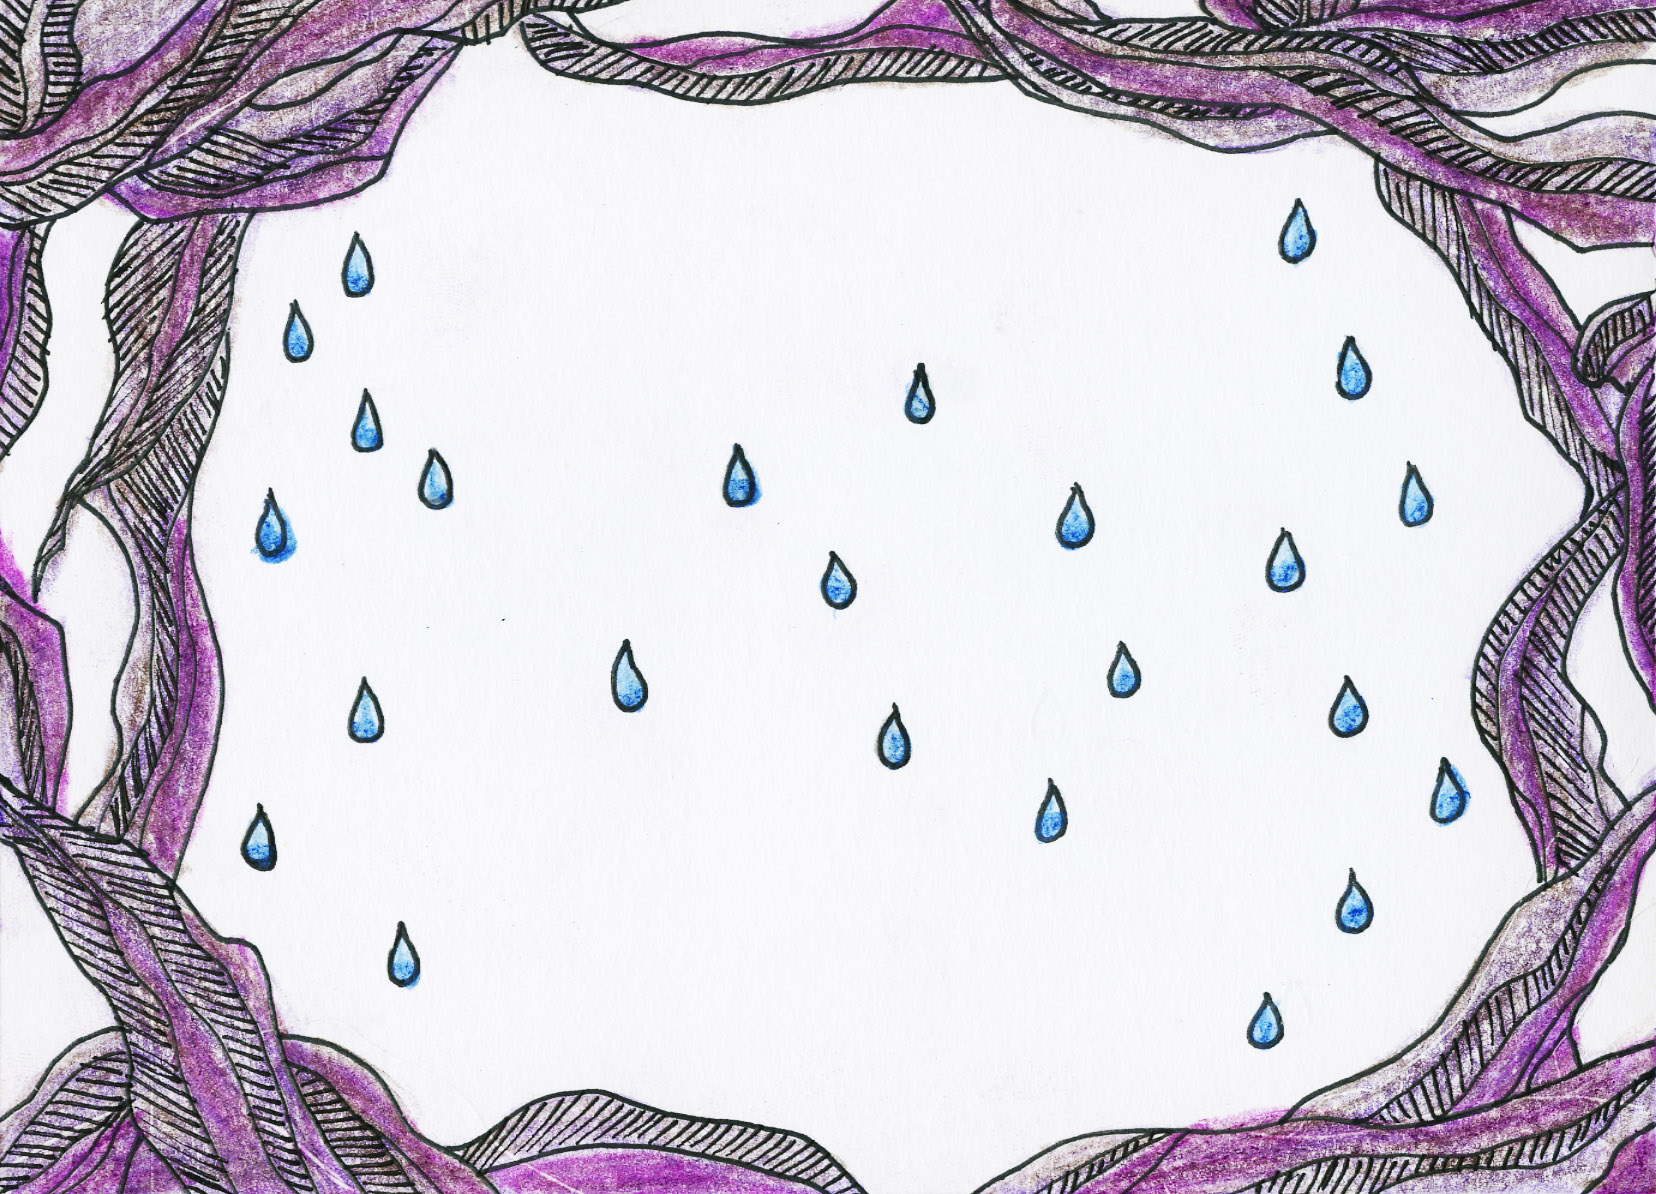
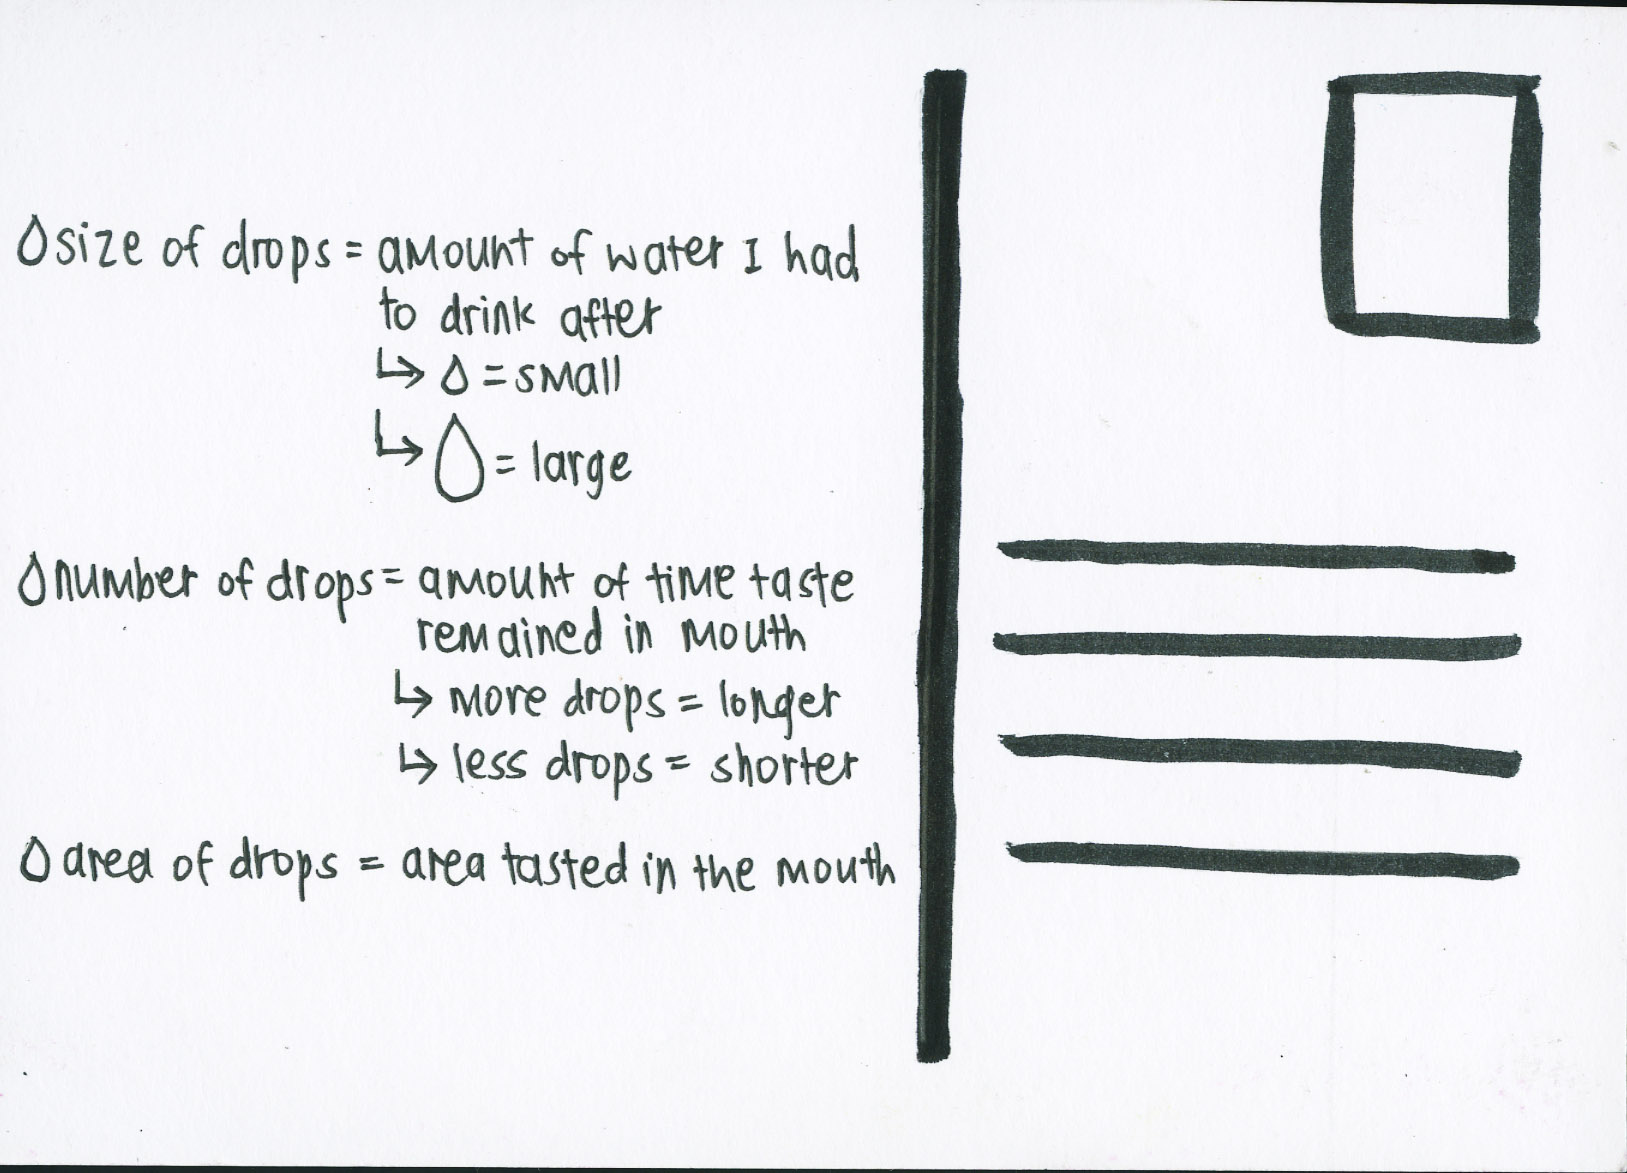
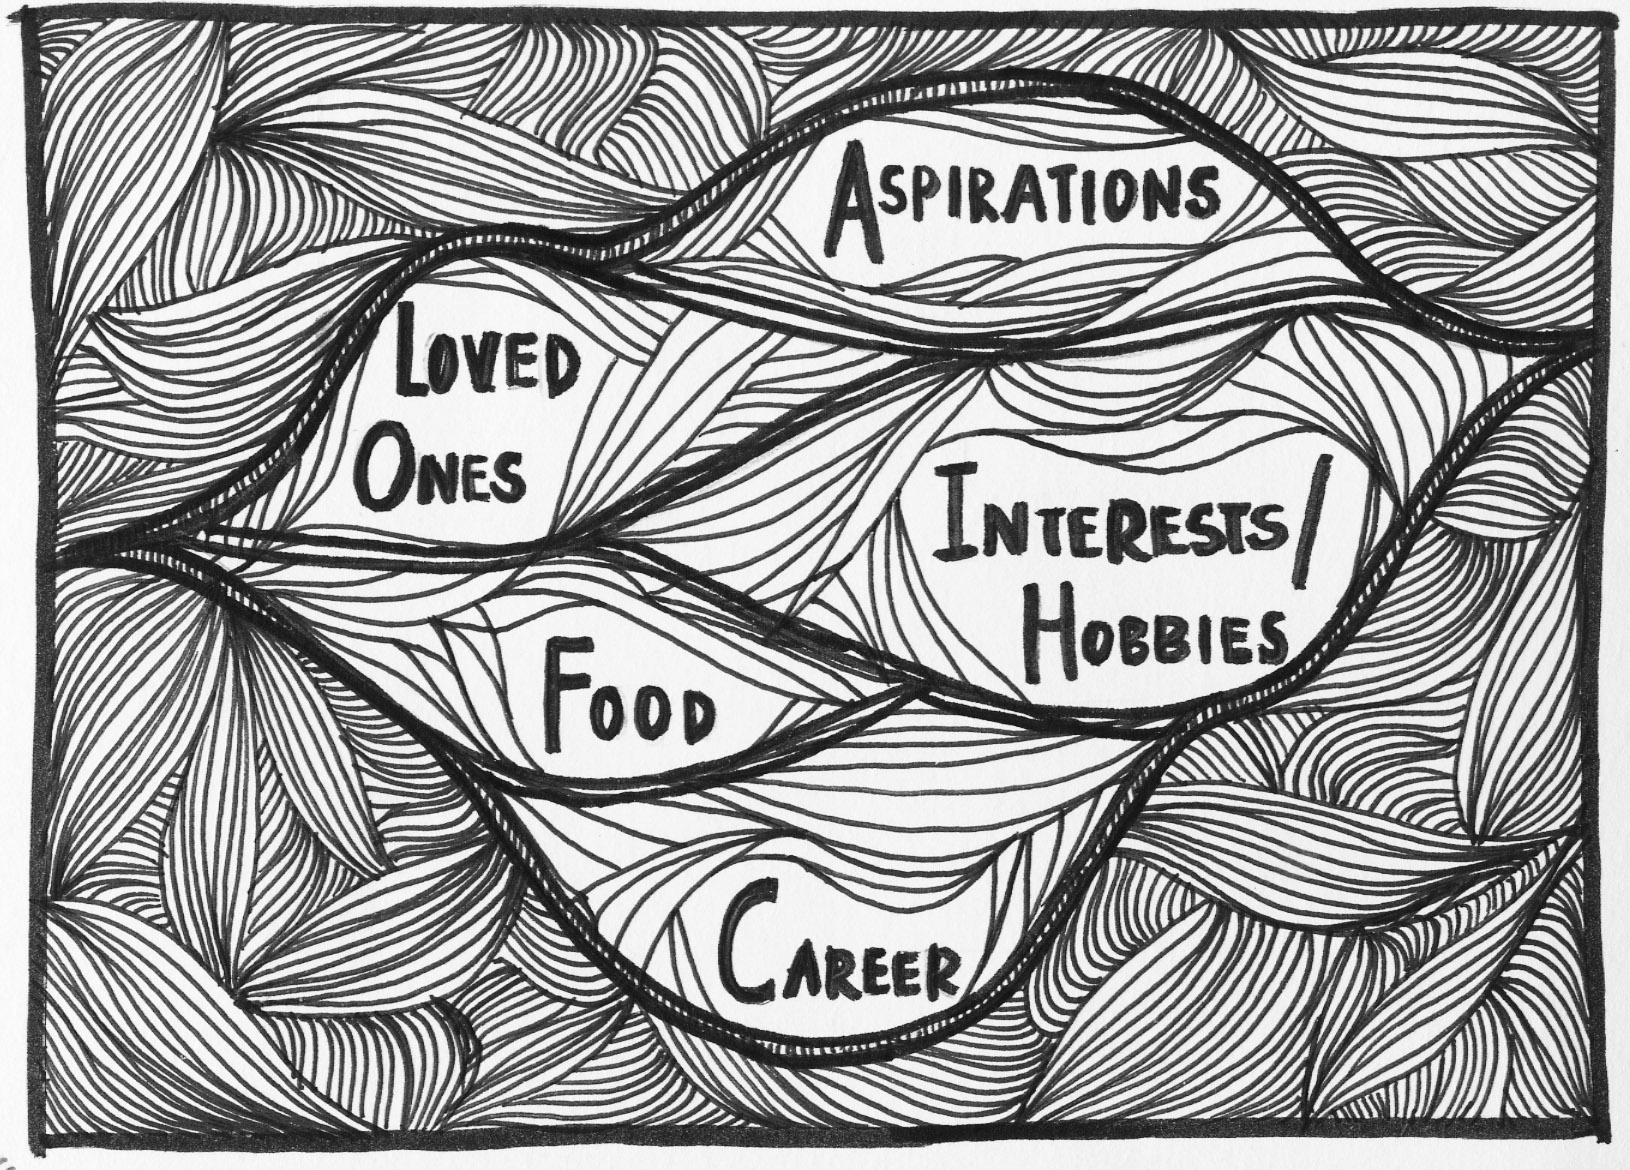
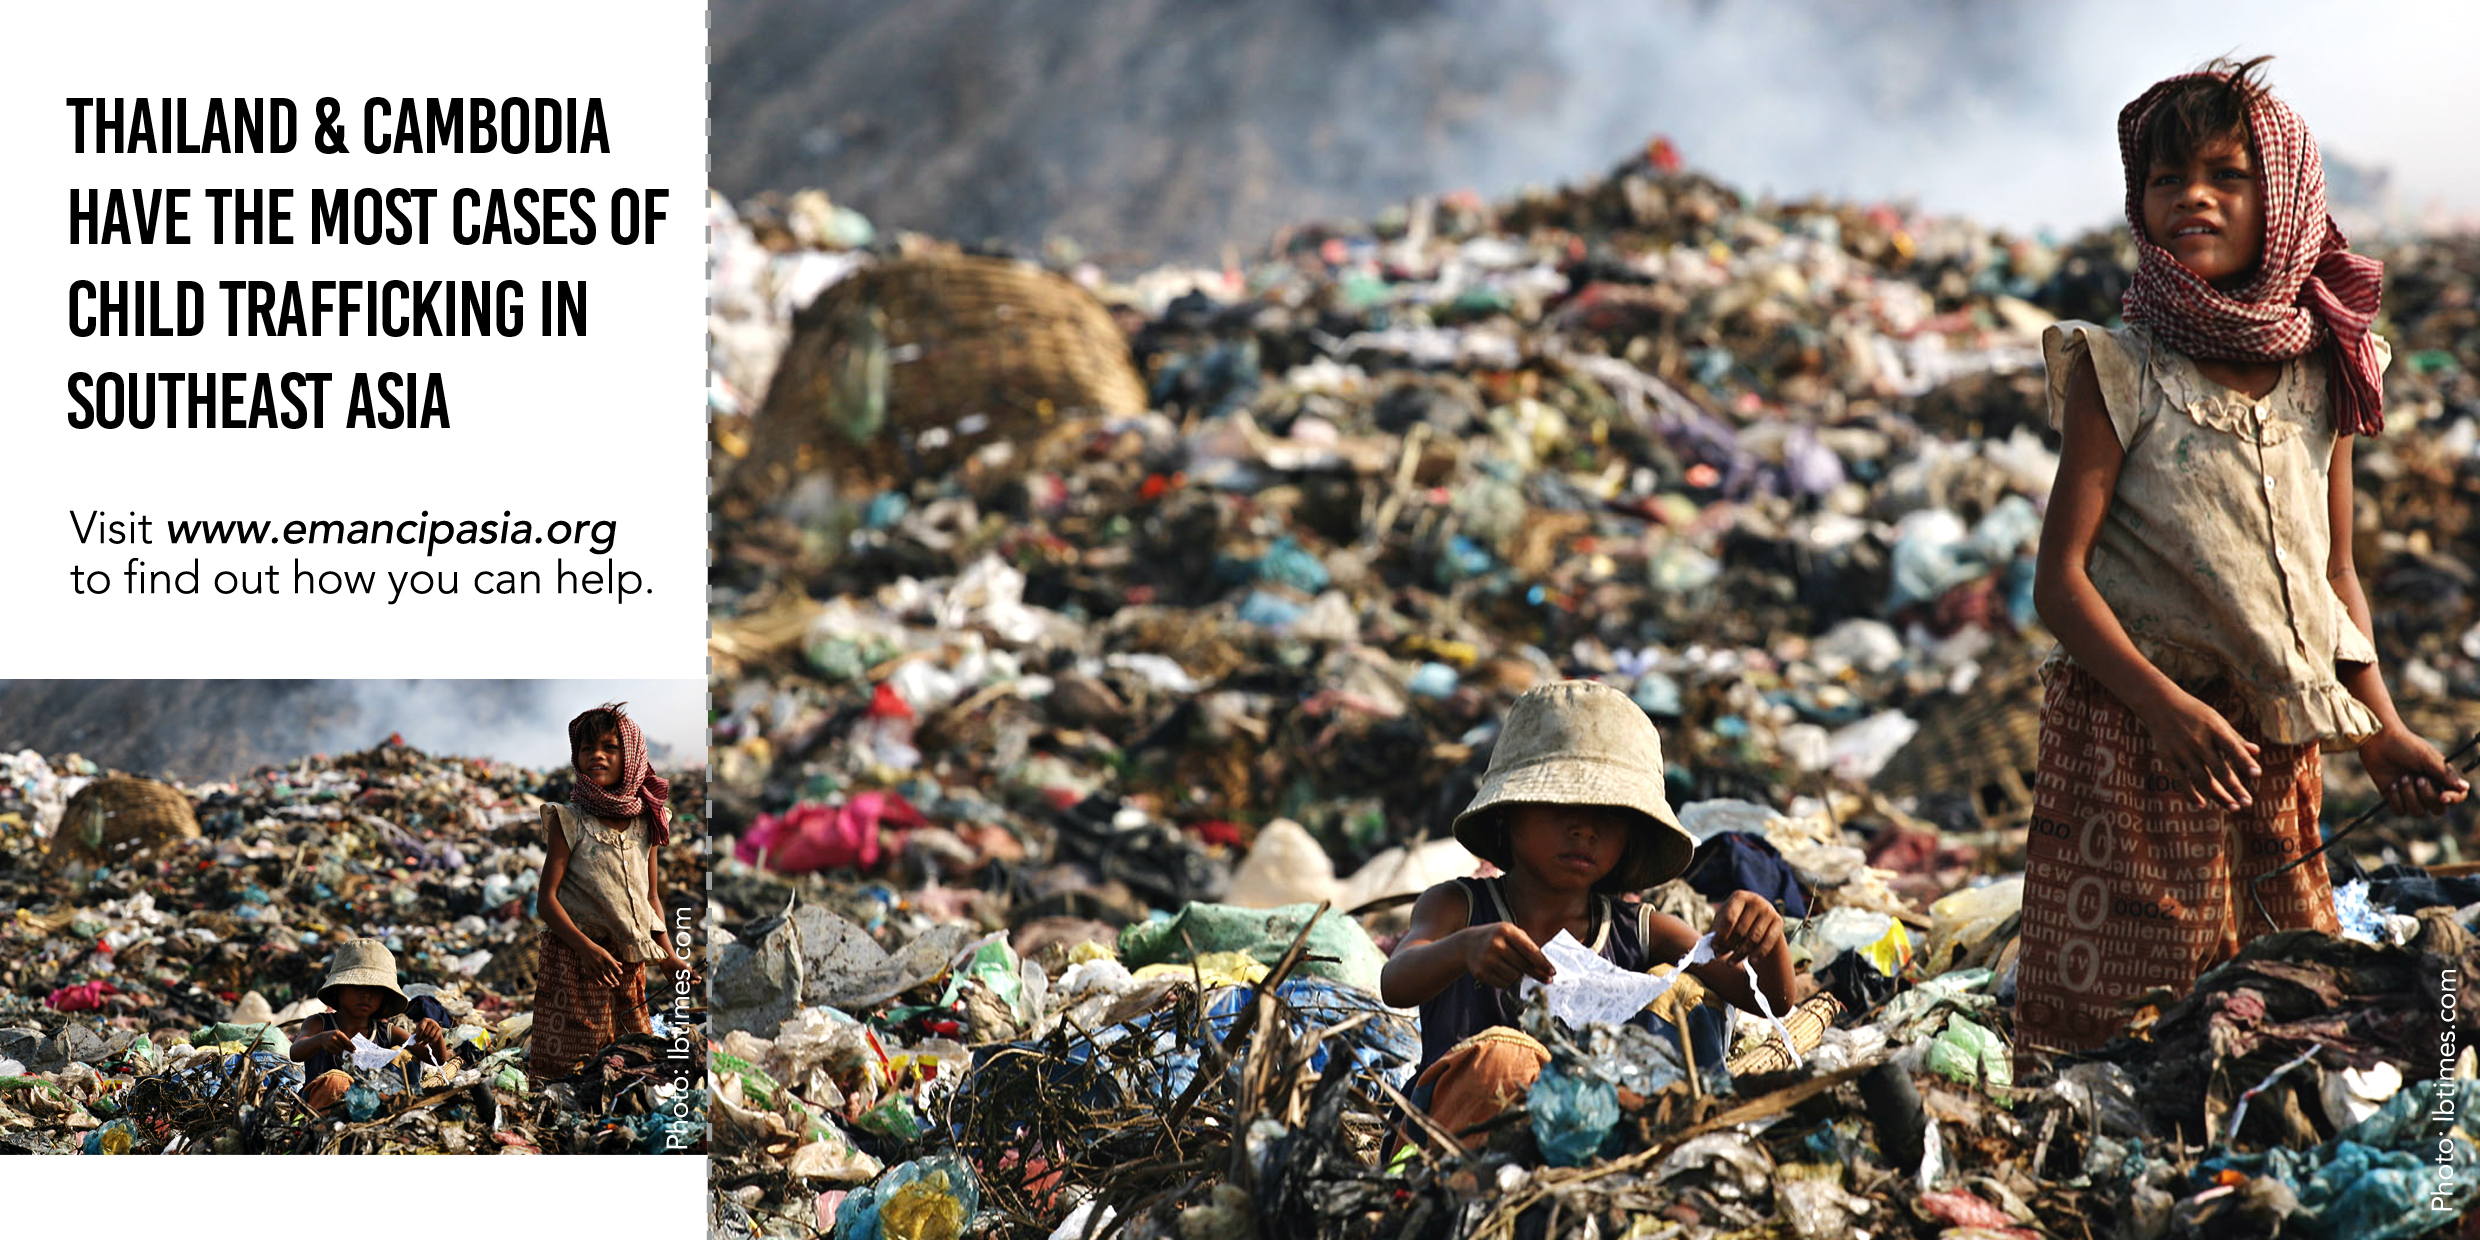
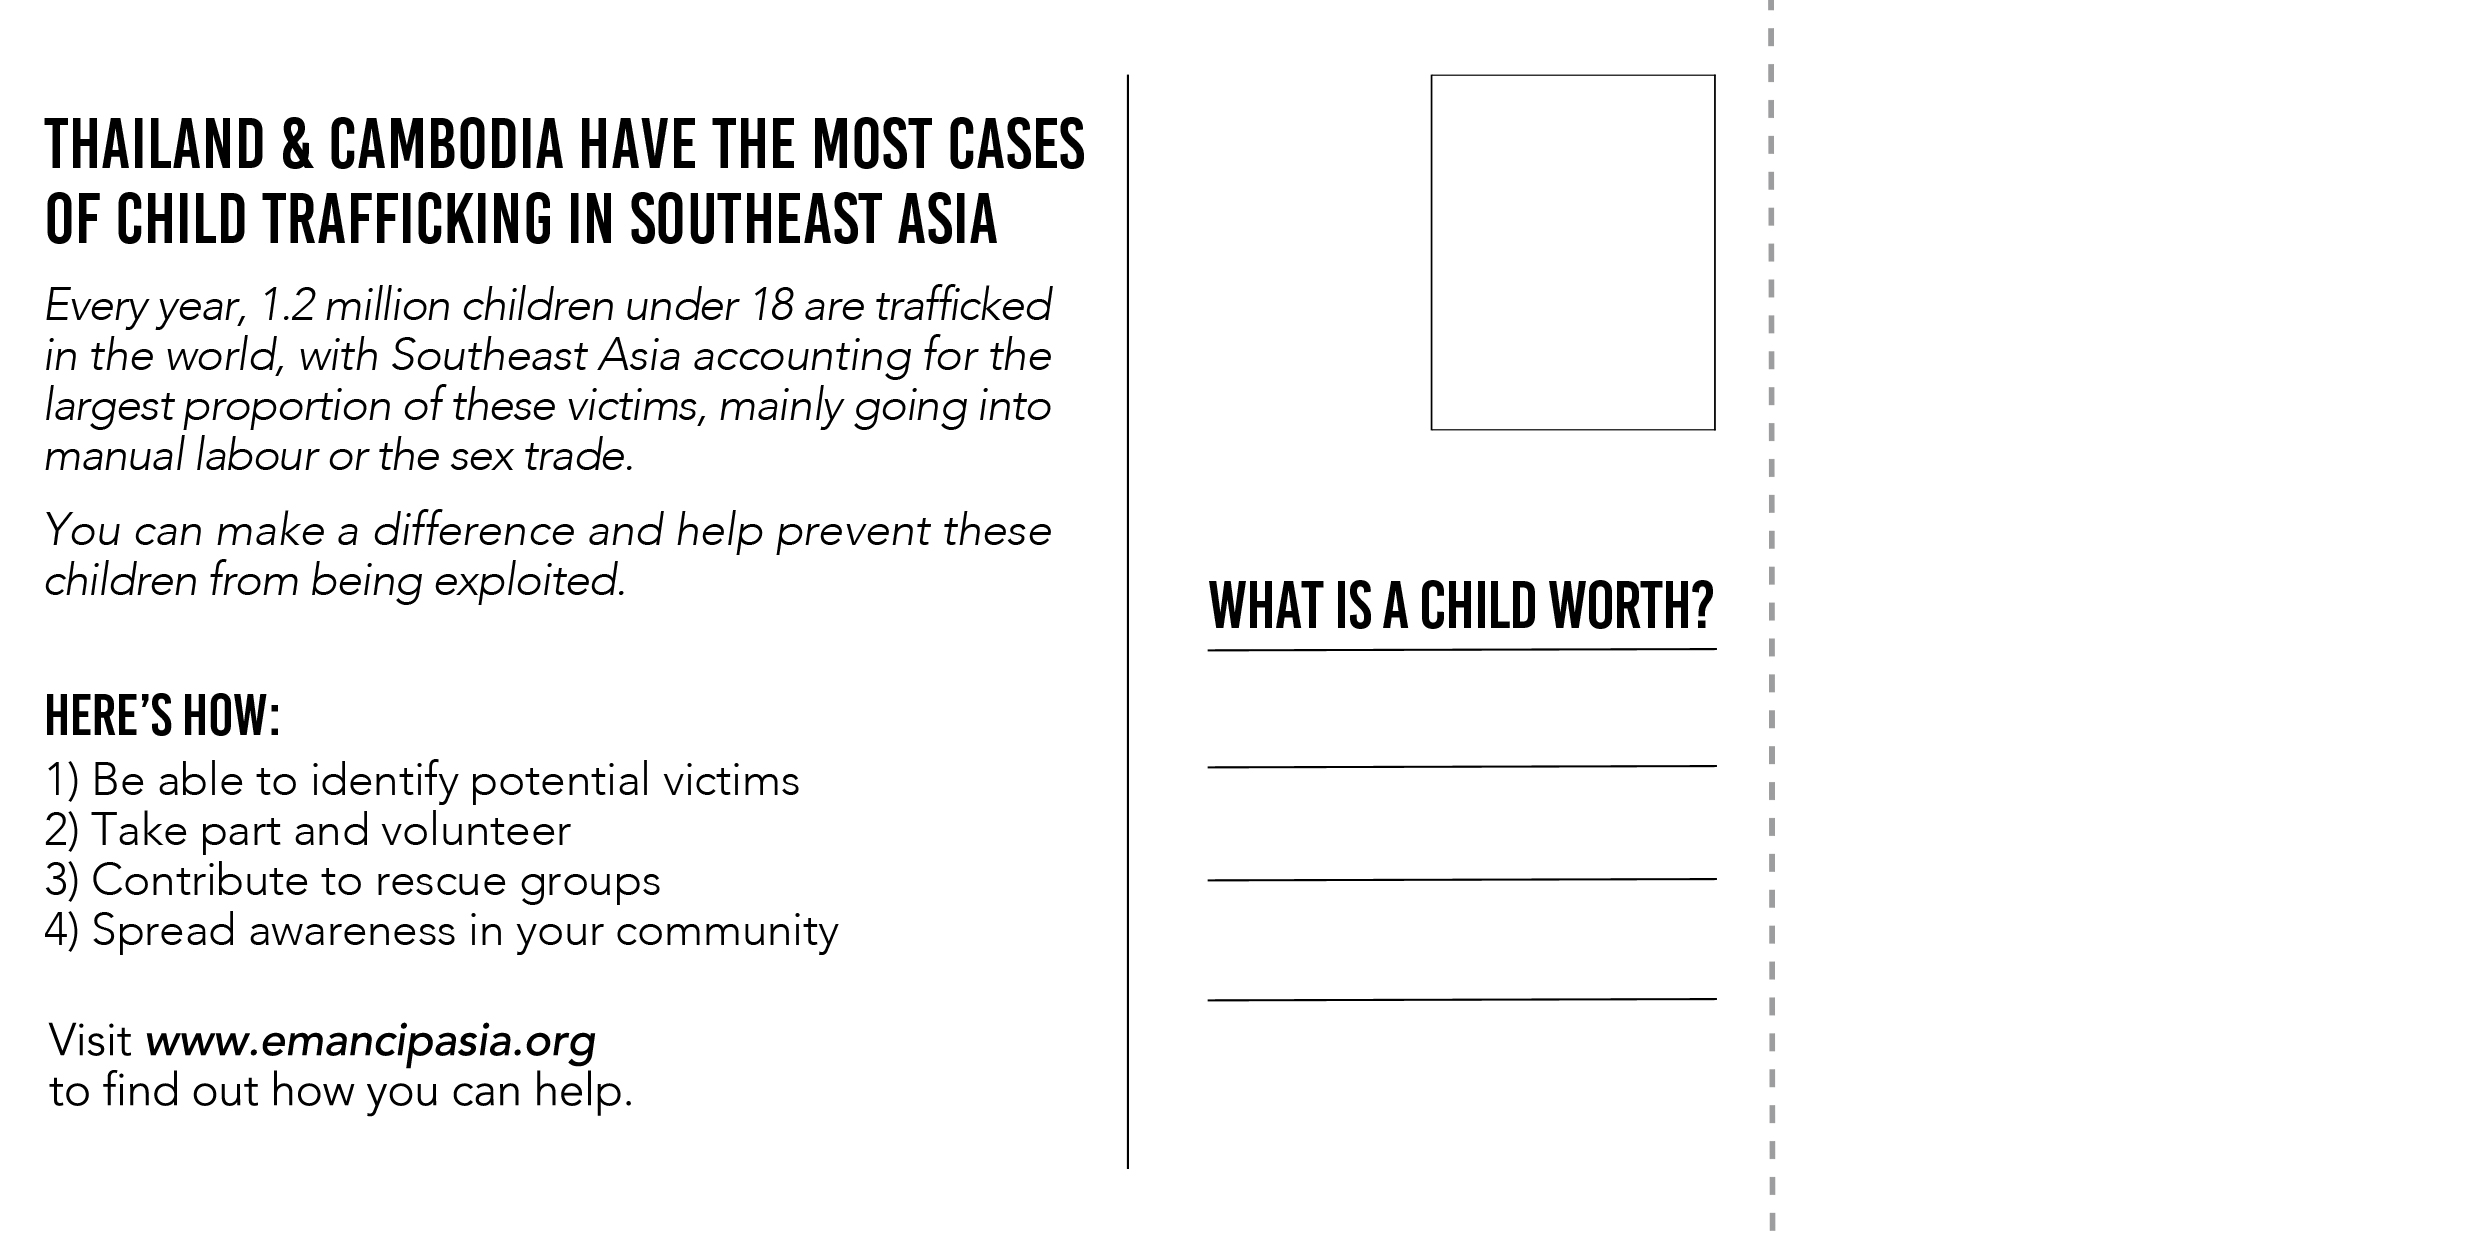
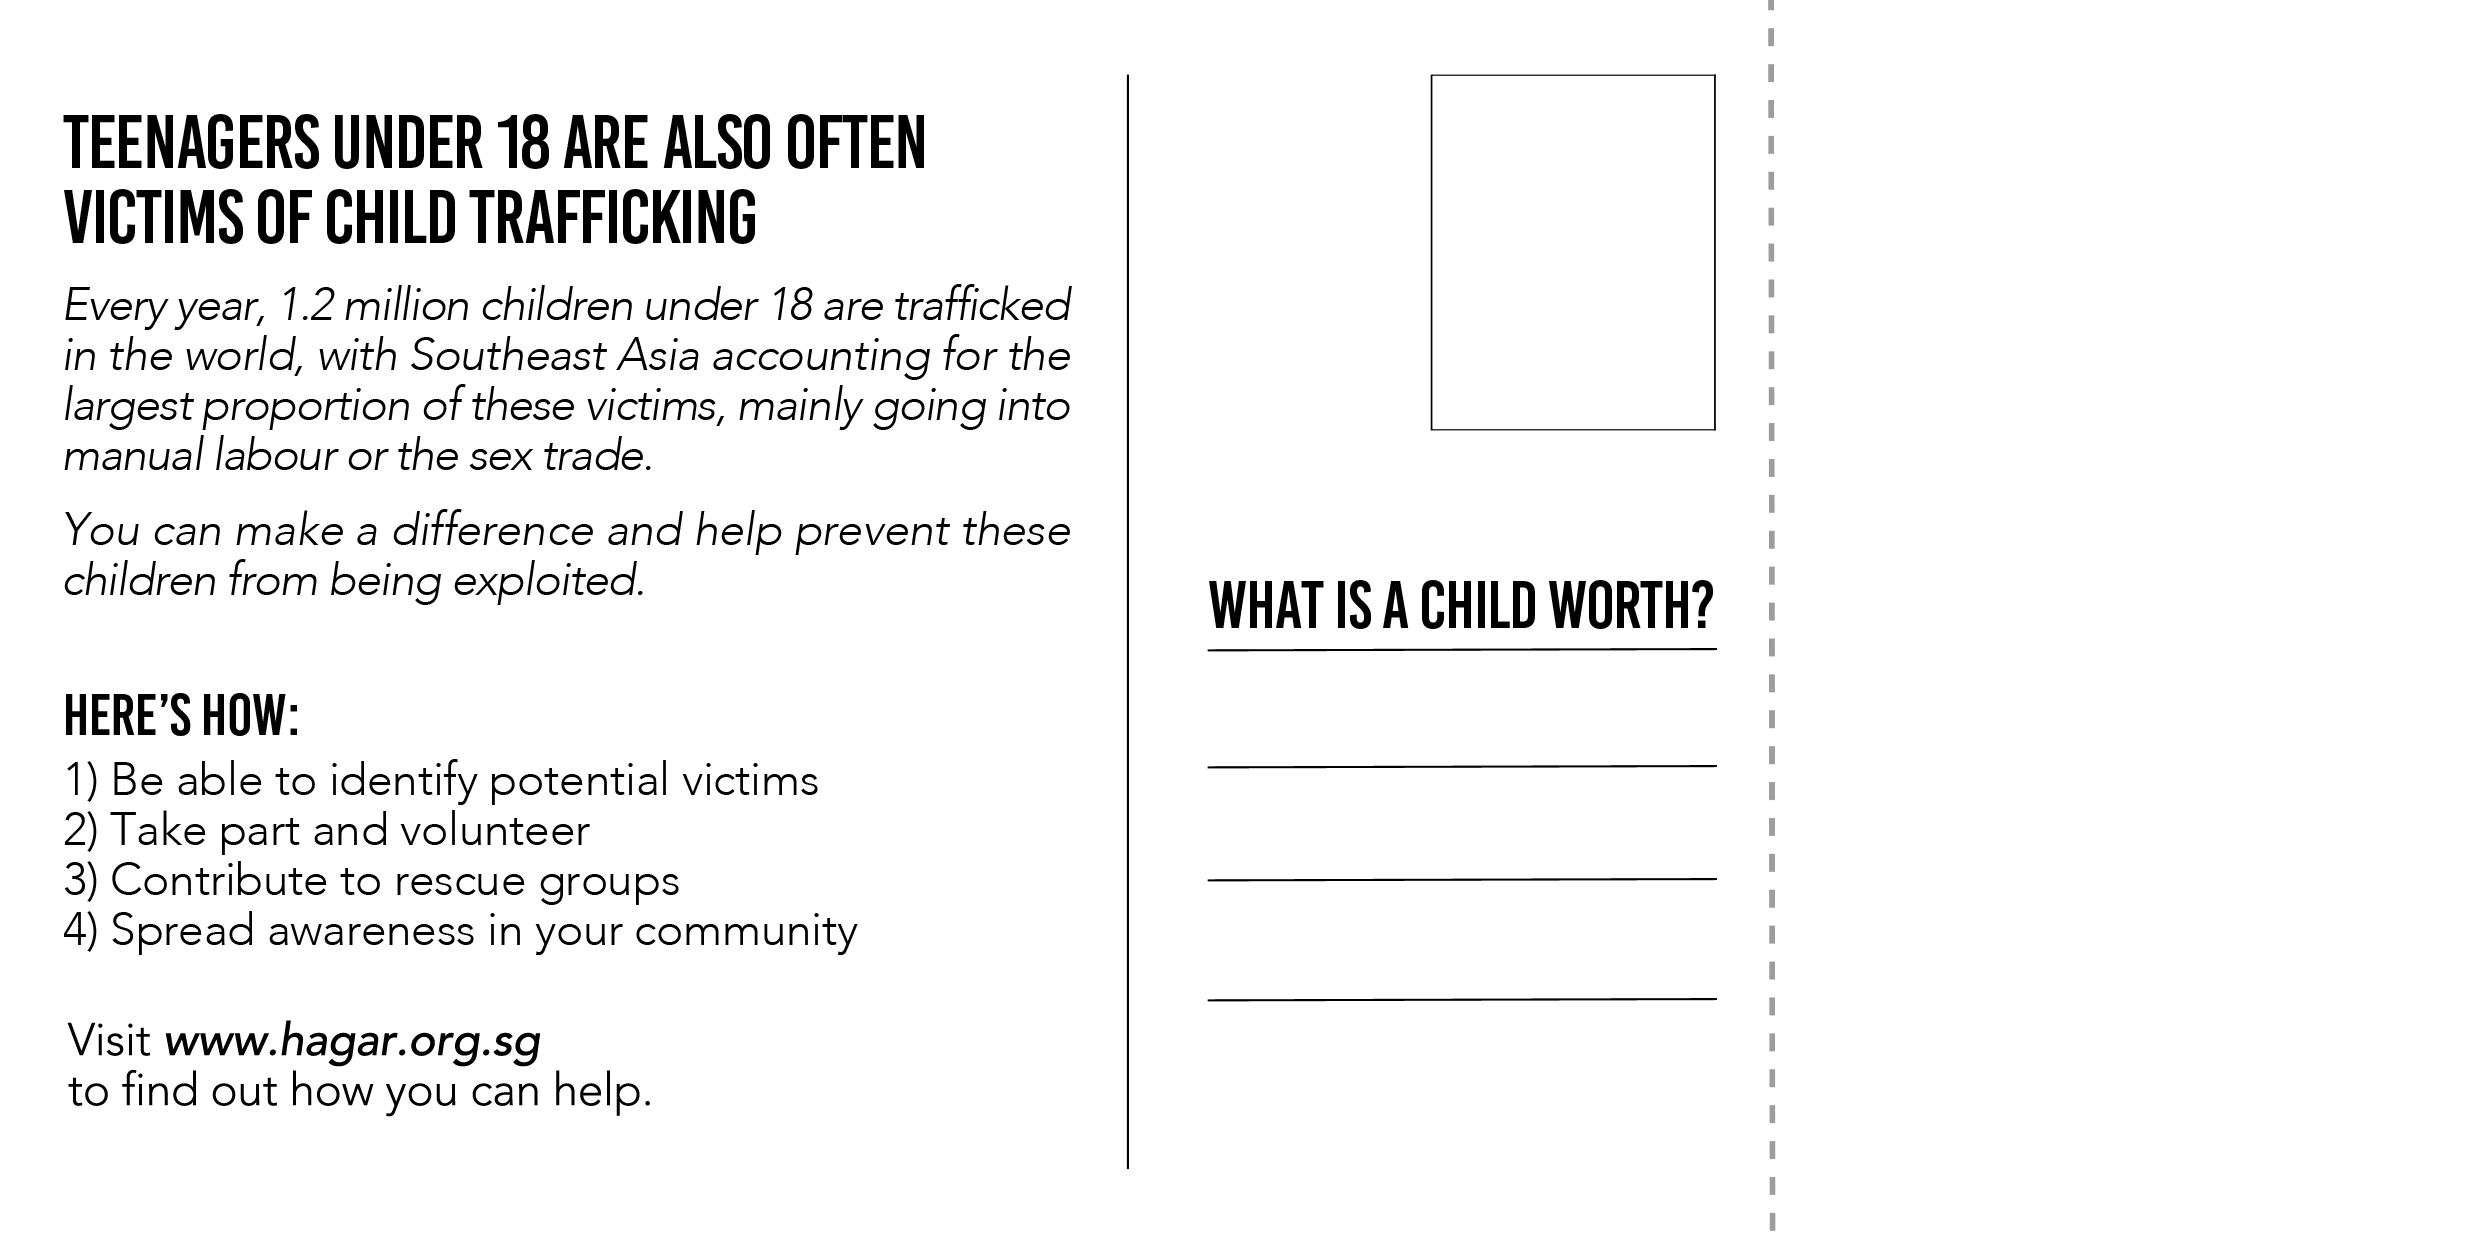
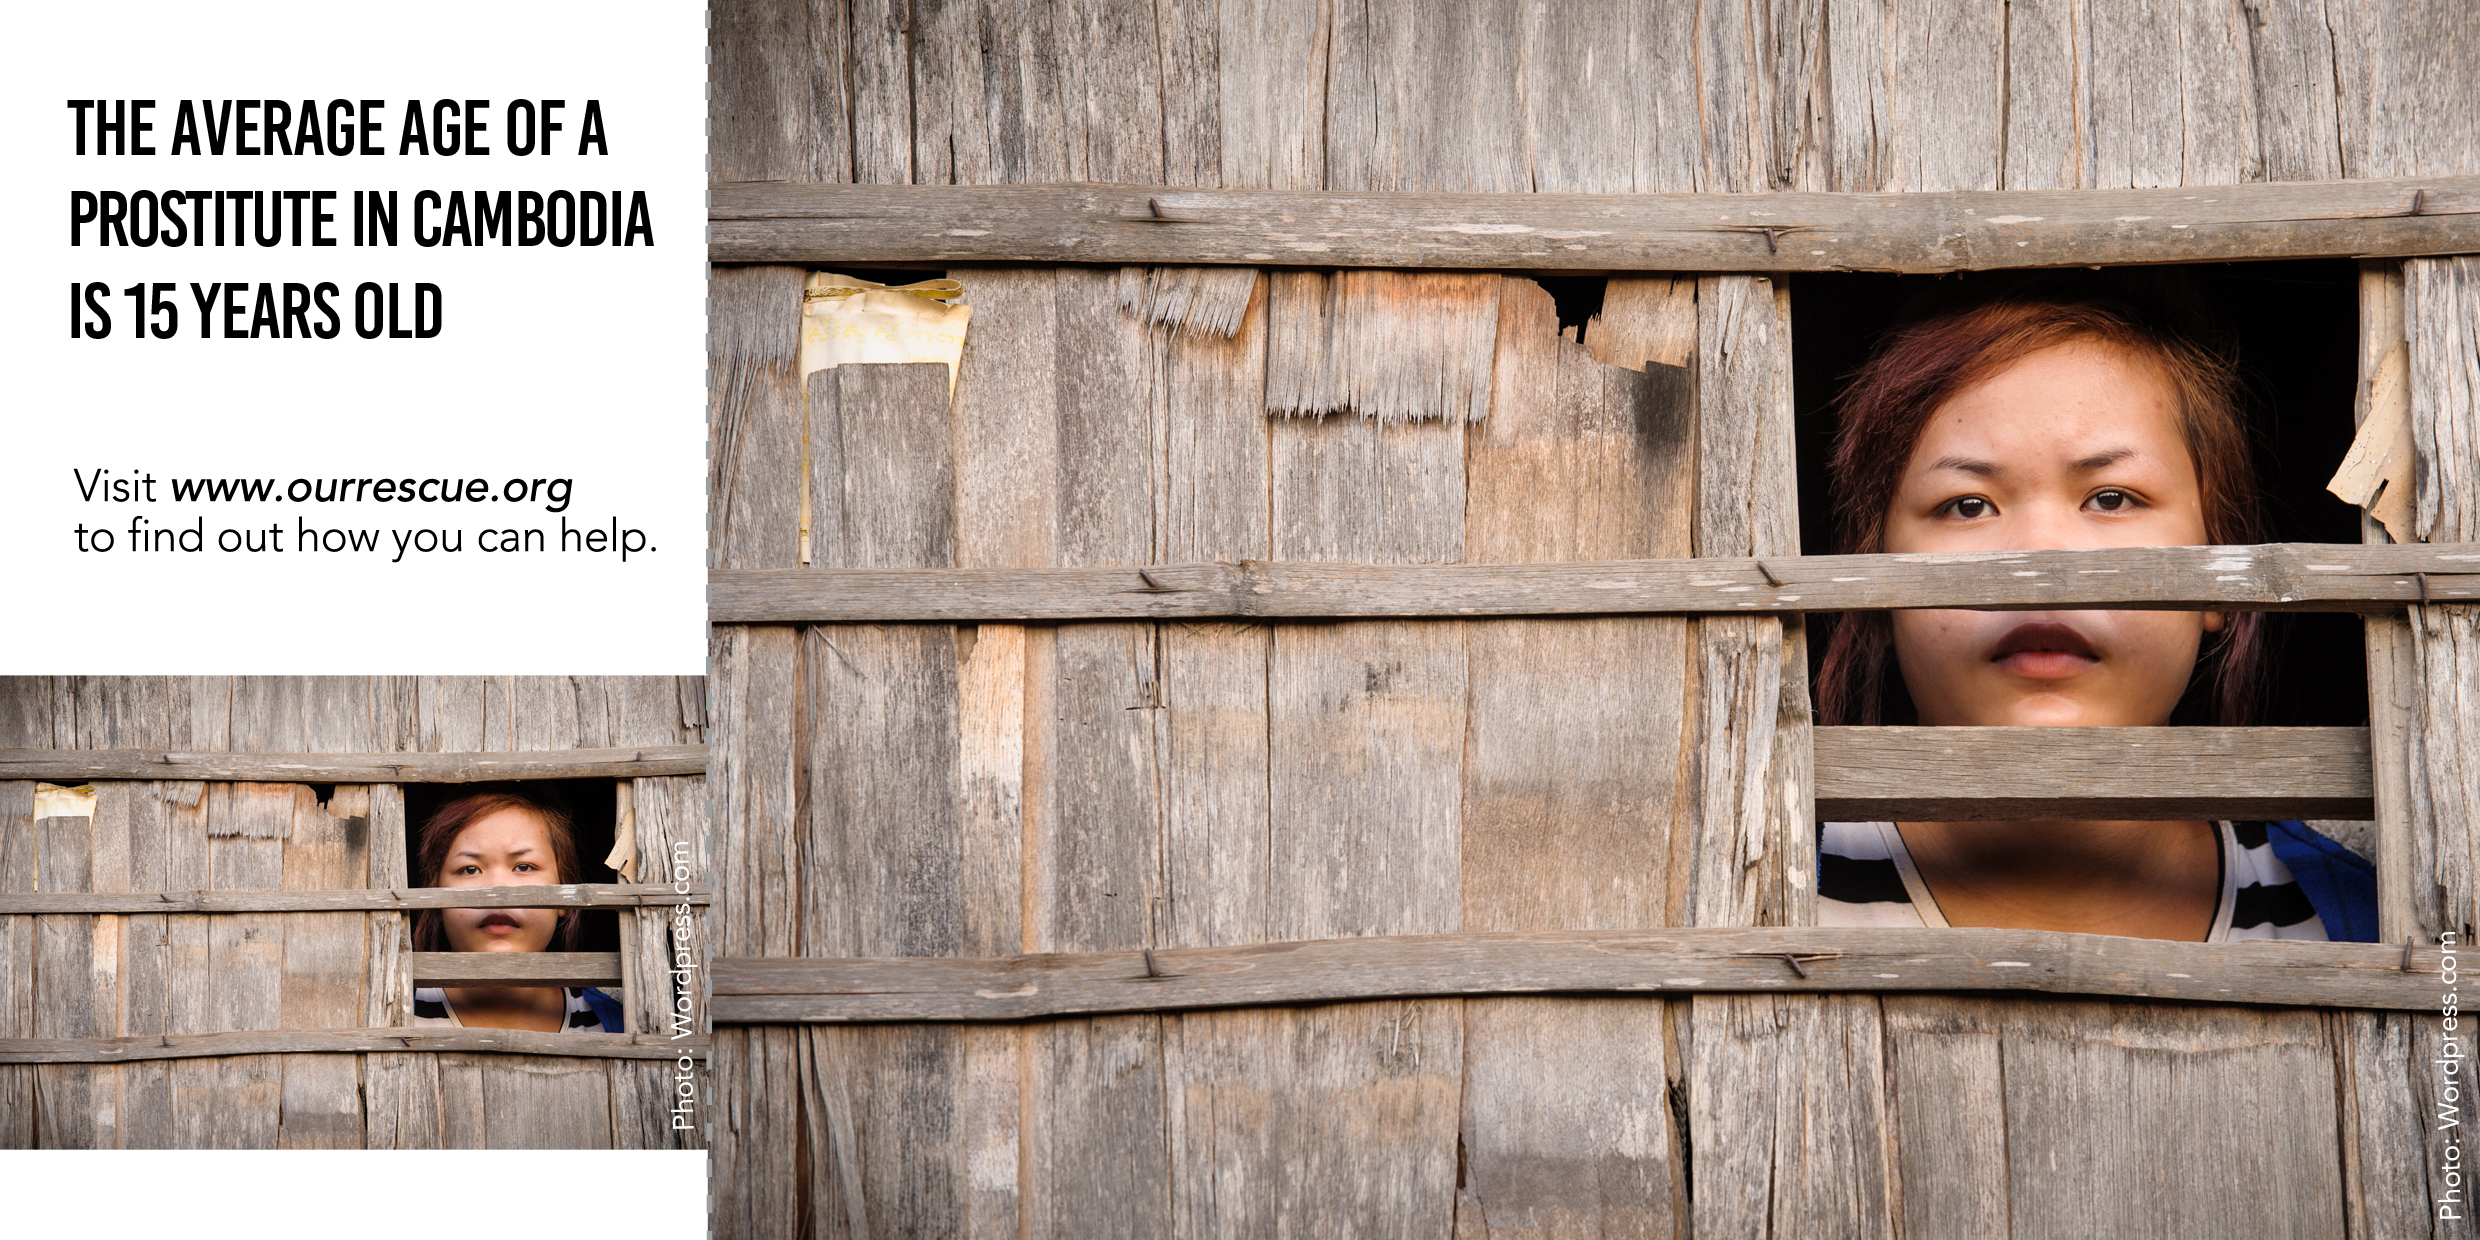
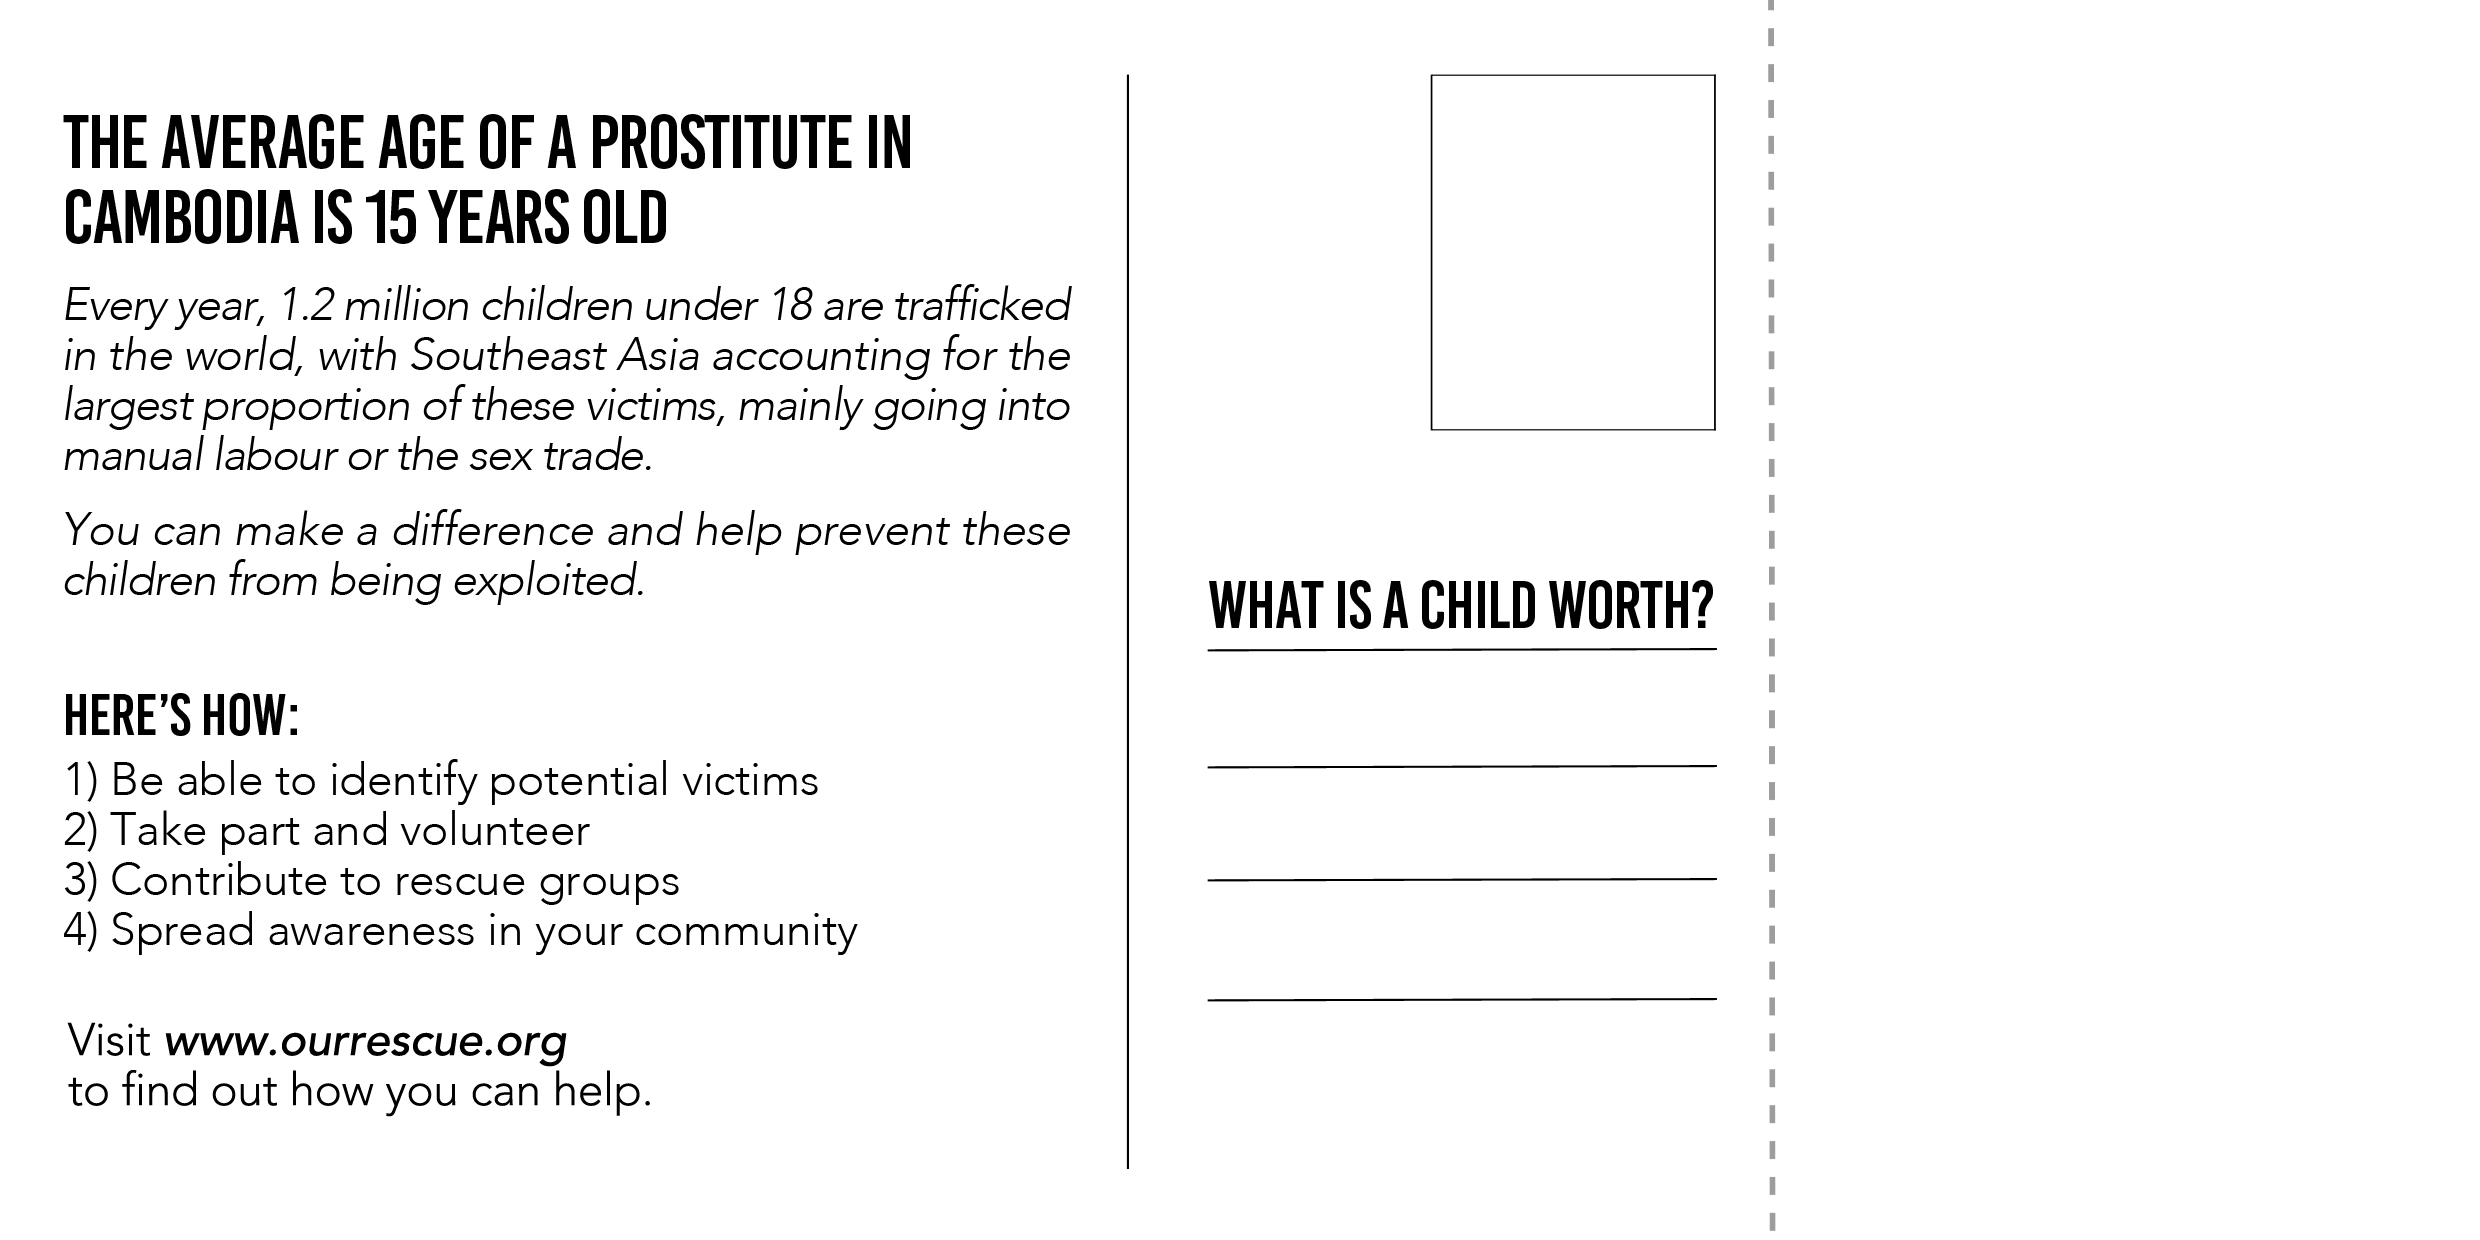
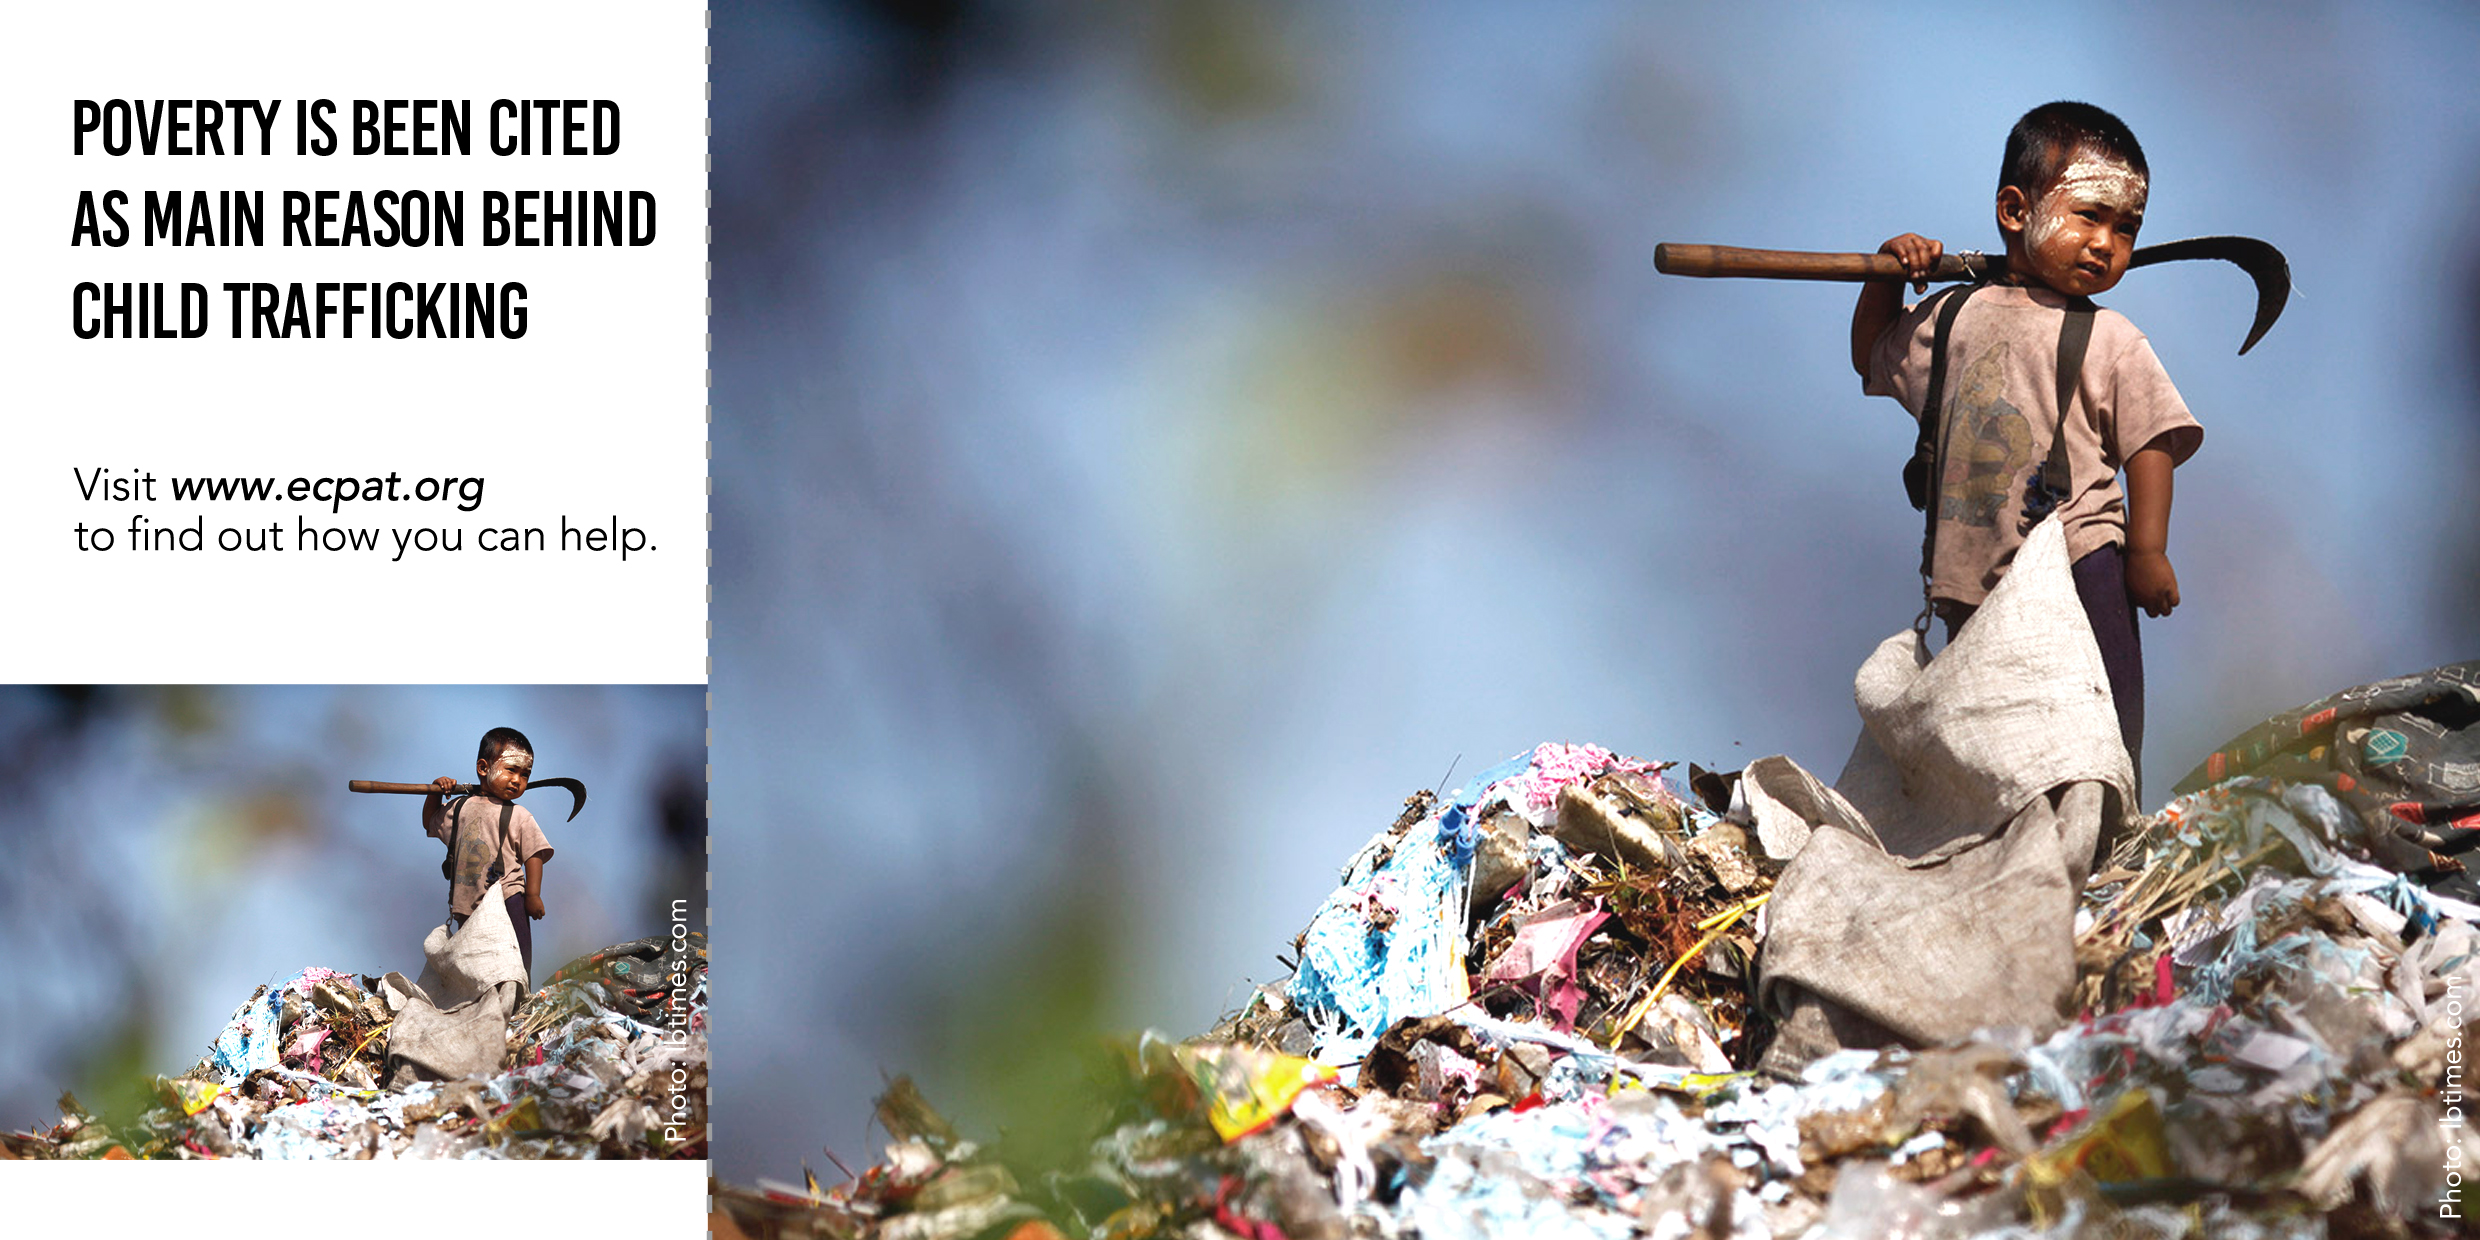
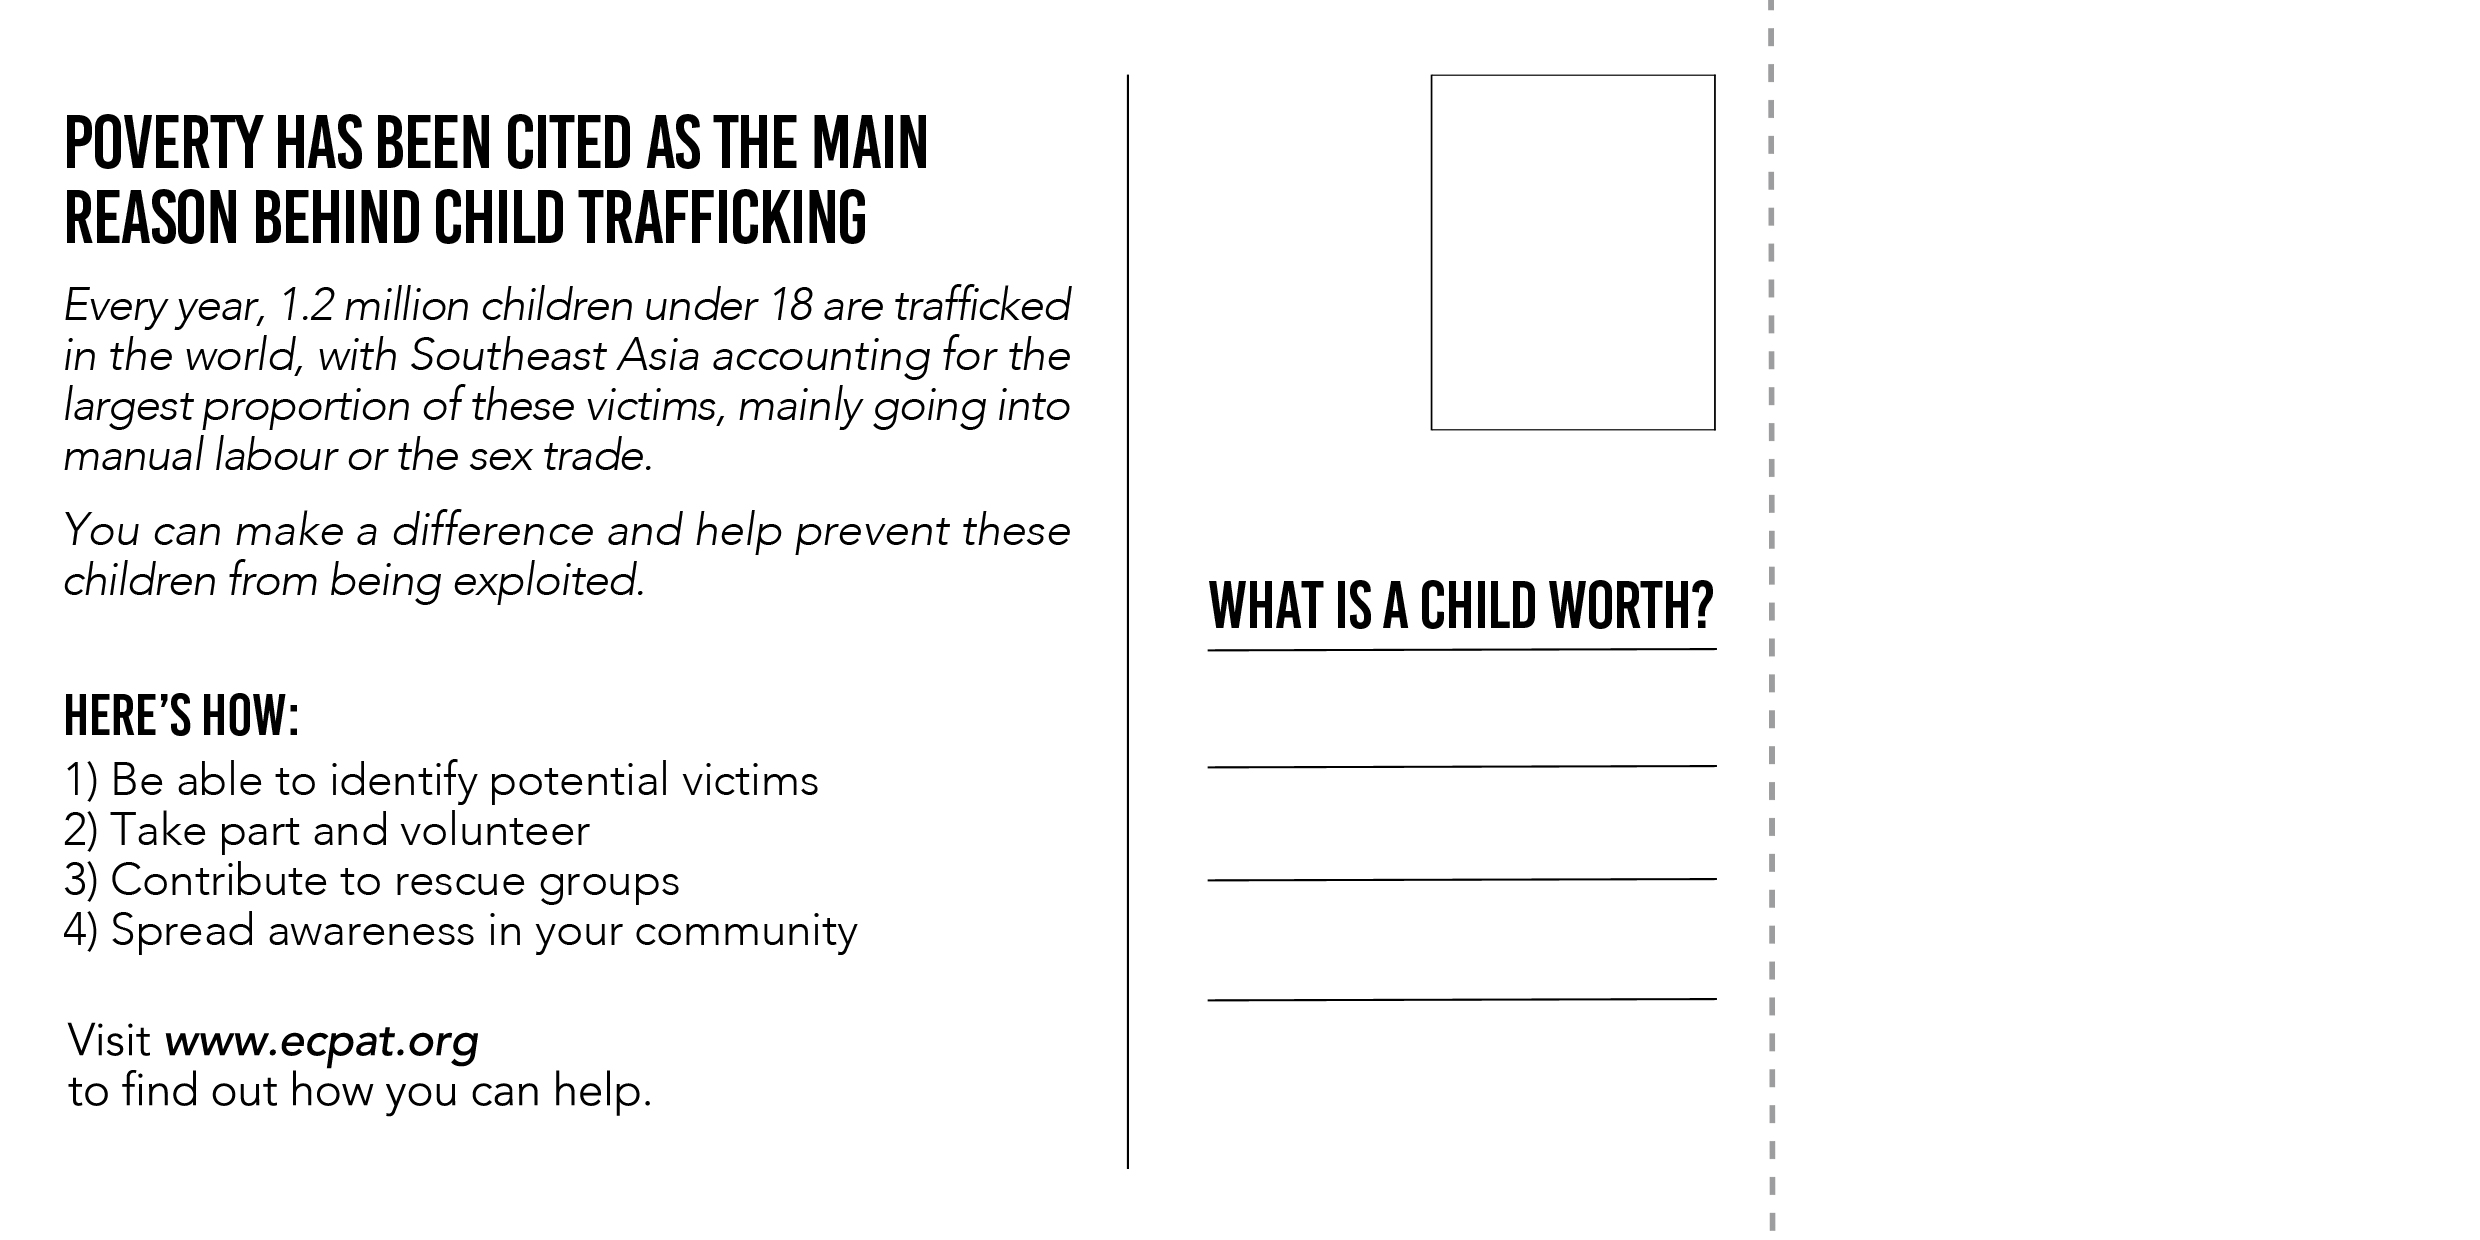
Therefore, I came up with the idea of a way to mail out postcards to people we know, as a method of spreading information and awareness. Each postcard would be unique, with a bit of information that I thought was not nearly known as well, and was shocking. I also found organisations online that helped prevent child trafficking and assisted children who were saved, and thought that it would be good to incorporate ways and a platform the postcard receiver could get in touch with and help. So each postcard also has a link to a different organisation. The postcard could be torn off a booklet that can be kept for yourself, so the person reading it would always have access to information and a list of organisations as well.

Here are some pages of the softcopies:


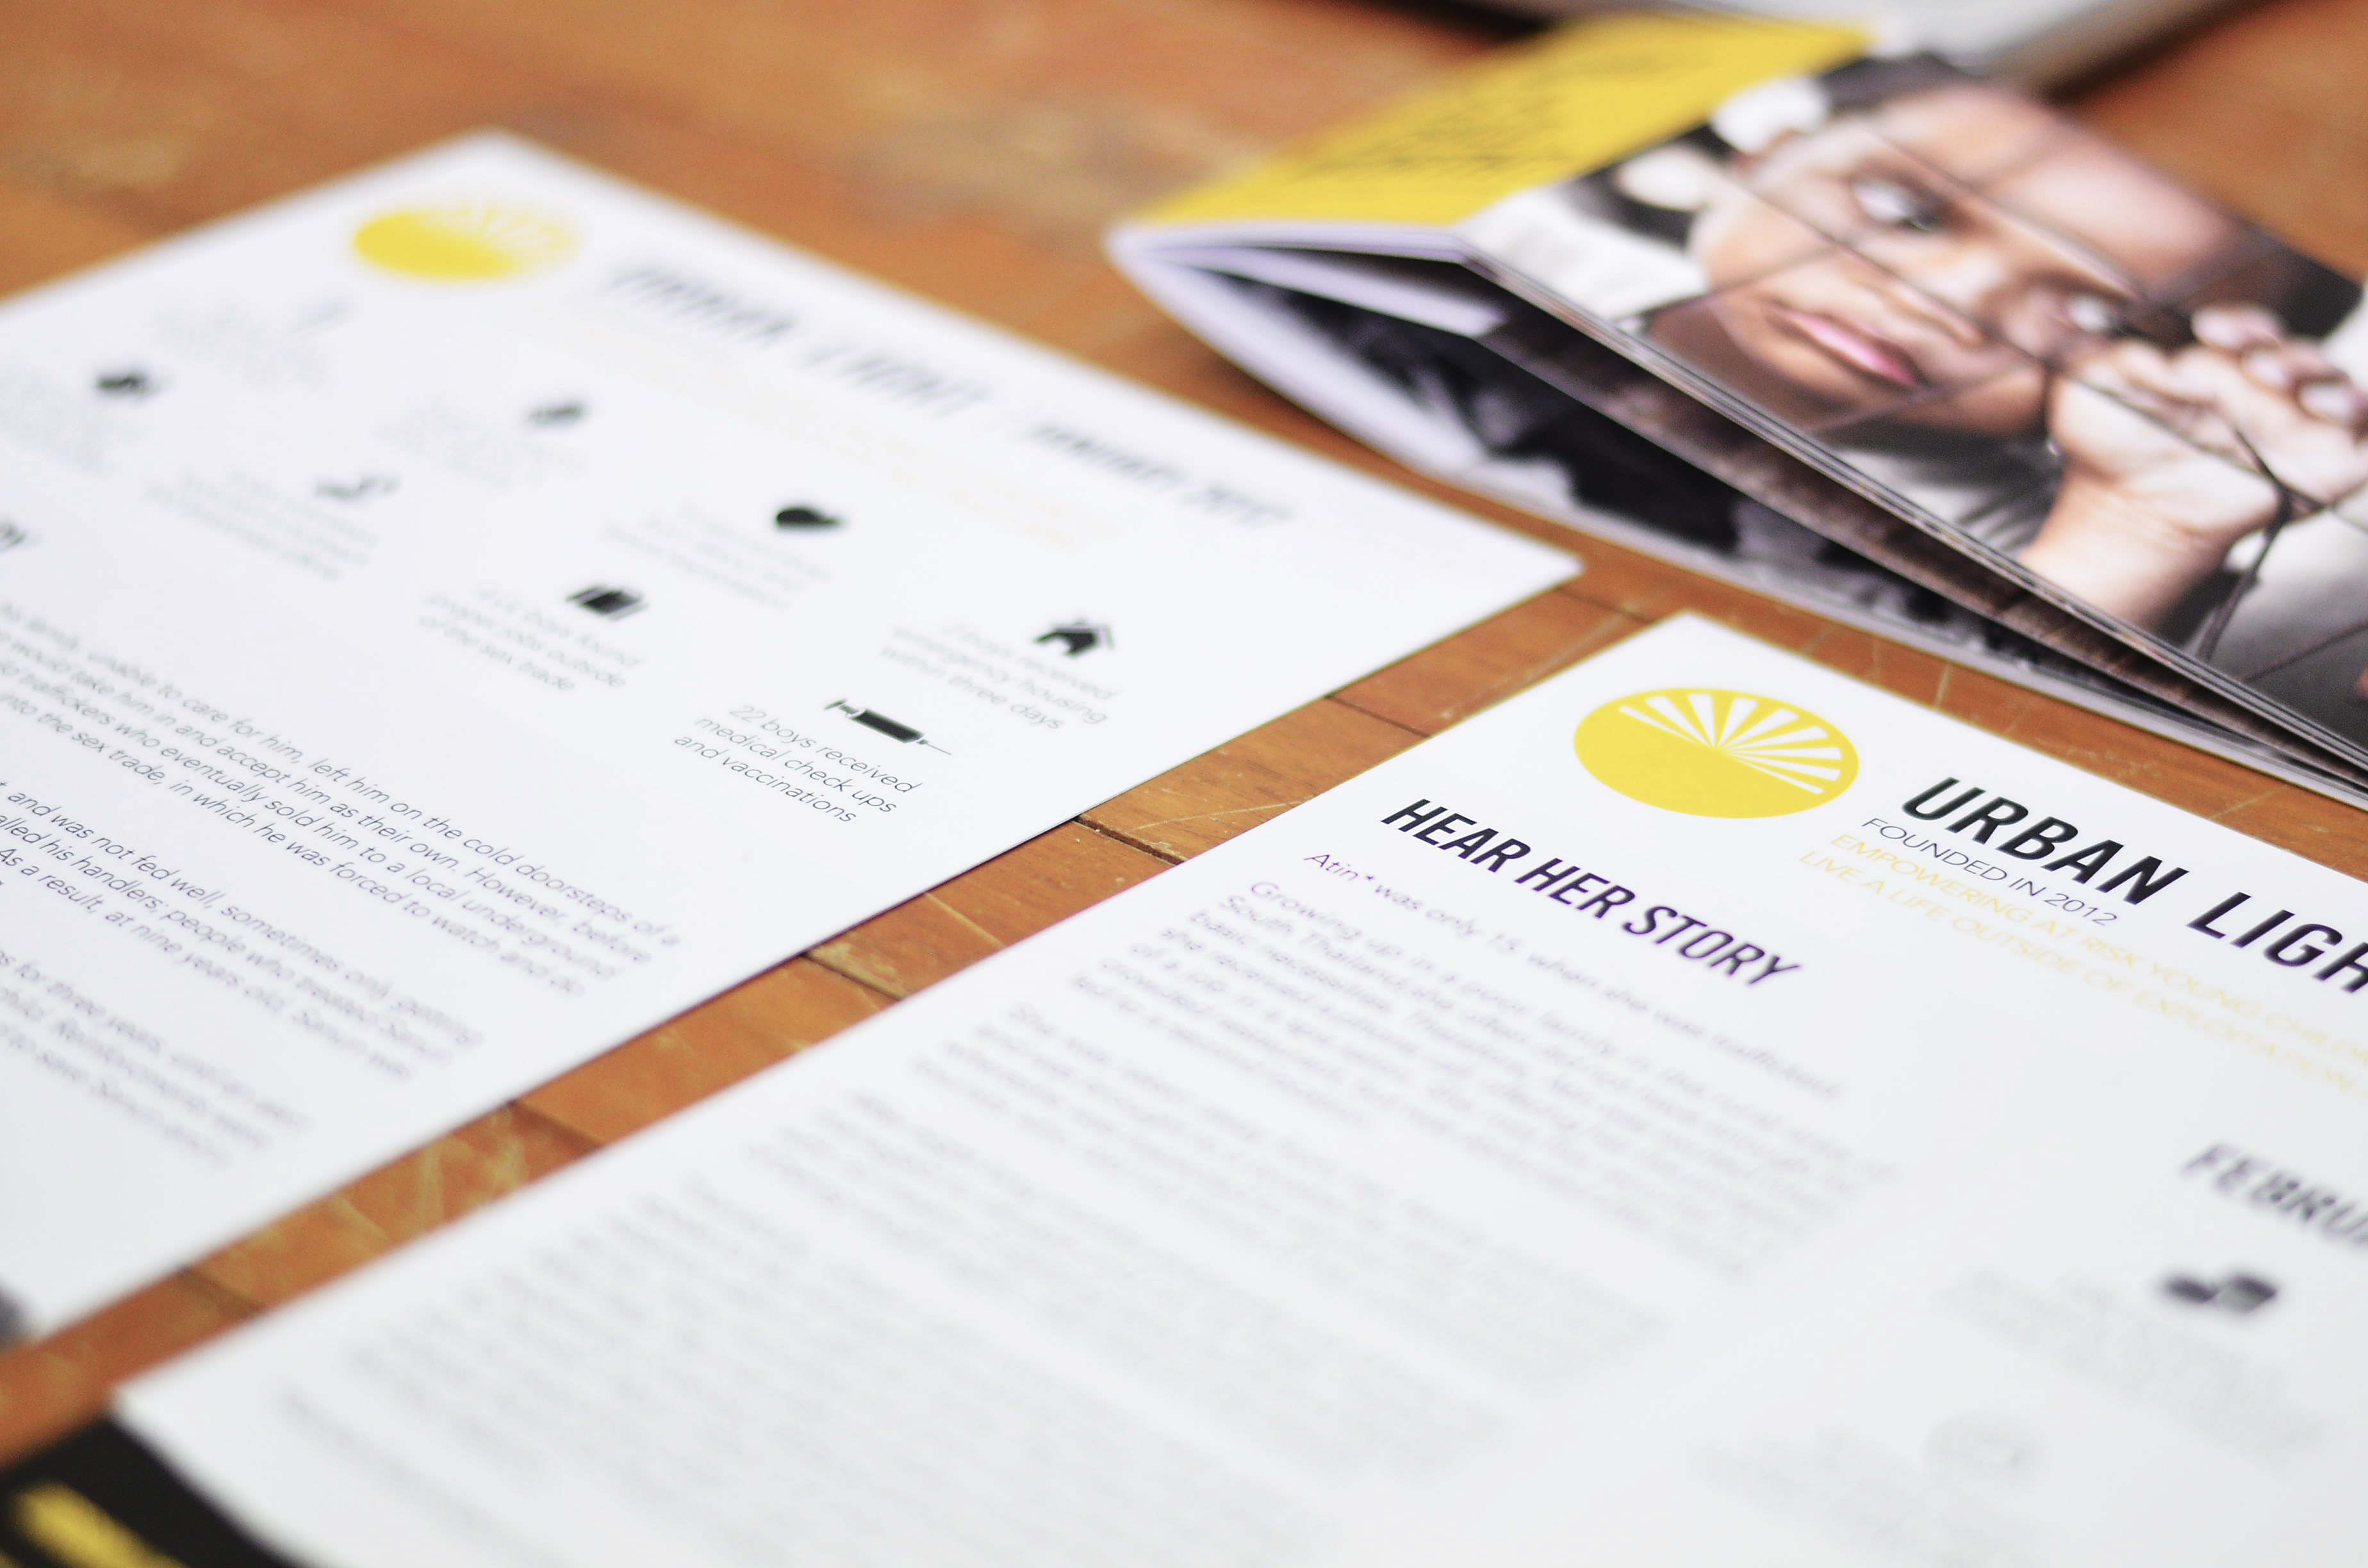
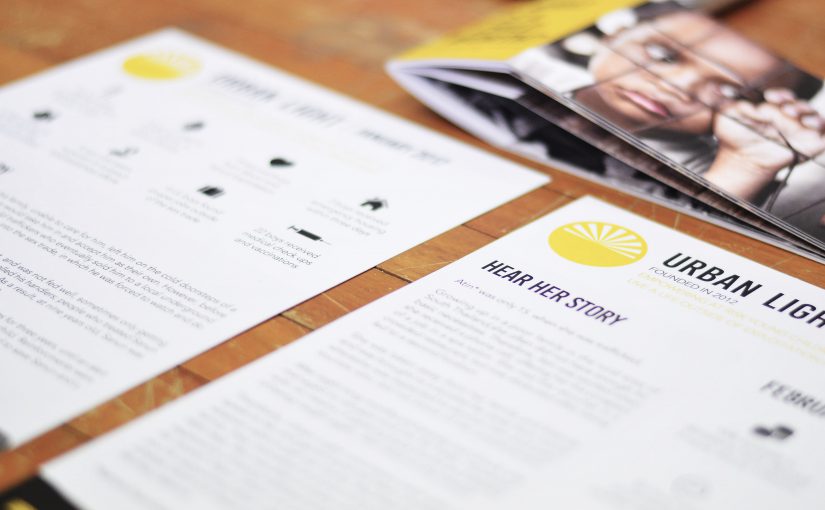
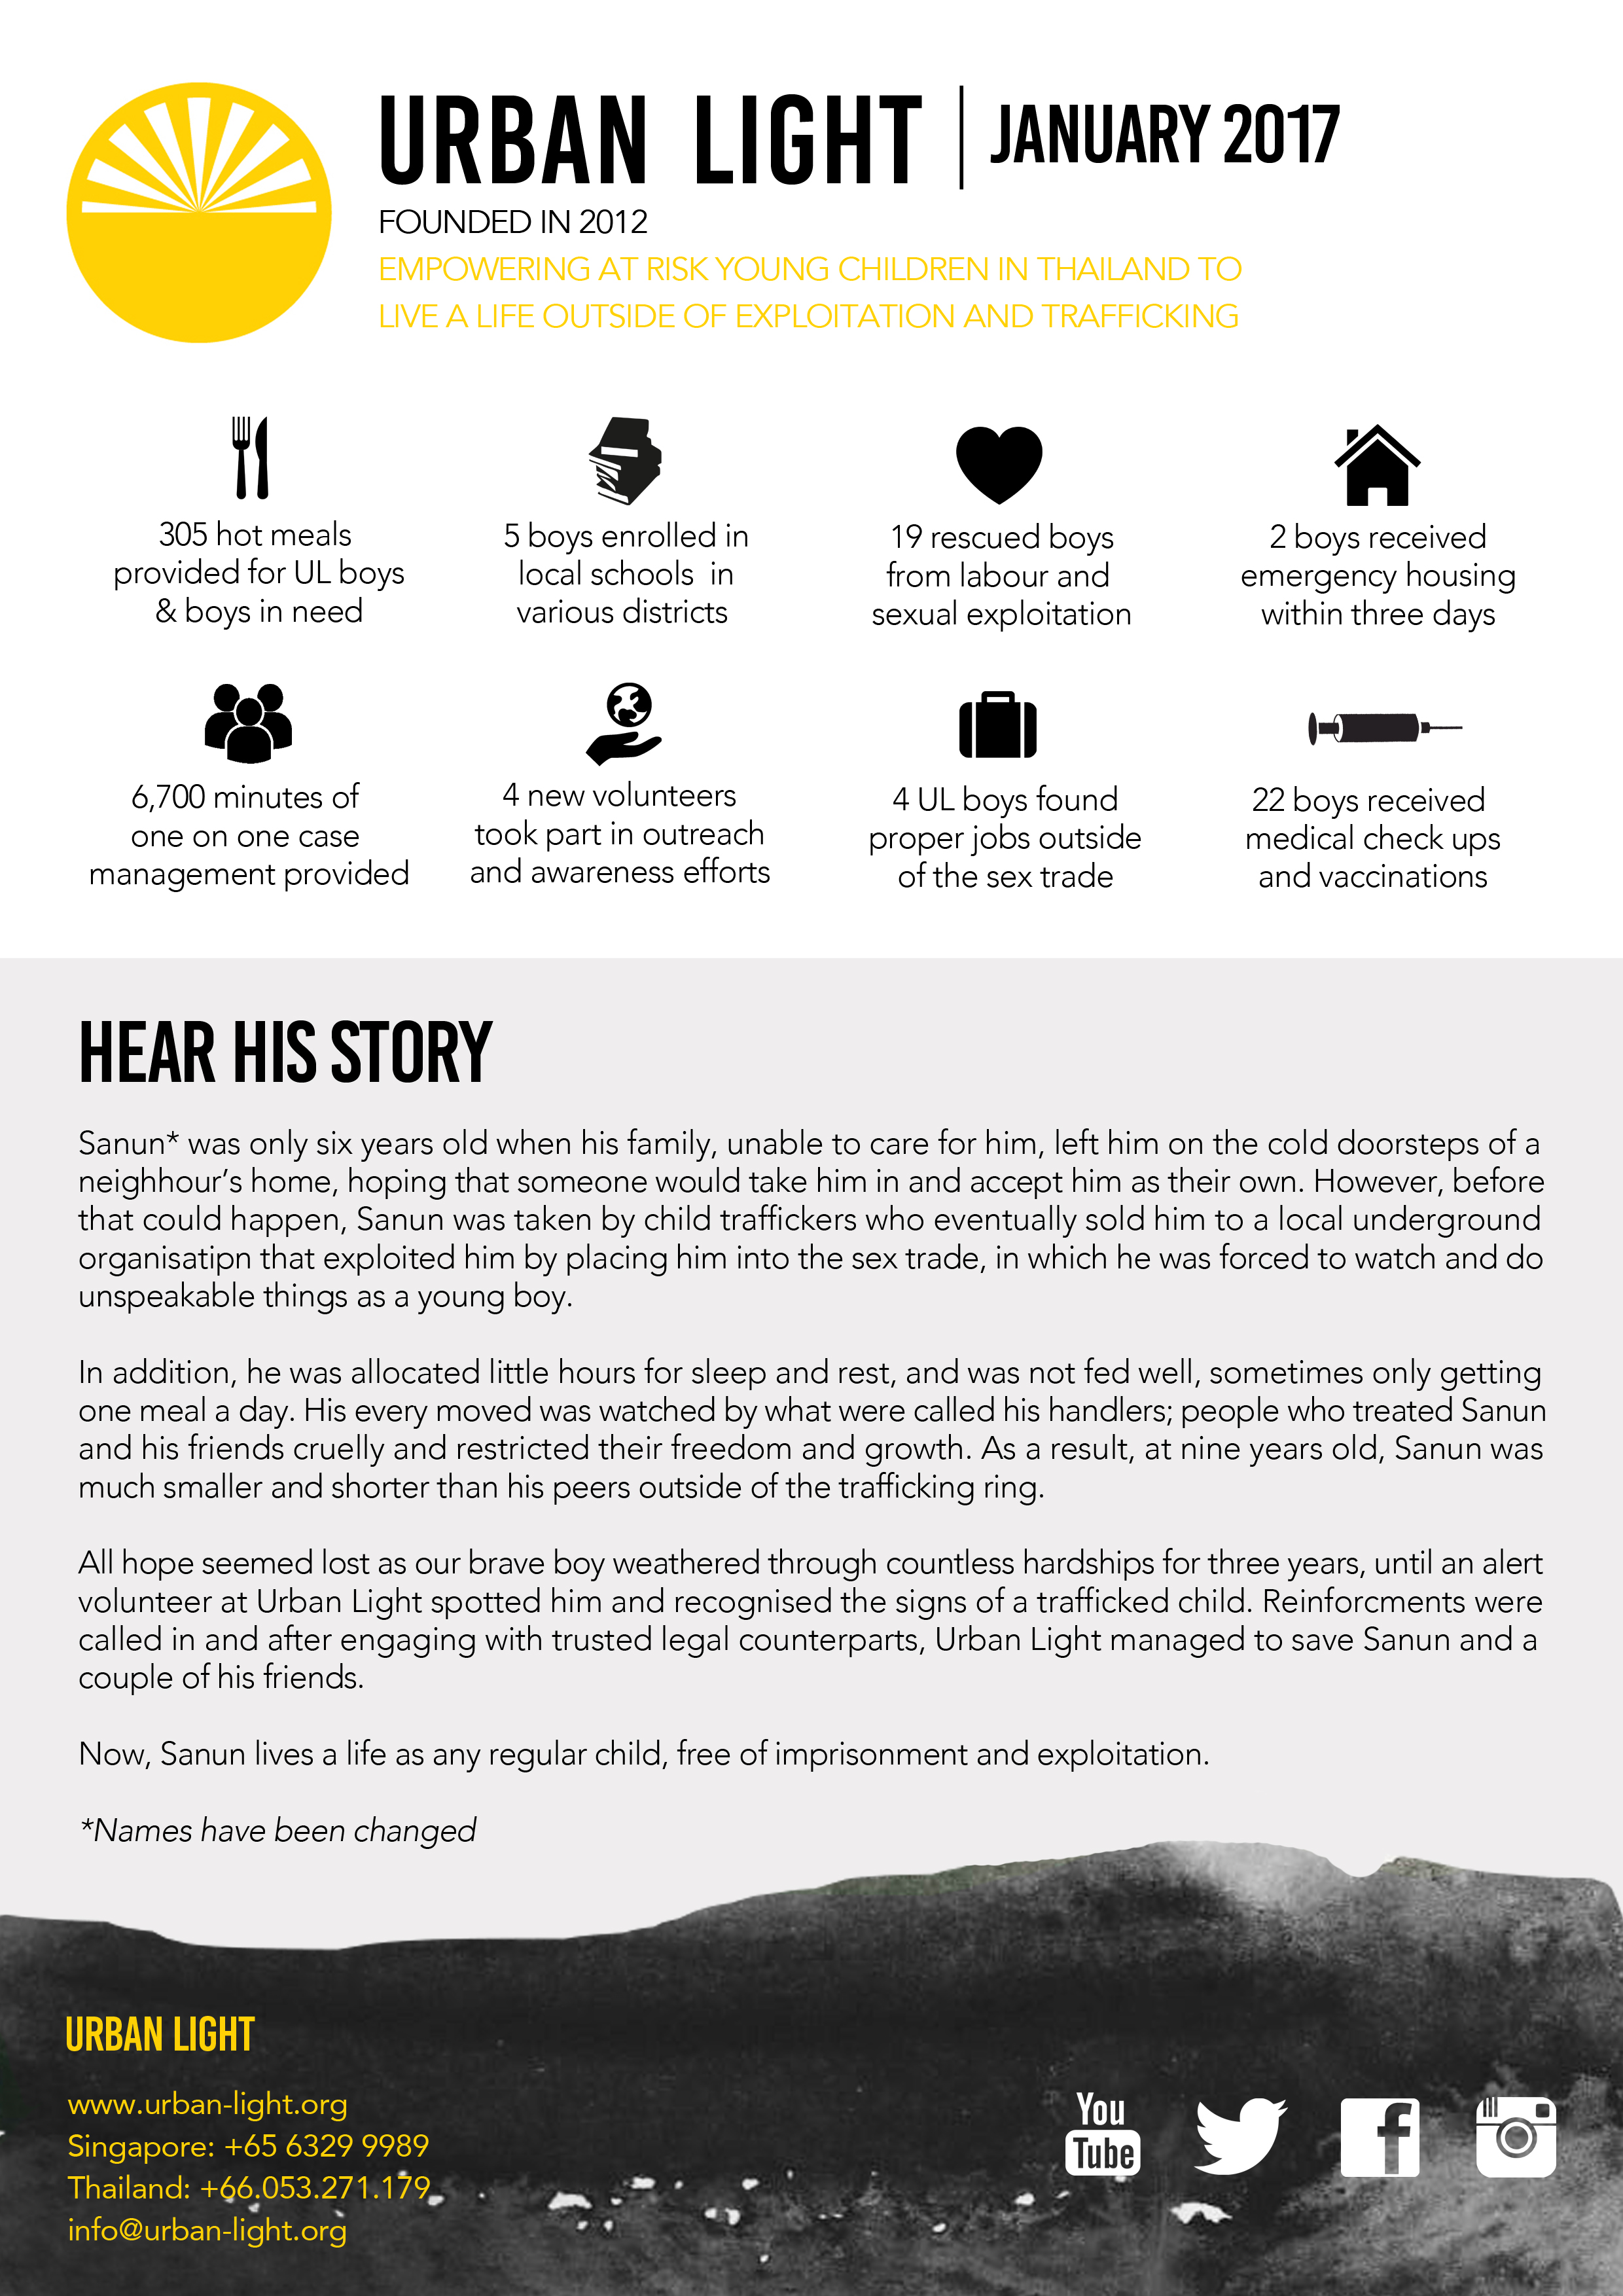
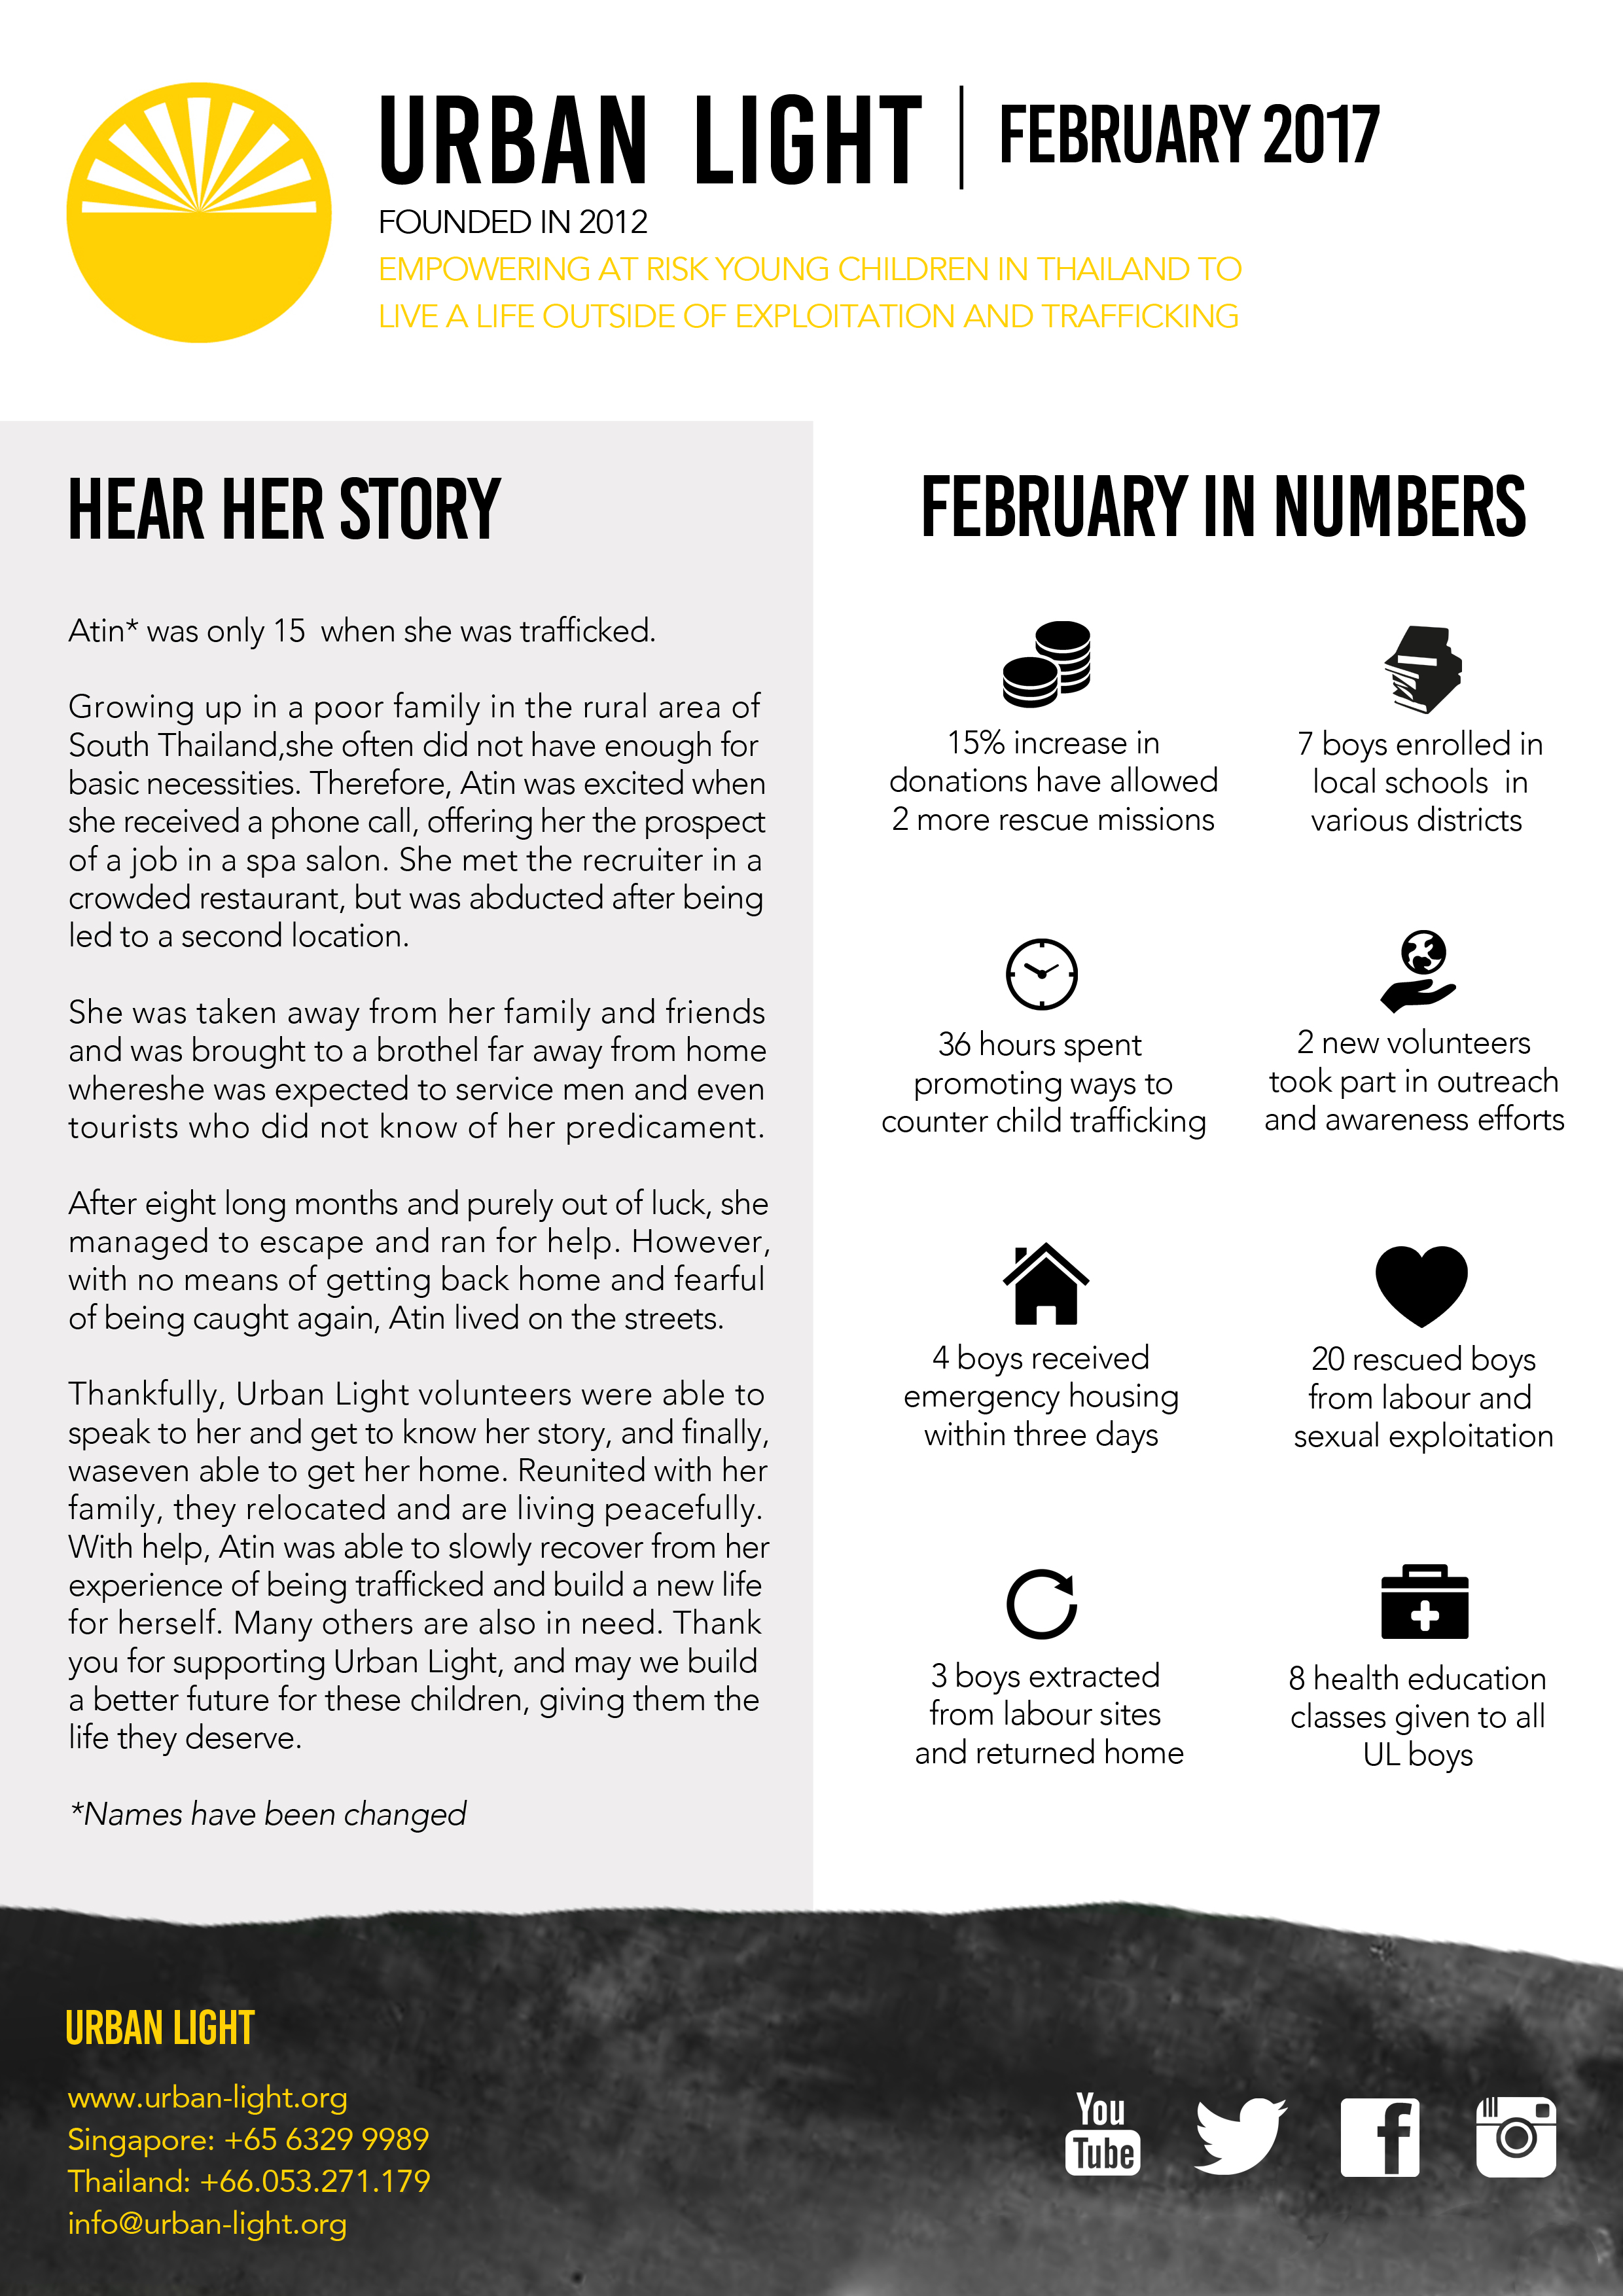
After that, to tie the whole project together, I created a monthly newsletter that would be mailed either physically or online to people who have helped in any way, whether they volunteered or donated, etc. This would allow them to see how their efforts have contributed to the organisation working against child trafficking, so it would provide some encouragement to show that their efforts were not in vain. 

I chose to ‘partner’ Urban Light, an organisation working in Thailand, and came up with newsletters for the months of January and February 2017 as examples. Some of the information I found on the Urban Light website, some I adapted, and others are based on information from other sites.

Here are some photos from the exhibition! These show the final outcome of this project after printing.

Octavia – Process

I chose Octavia because I liked the idea of a hanging city, fragile and beautiful in disguise. To me, it was both unique and deadly at the same time. The passage by Italo Calvino can be found below:

“If you choose to believe me, good. Now I will tell you how Octavia, the spider-web city, is made. There is a precipice between two steep mountains: the city is over the void, bound to the two crests with ropes and chains and catwalks. You walk on the little wooden ties, careful not to set your foot in the open spaces, or you cling to the hempen strands. Below there is nothing for hundreds and hundreds of feet: a few clouds glide past; farther down you can glimpse the chasm’s bed.

This is the foundation of the city: a net which serves as passage and as support. All the rest, instead of rising up, is hung below: rope ladders, hammocks, houses made like sacks, clothes hangers, terraces like gondolas, skins of water, gas jets, spits, baskets on strings, dumb-waiters, showers, trapezes and rings for children’s games, cable cars, chandeliers, pots with trailing plants.
Suspended over the abyss, the life of Octavia’s inhabitants is less uncertain than in other cities. They know the net will only last so long.
What stood out to me immediately was the sense of loss and death inferred from the last line of the passage, whereby the inhabitants know that the location is dangerous and one day, they could all fall.
I began by searching for visual inspiration online, to see what others thought the city looked like.
After getting inspiration from these sources, I decided I wanted to play with string as a medium, given that string and rope were the very elements that gave and controlled life and death of the city. Then, I also thought of the causes of death, and instead of the inhabitants falling off that caused the entire city’s demise, I came up with my own statistics and thought that it would be interesting if something else caused the all the deaths, and I wanted it to be also related to the entire structure falling. Therefore, I reached a conclusion that fire would be the cause.
I started by drawing out and making notes, creating statistics that recorded all the deaths in the city. And where there is death, there is life. So I also wanted the births of babies in Octavia to be noted down as well.
In the end, I came up with a booklet, sort of like an old fashioned hand made journal (given that Octavia was supposed to be read to Kublai Khan, who was alive in 1200s. The entire book was envisioned to be very tactile and physical, instead of a softcopy.
Below are the photos of the pages of the book, with each page showing three months of the year, as well as documenting the different seasons and timeline (it’s over a year because a typical industrial rope would usually last about a year if used daily), so one could see the relation between deaths and time.

Postcard Tracking Trash

1 2

Here’s my postcard for Week 7, tracking trash. I’ve tried to track my trash and the rate and things I’ve thrown away over Wednesday, Thursday, Friday and Saturday, and have discovered that I throw away most of plastic food wrappers and paper, like tissue paper and toilet paper. By circumstances, the third most common item I threw away over the week was sanitary pads, which I now know takes at least 500 – 800 years to decompose!

Postcard – Social Media Tracking

So I tracked my social media usage from 8/2/2017 to 13/2/2017, which was the Wednesday after class on Tuesday, all the way up to the following Monday. Some findings were that the top three most used applications for me was Instagram, Whatsapp and Facebook. I also frequently used Spotify, YouTube and Telegram (all in consecutive order), but I guess for this particular week it was the first three listed that came up tops! I also found that the amount of time I used on any particular app is relative to the amount of free time I had on my hands (e.g. when I’m not working my part time job or when I’m on the train), and if I used less of Instagram any particular day, chances are that I used less of Whatsapp and Facebook as well.

dsc_0464-copy

dsc_0465-copy

Water Postcard

Here’s my postcard for water! I did this over 30 minutes while hand washing clothes in the tub (probably lasted a little too long because I got carried away and forgot I was soaking the clothes, but oh well). Each line is an interval of 30 seconds. The silver lines represents clean water and the black lines show when the water turns dark because of the blue dye. The length of the lines also represent the amount of water in the tub at any given point in time, and the little blue circles are the number of bubbles present.

unnamed-1 unnamed