Hello from after recess week! Here’s my postcard for our weekly Dear Data, this time tracking stress.
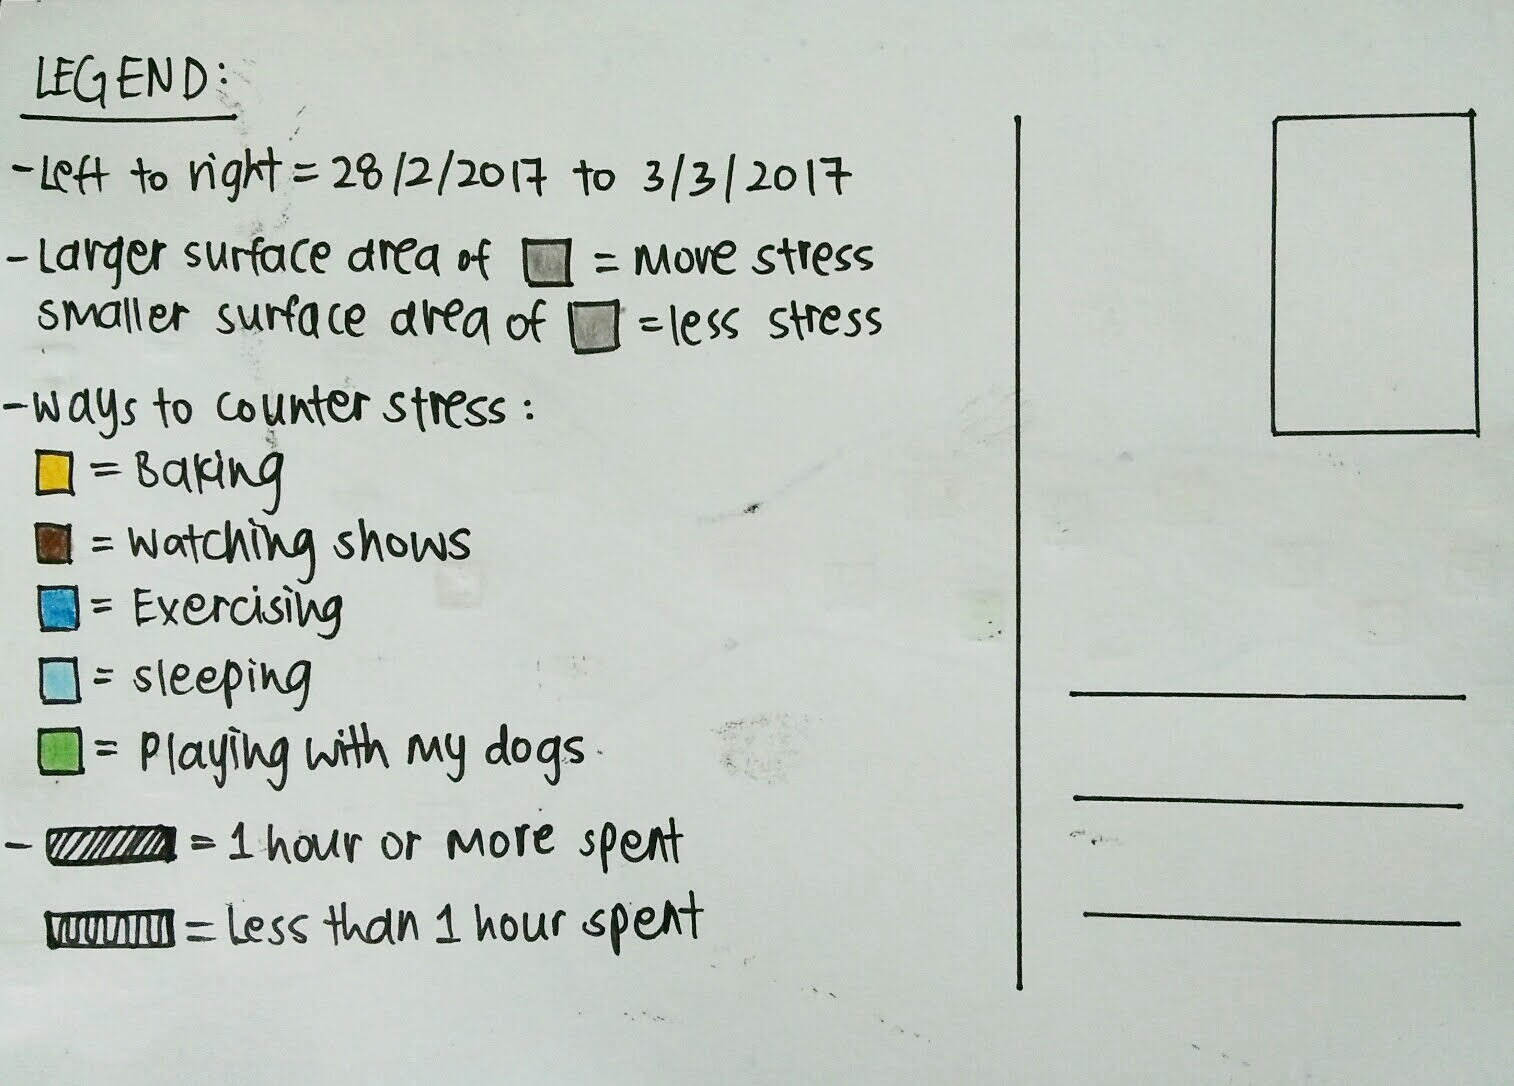
Hello from after recess week! Here’s my postcard for our weekly Dear Data, this time tracking stress.
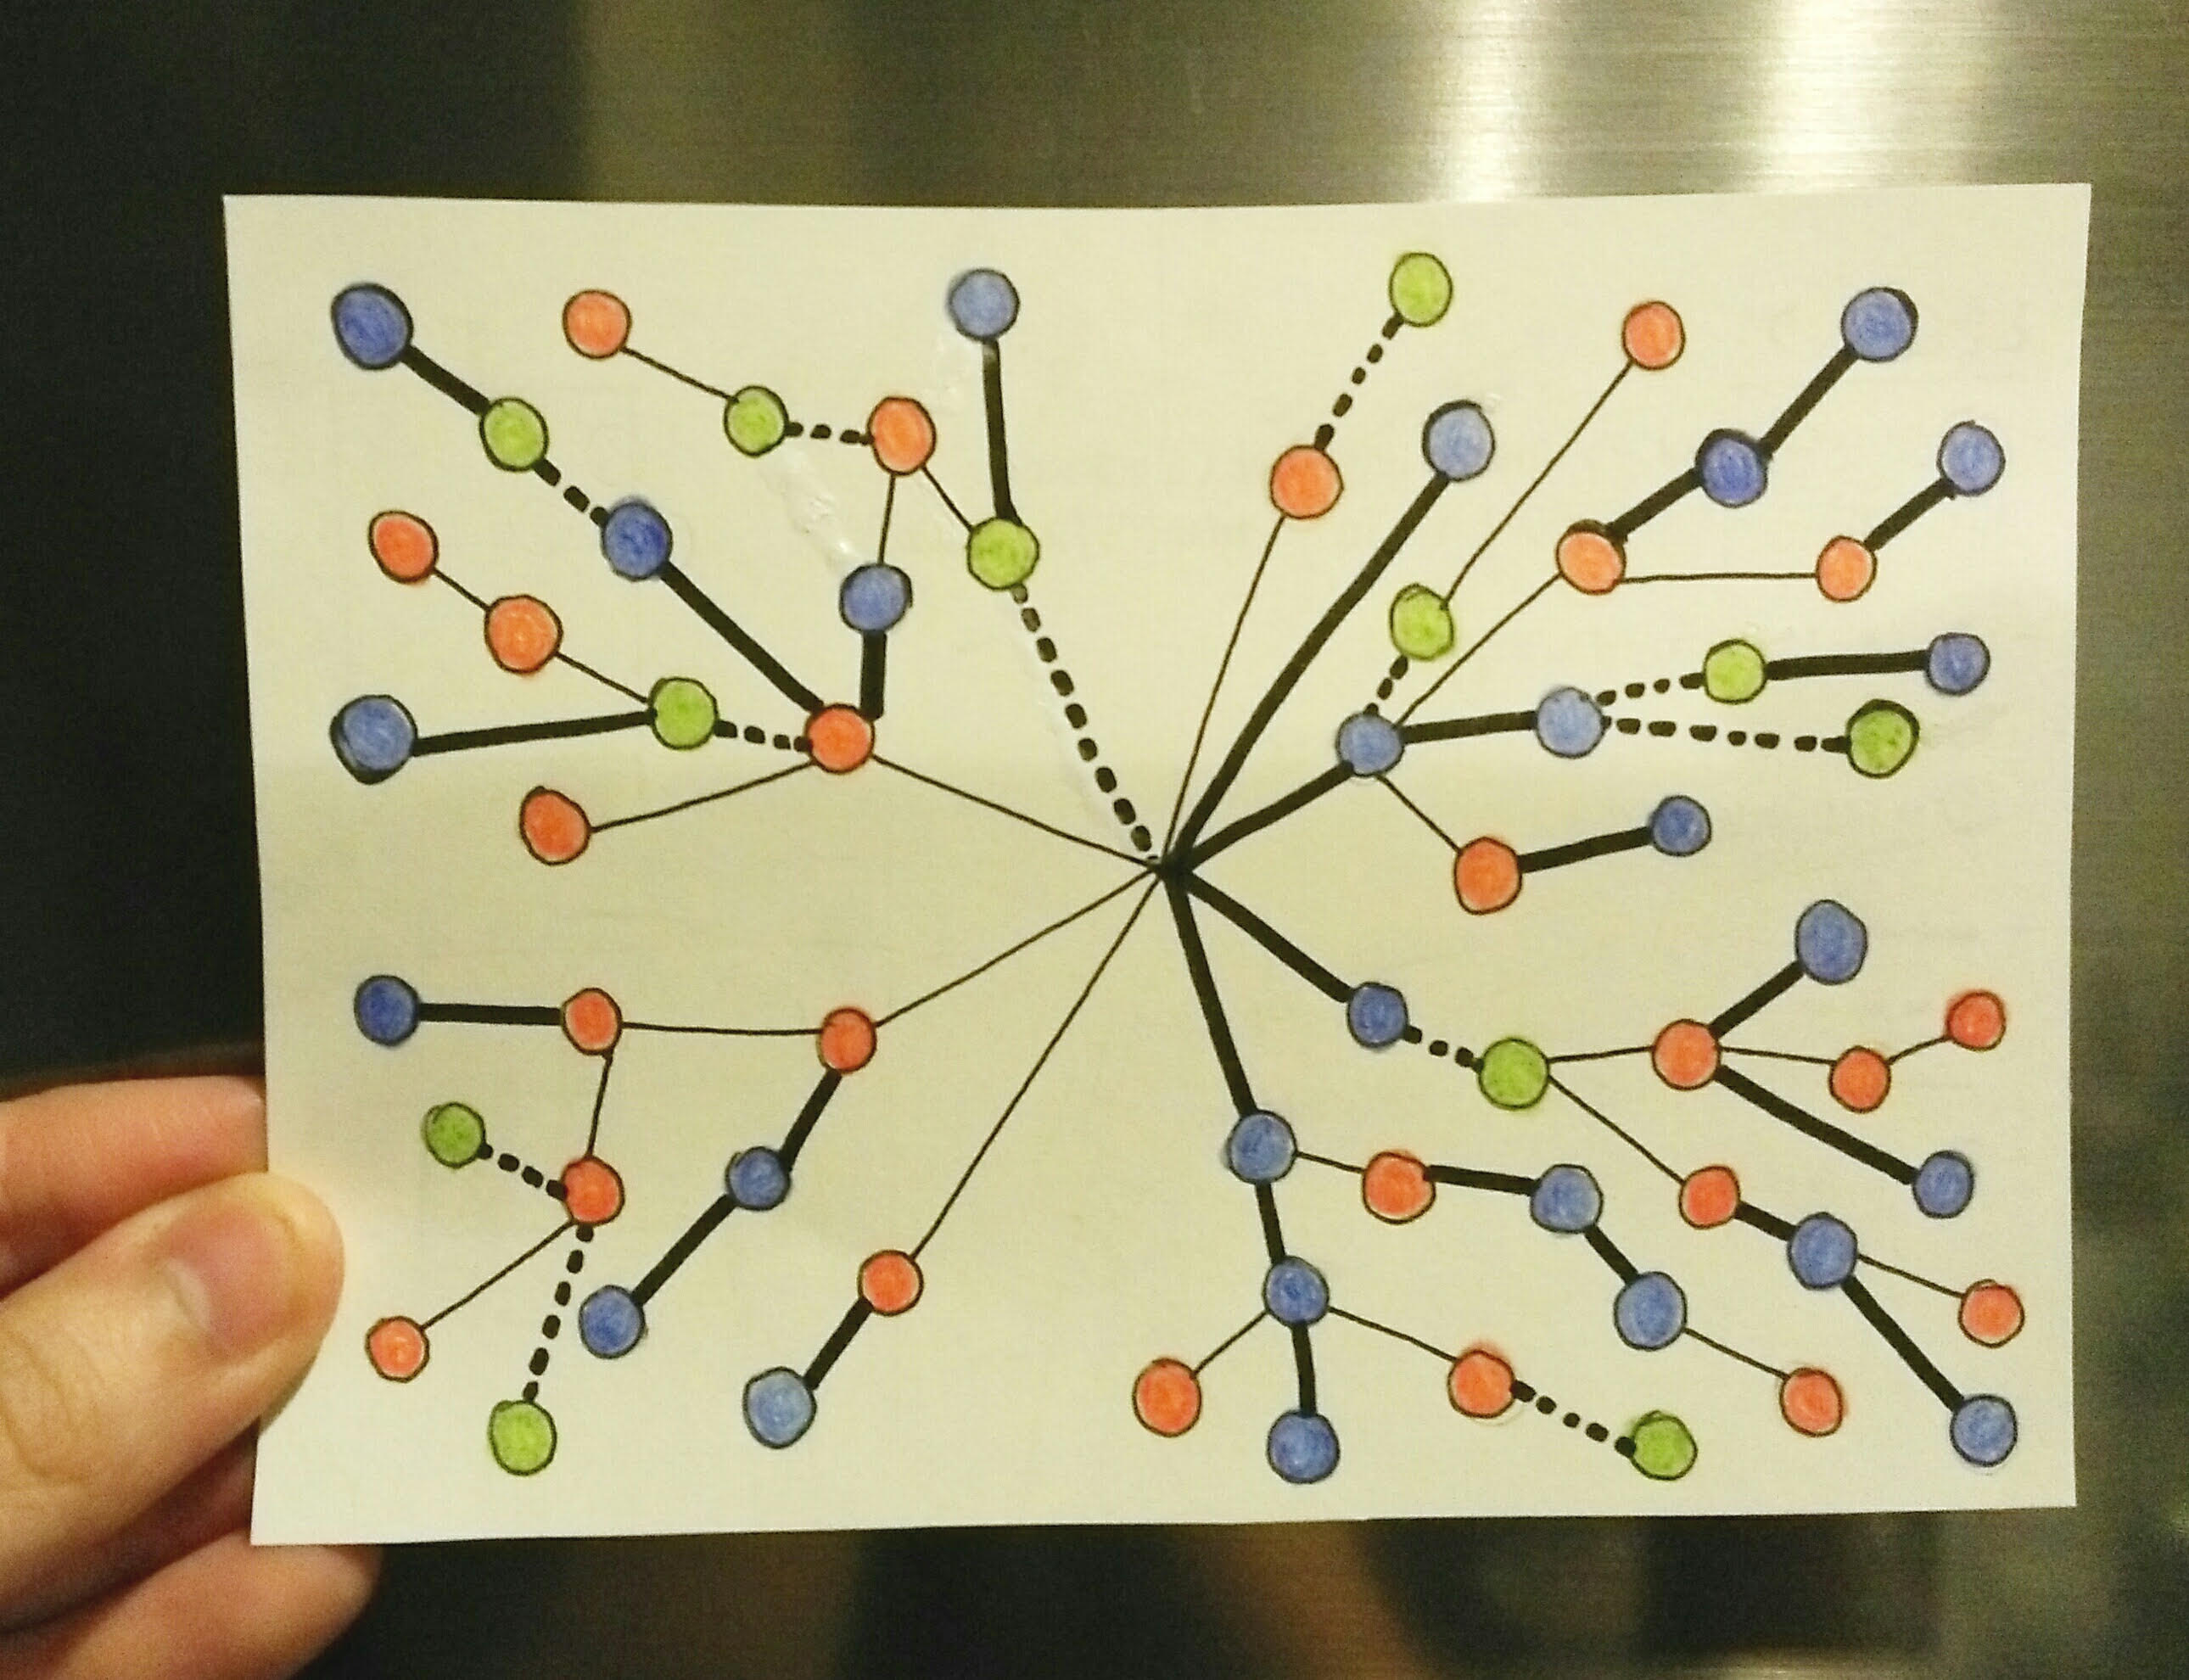
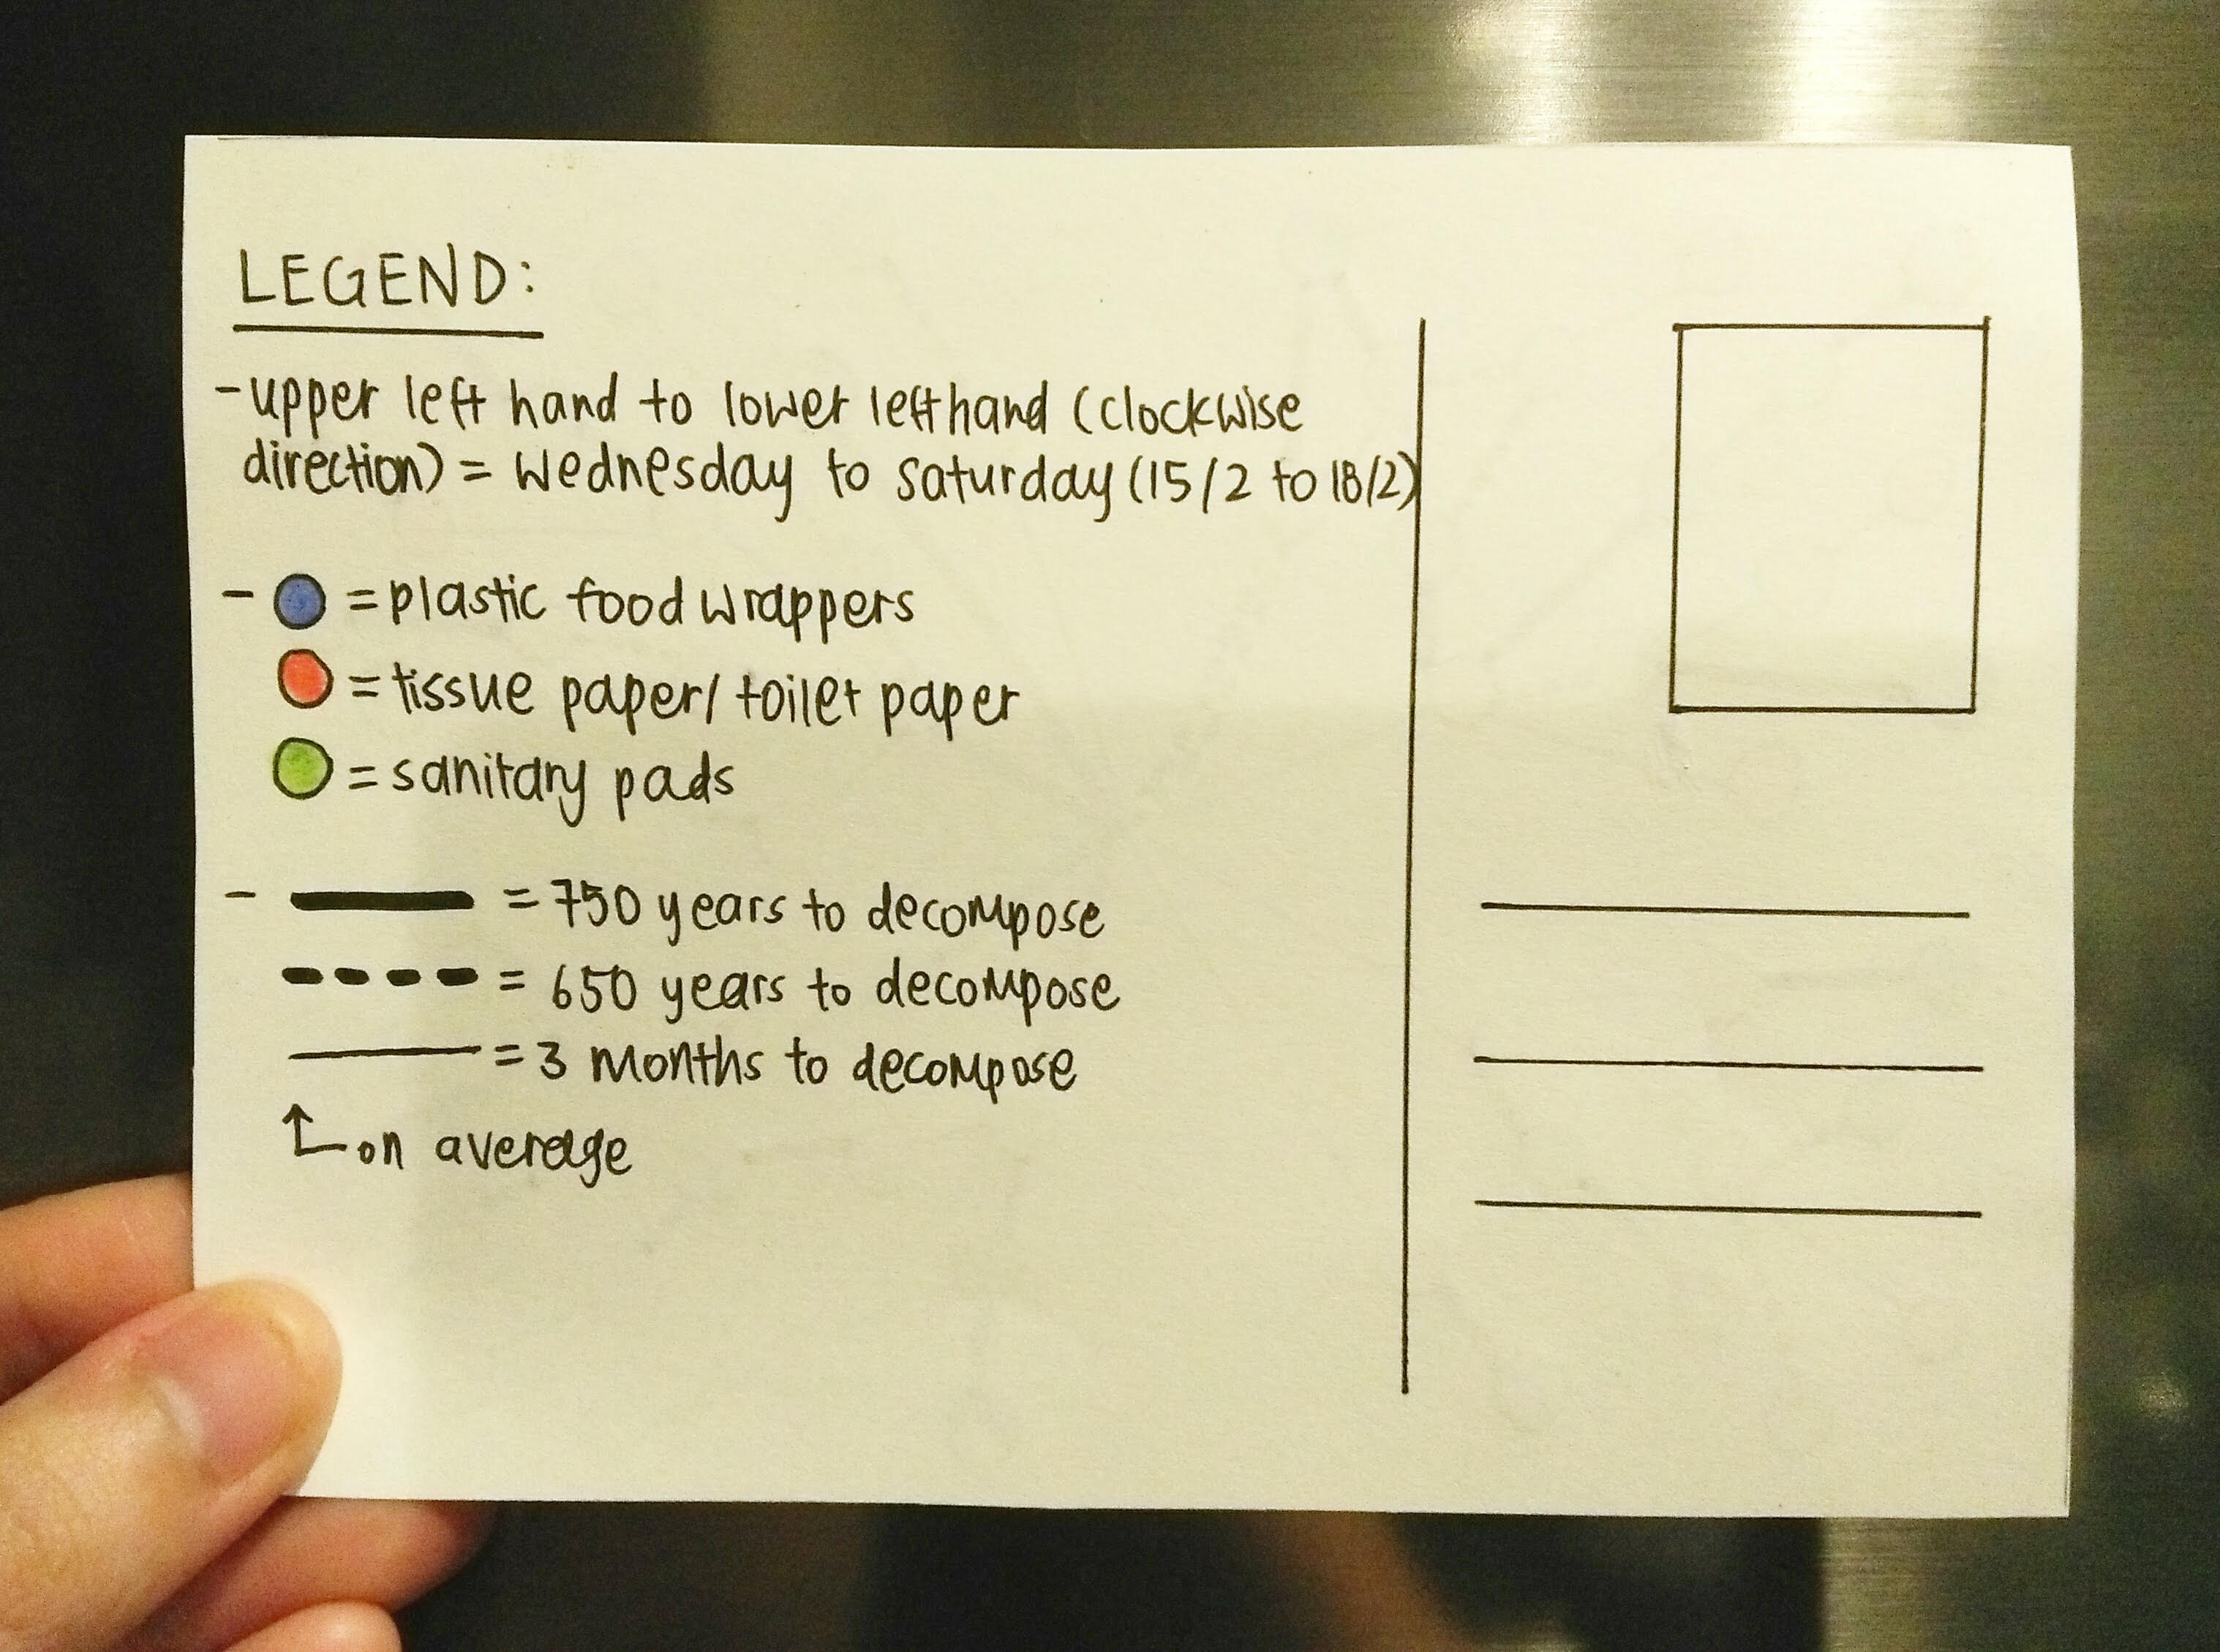
Here’s my postcard for Week 7, tracking trash. I’ve tried to track my trash and the rate and things I’ve thrown away over Wednesday, Thursday, Friday and Saturday, and have discovered that I throw away most of plastic food wrappers and paper, like tissue paper and toilet paper. By circumstances, the third most common item I threw away over the week was sanitary pads, which I now know takes at least 500 – 800 years to decompose!
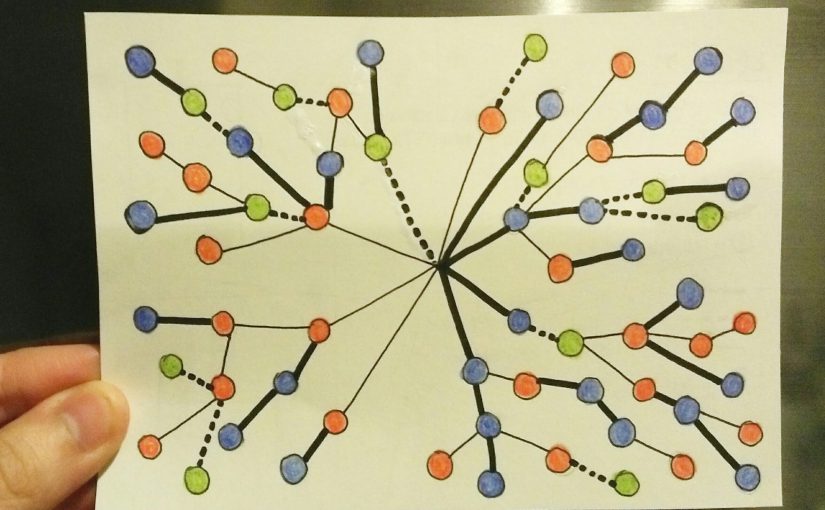
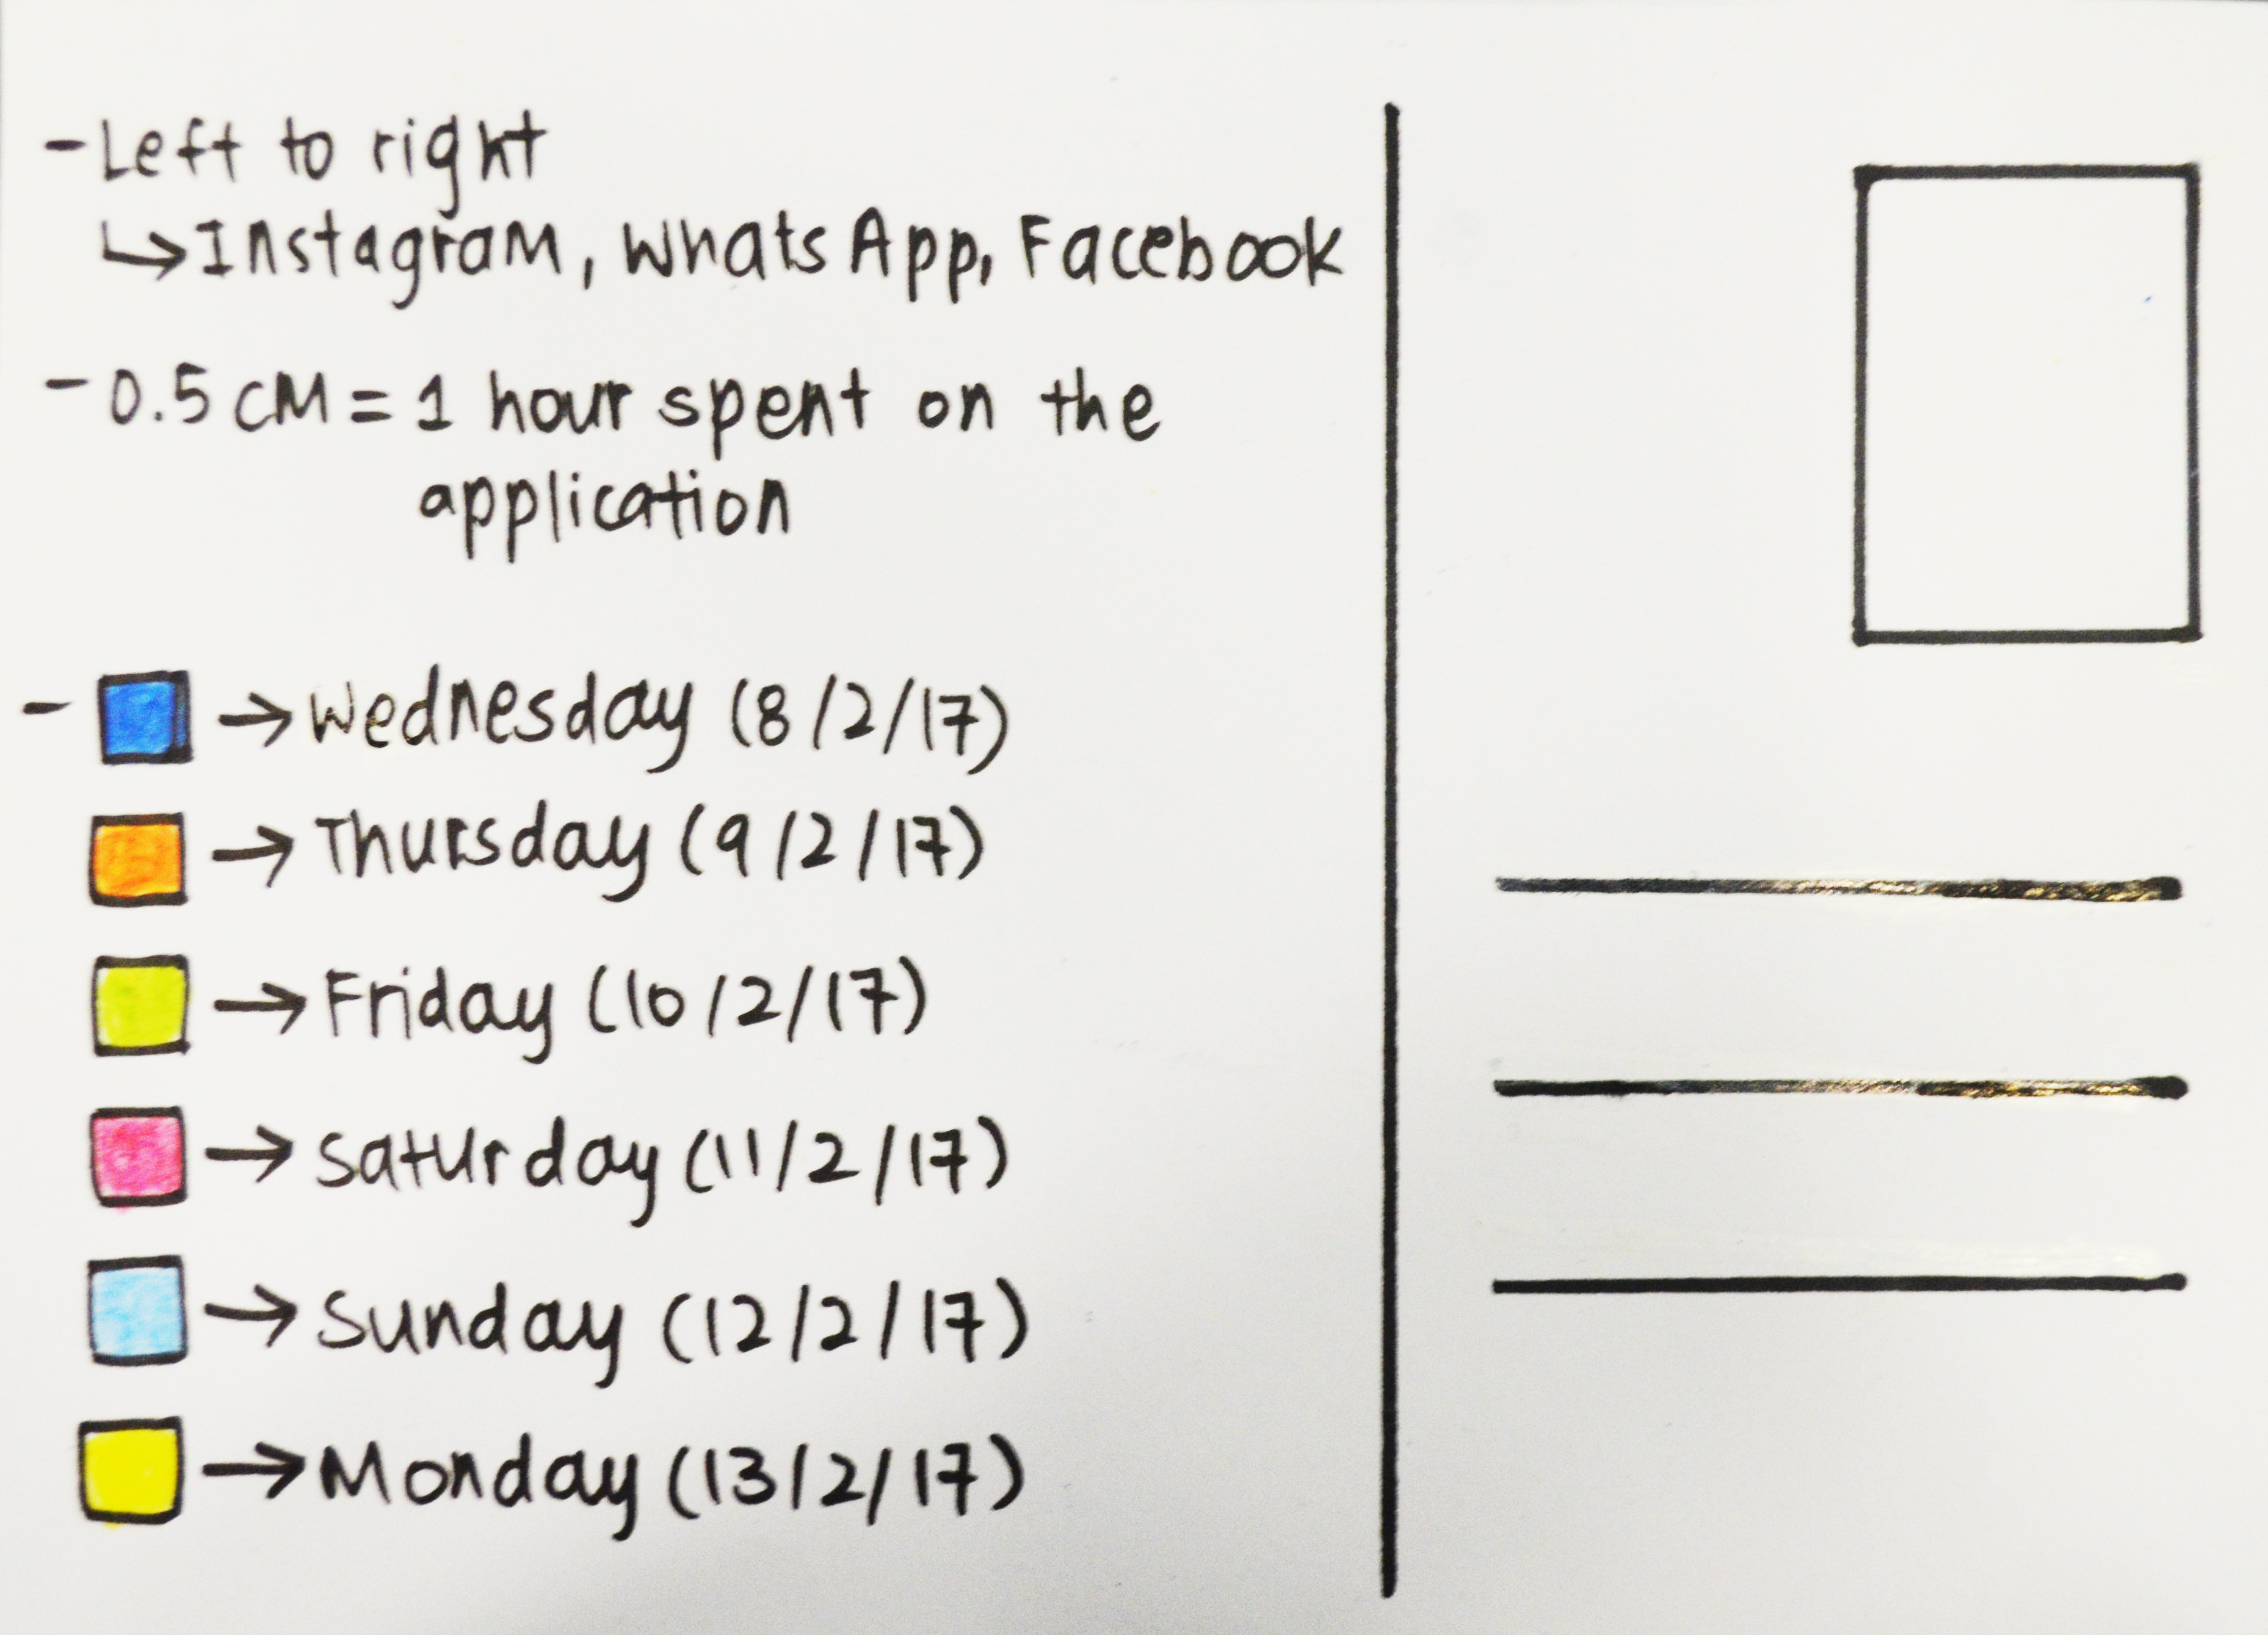
So I tracked my social media usage from 8/2/2017 to 13/2/2017, which was the Wednesday after class on Tuesday, all the way up to the following Monday. Some findings were that the top three most used applications for me was Instagram, Whatsapp and Facebook. I also frequently used Spotify, YouTube and Telegram (all in consecutive order), but I guess for this particular week it was the first three listed that came up tops! I also found that the amount of time I used on any particular app is relative to the amount of free time I had on my hands (e.g. when I’m not working my part time job or when I’m on the train), and if I used less of Instagram any particular day, chances are that I used less of Whatsapp and Facebook as well.
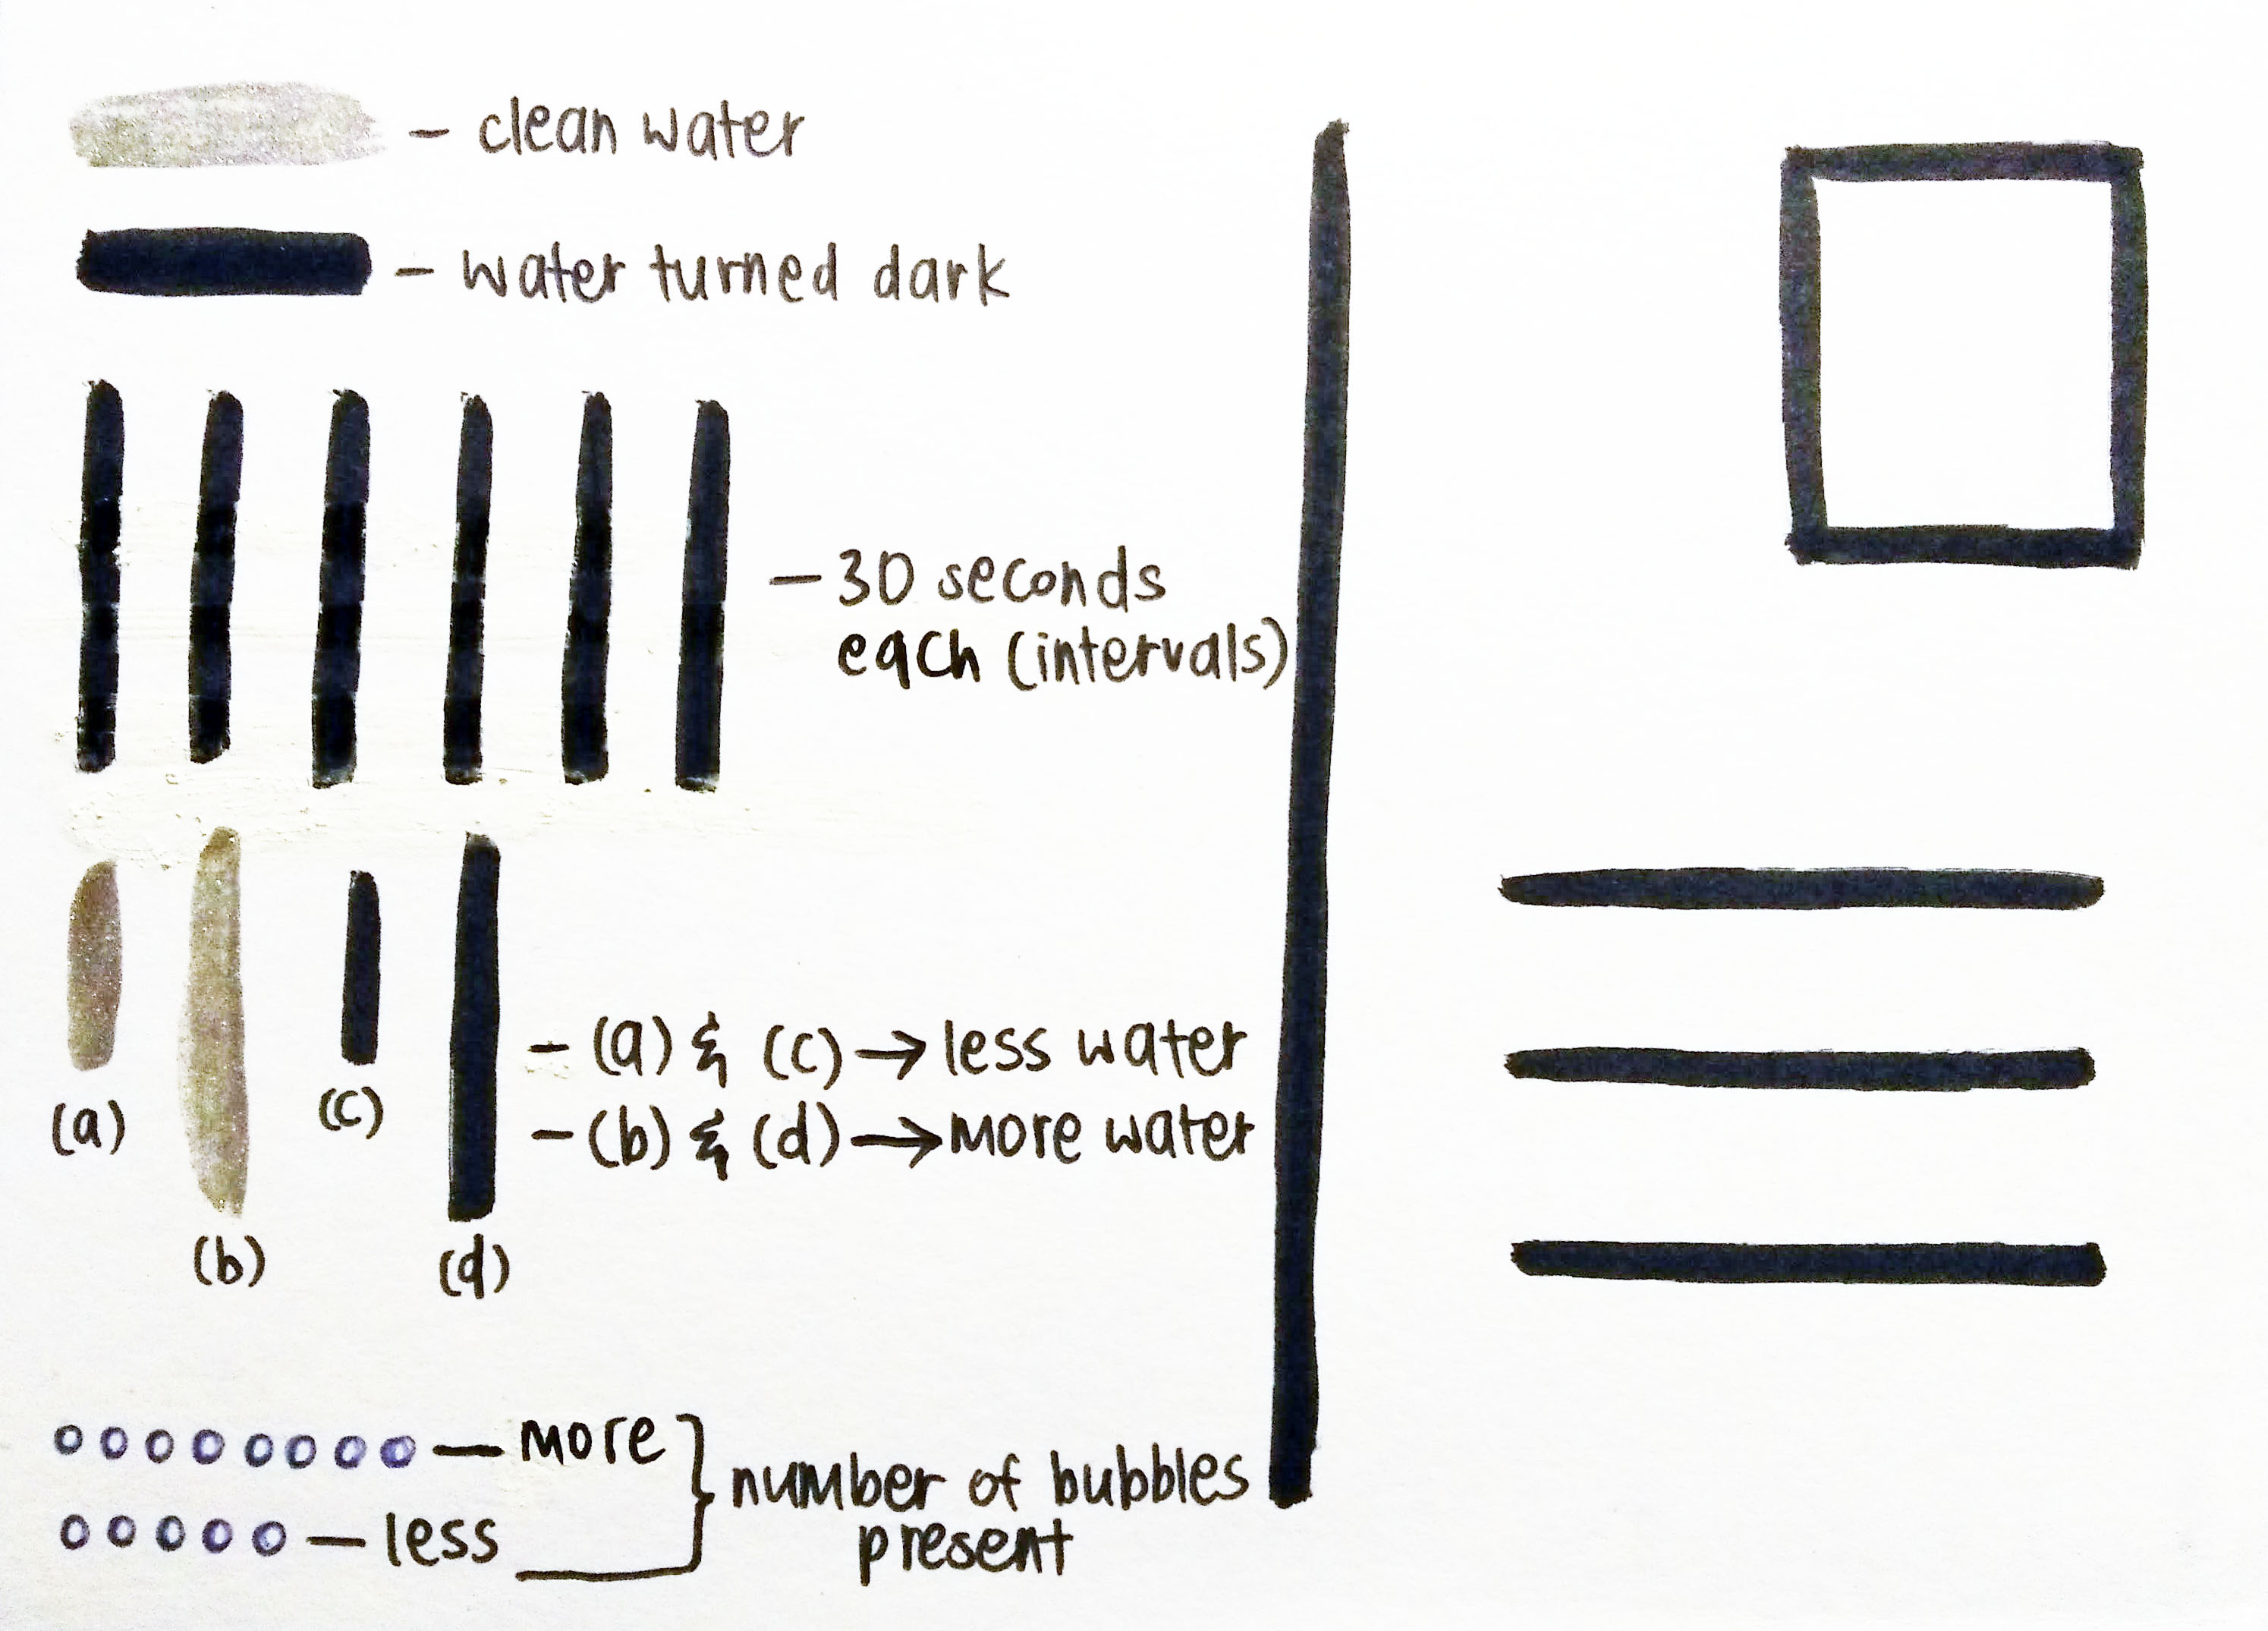
Here’s my postcard for water! I did this over 30 minutes while hand washing clothes in the tub (probably lasted a little too long because I got carried away and forgot I was soaking the clothes, but oh well). Each line is an interval of 30 seconds. The silver lines represents clean water and the black lines show when the water turns dark because of the blue dye. The length of the lines also represent the amount of water in the tub at any given point in time, and the little blue circles are the number of bubbles present.

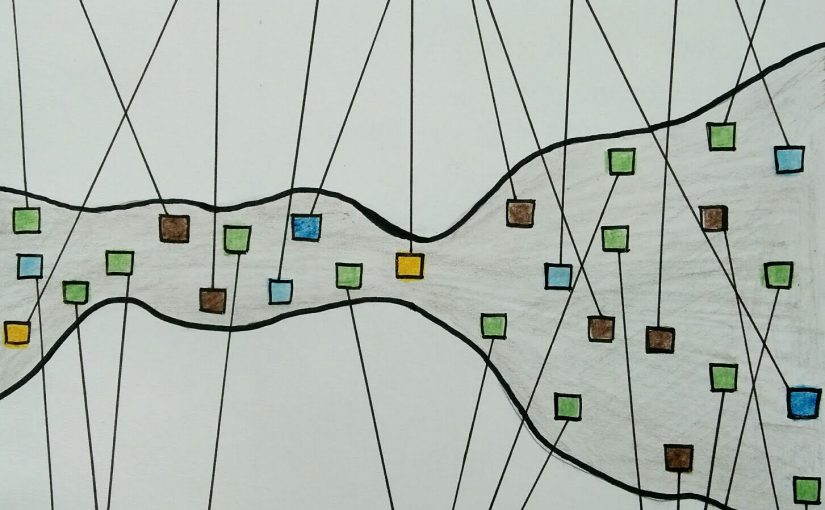
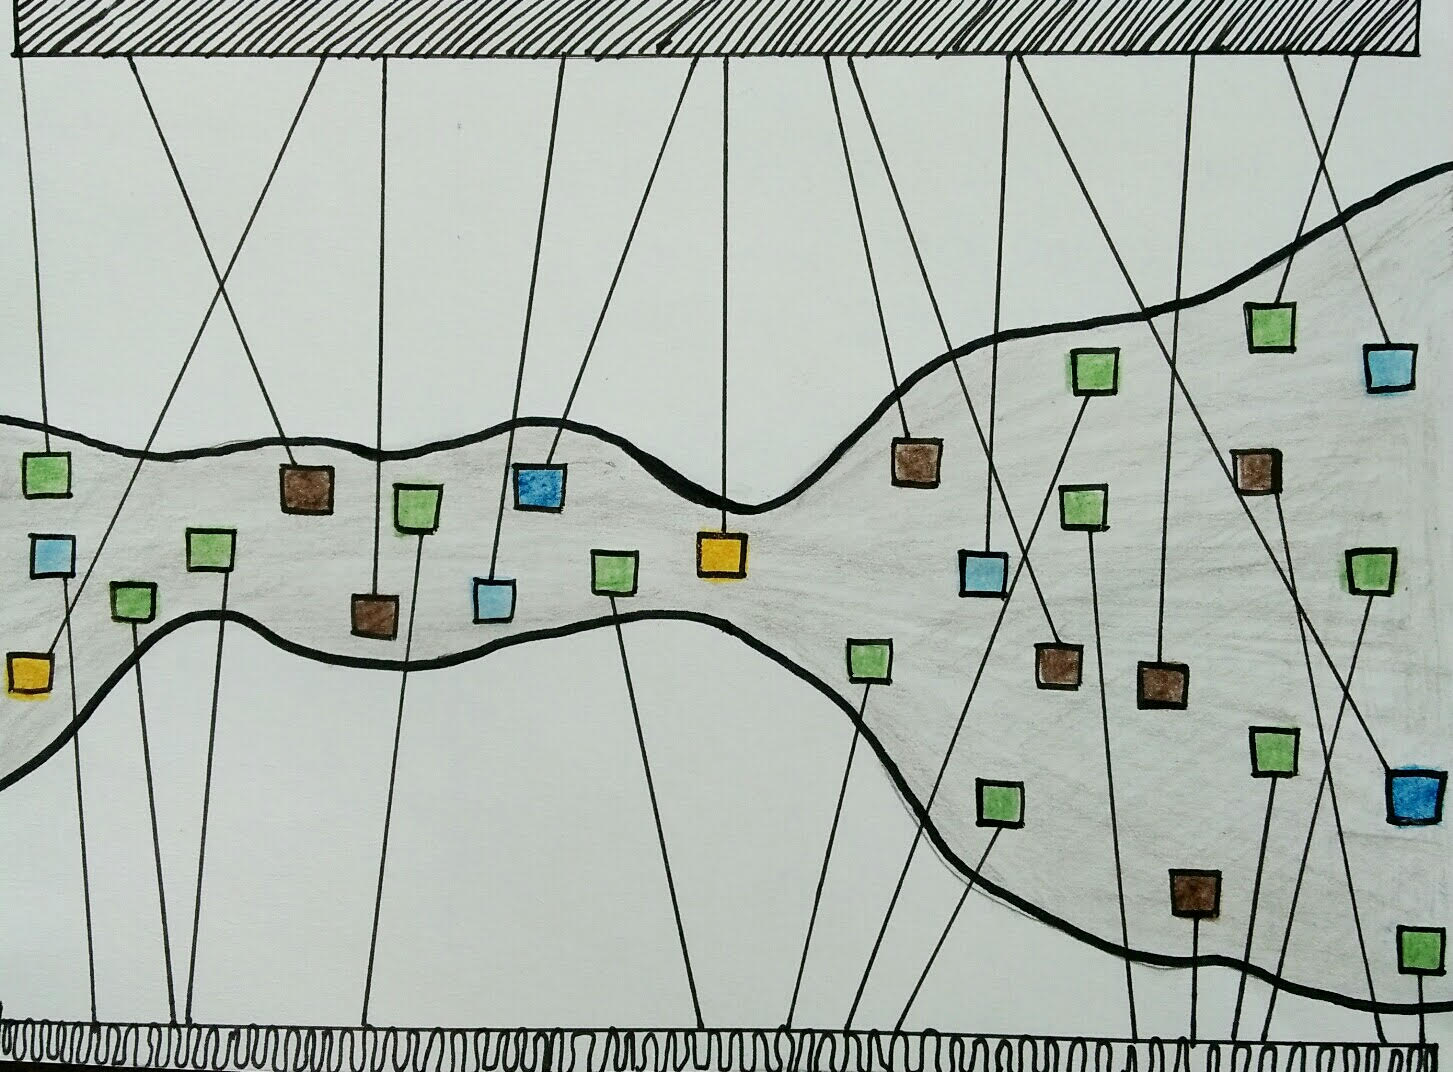
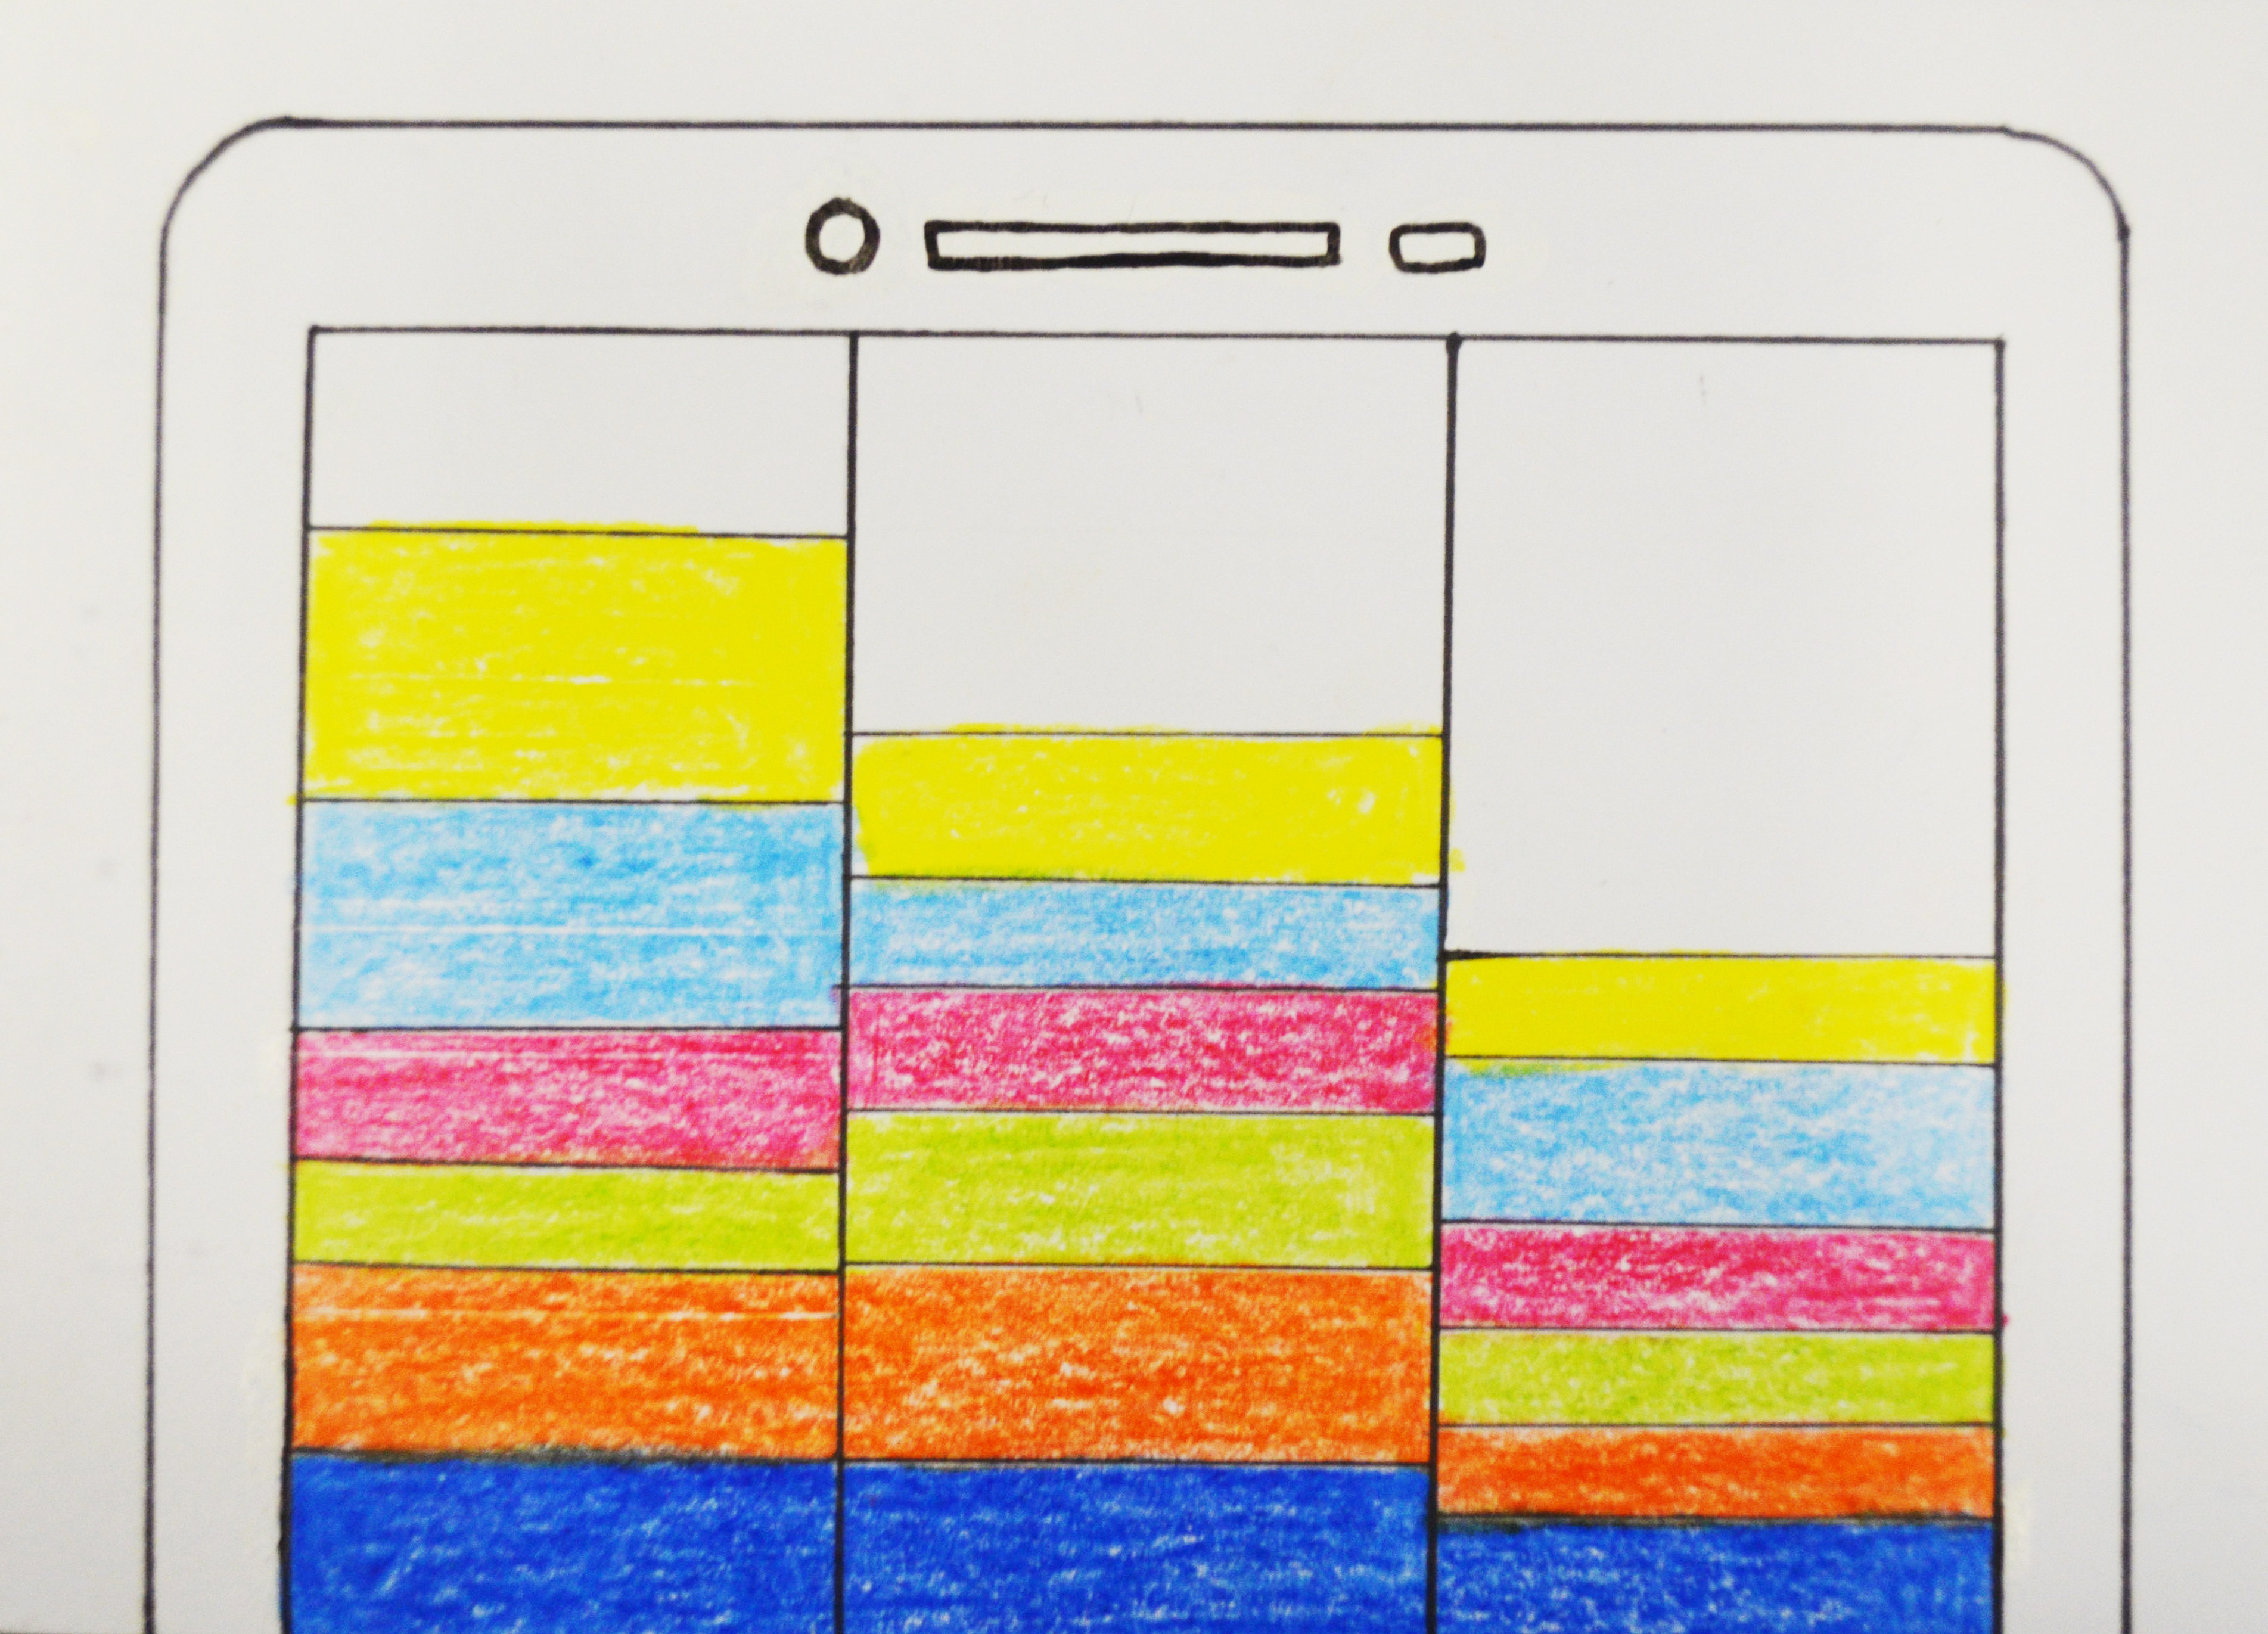
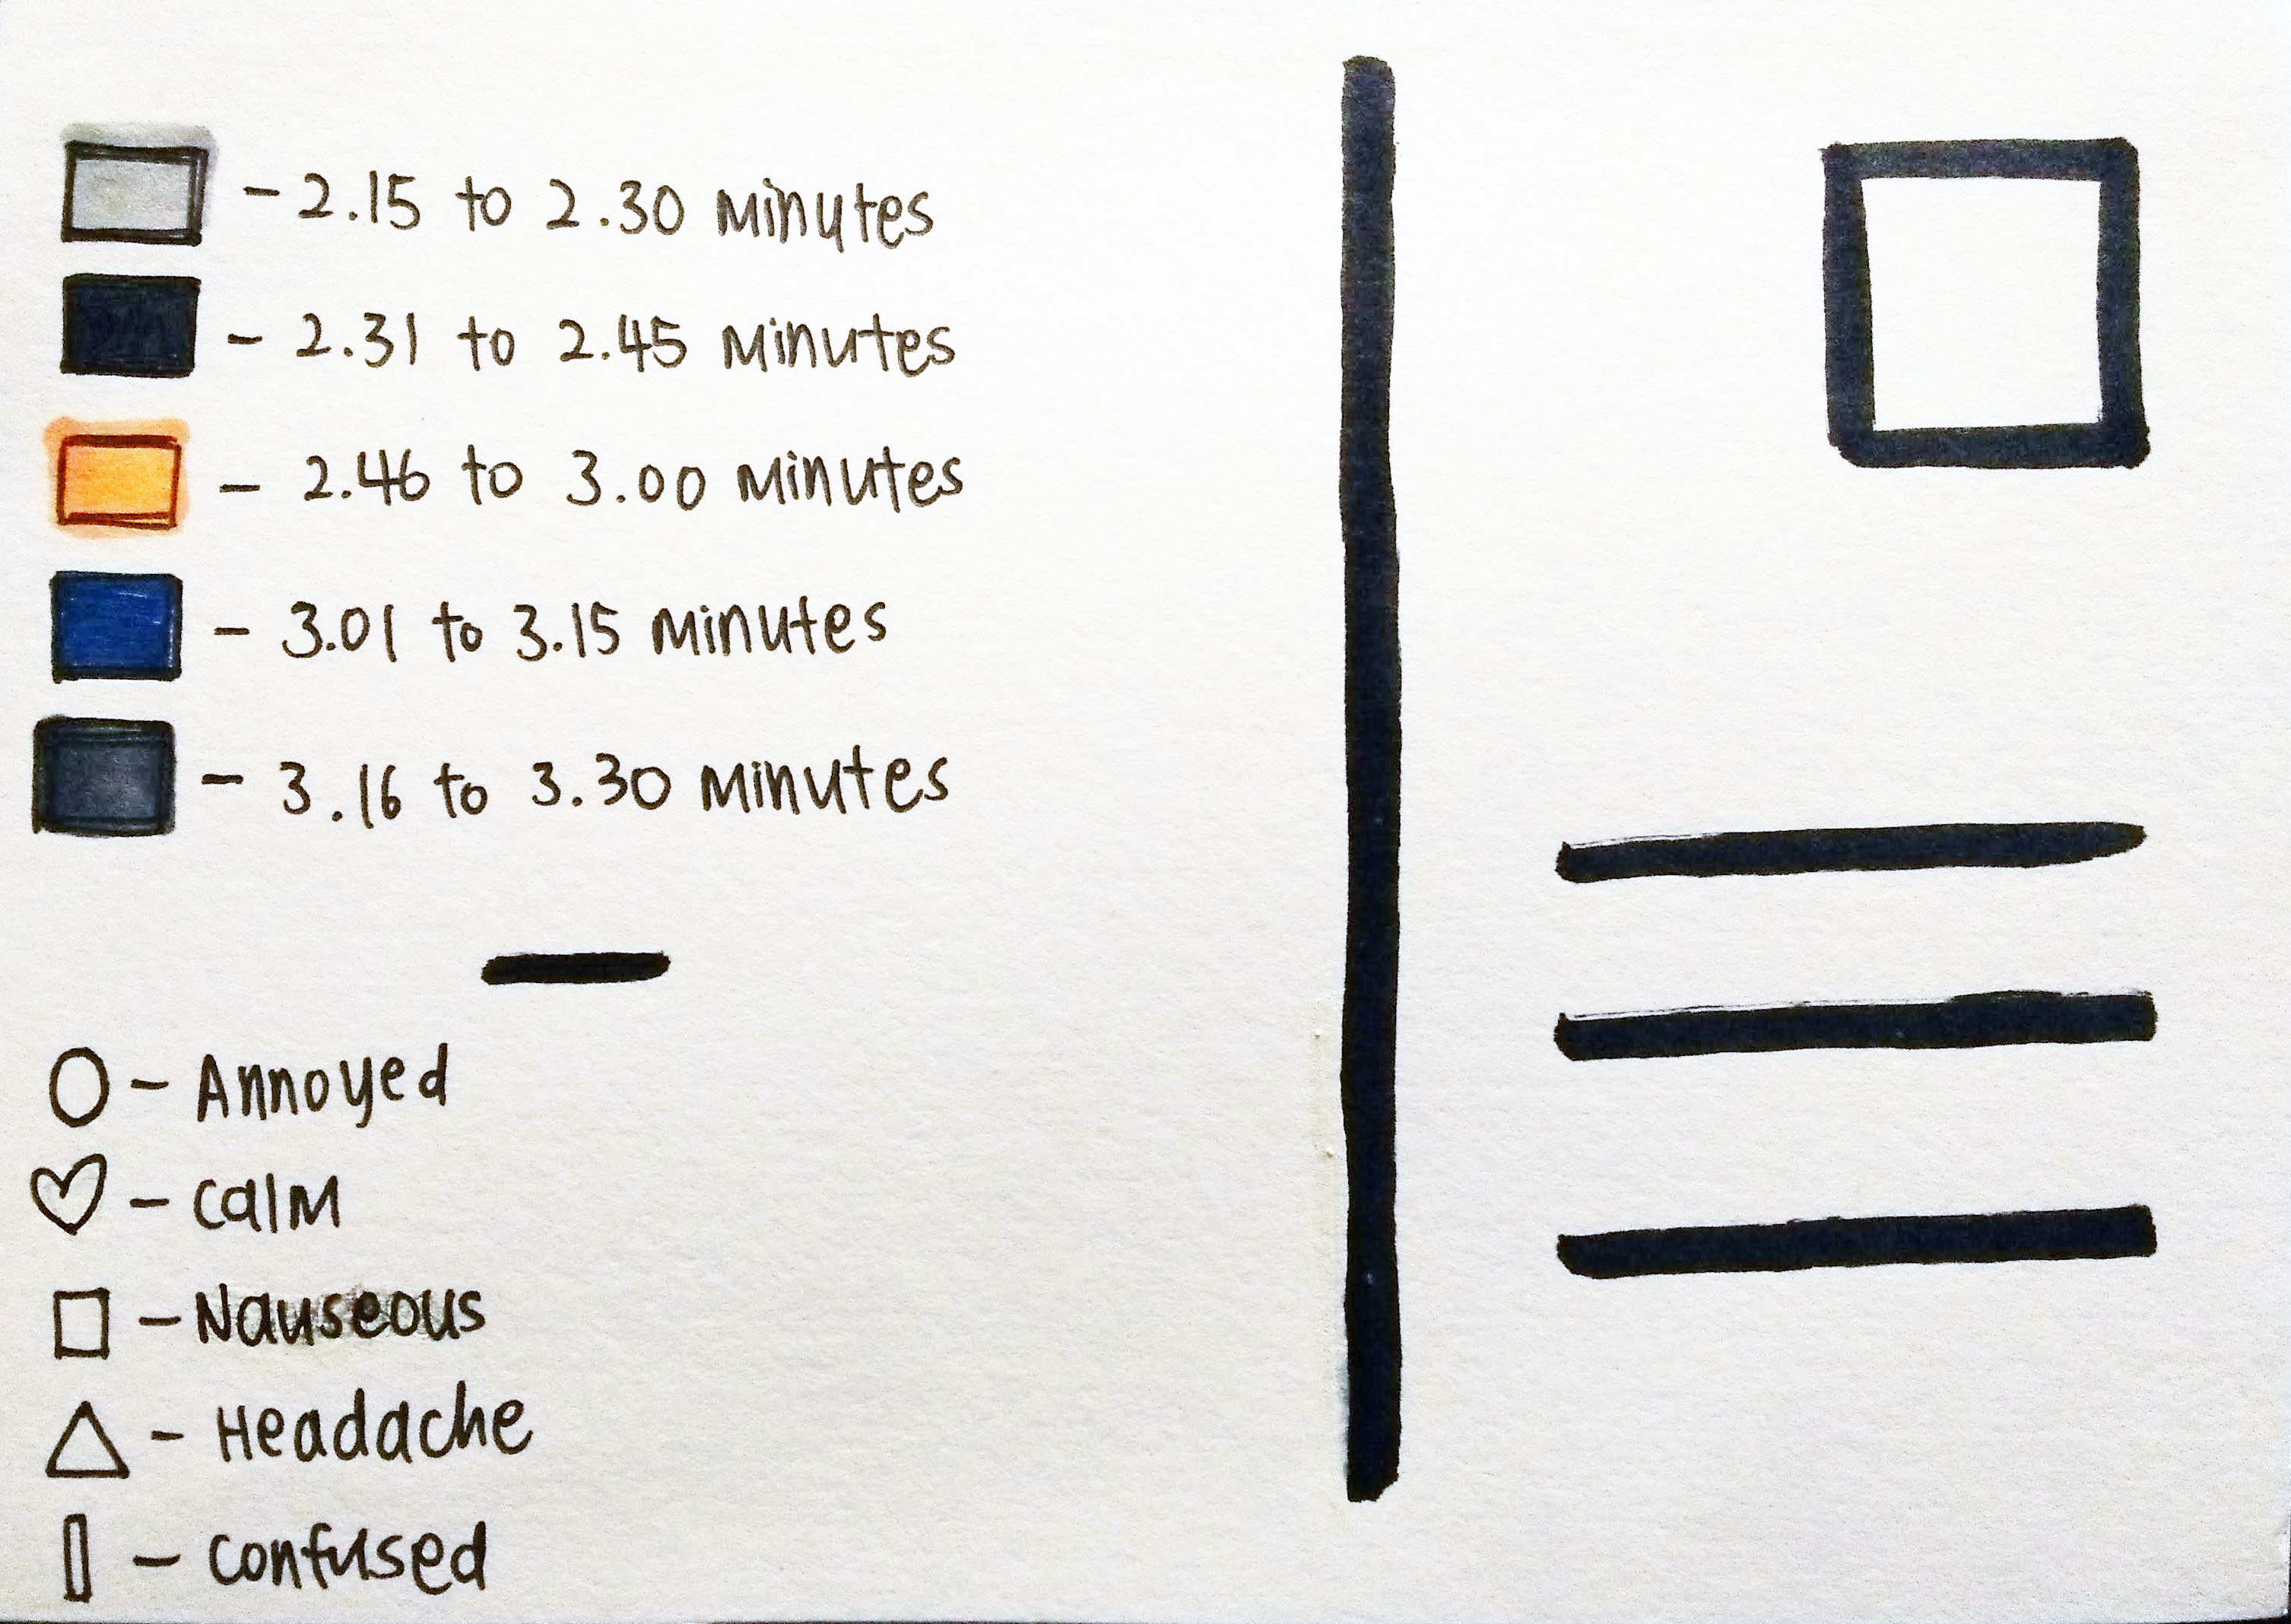
Here is my postcard for visualising sound according to Triohatala by Stimmhorn. I categorised them into various colours to represent the time frame (I chose to listen to 2:15 to 3:30 minutes) by the block, and to incorporate how I felt while listening to it into the postcard as well.

Hello again!
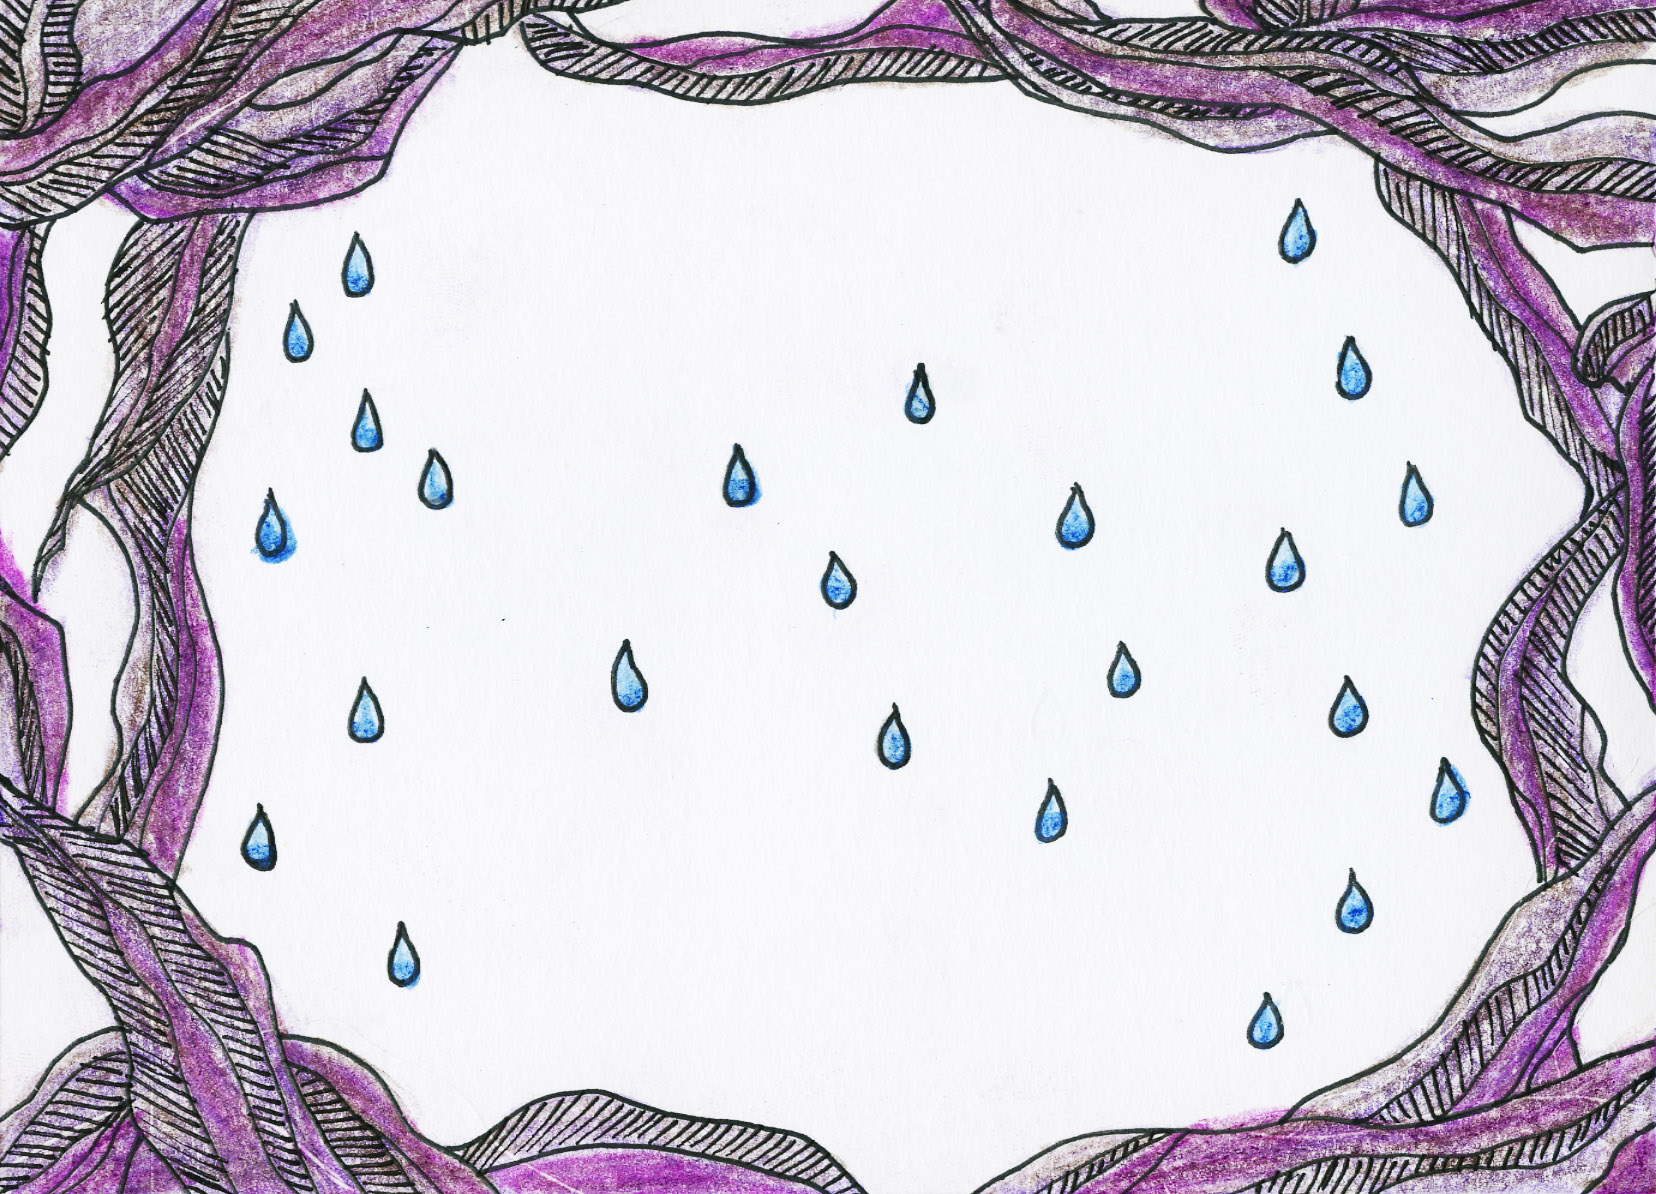
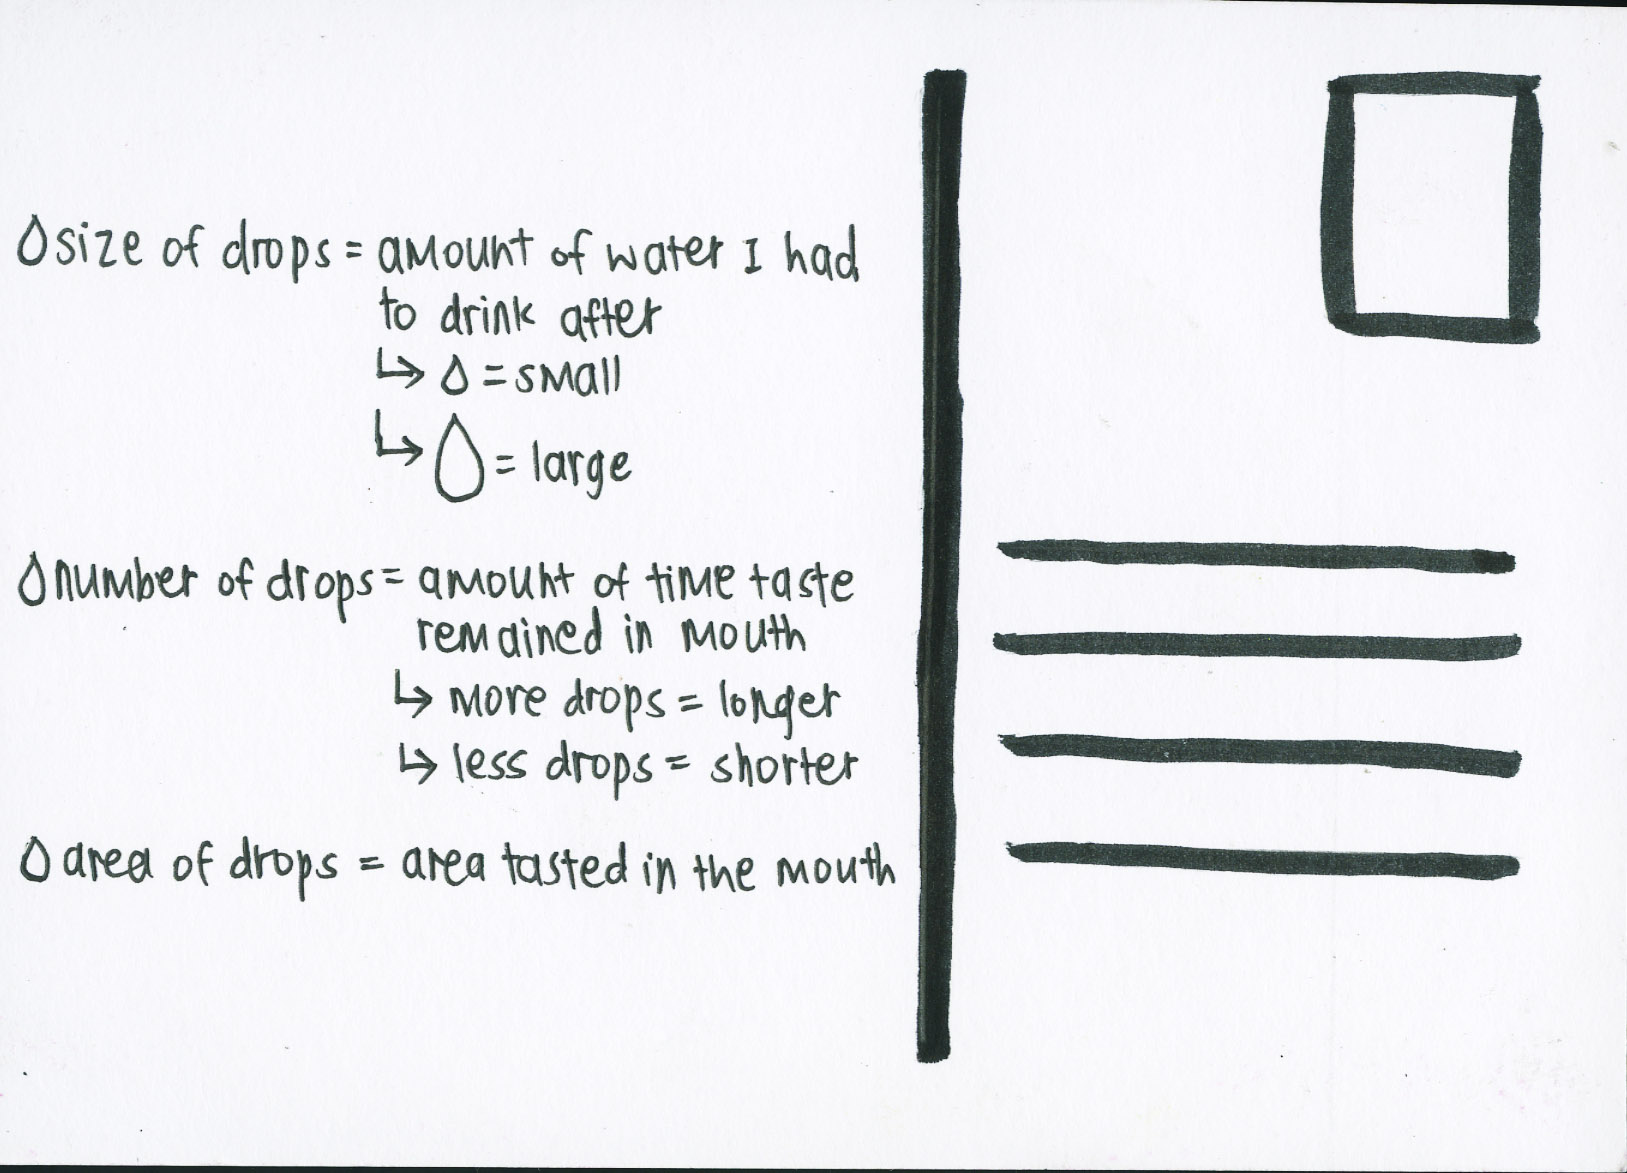
Below are the two postcards I worked on for the taste test session.
 Fern Fronds (Front)
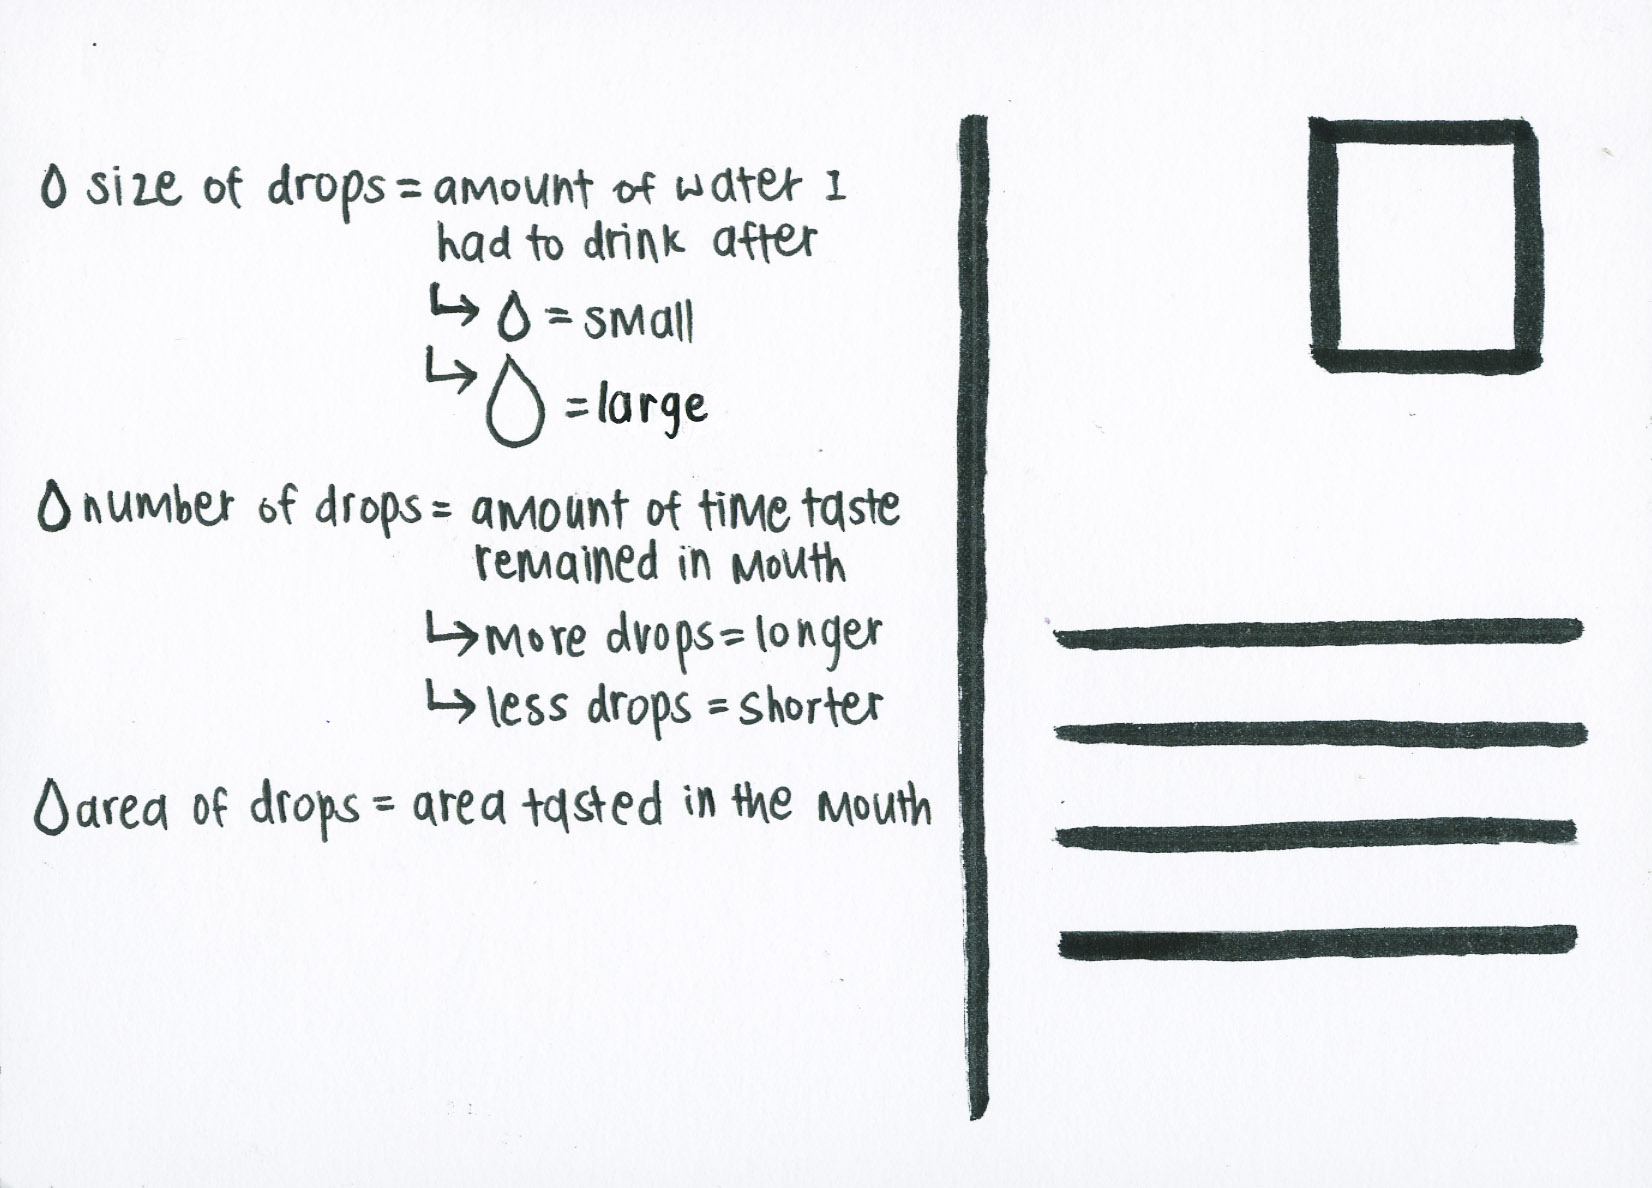 Fern Fronds (Back)
 Dulse Seaweed (Front)
 Dulse Seaweed (Back)
Hi guys!
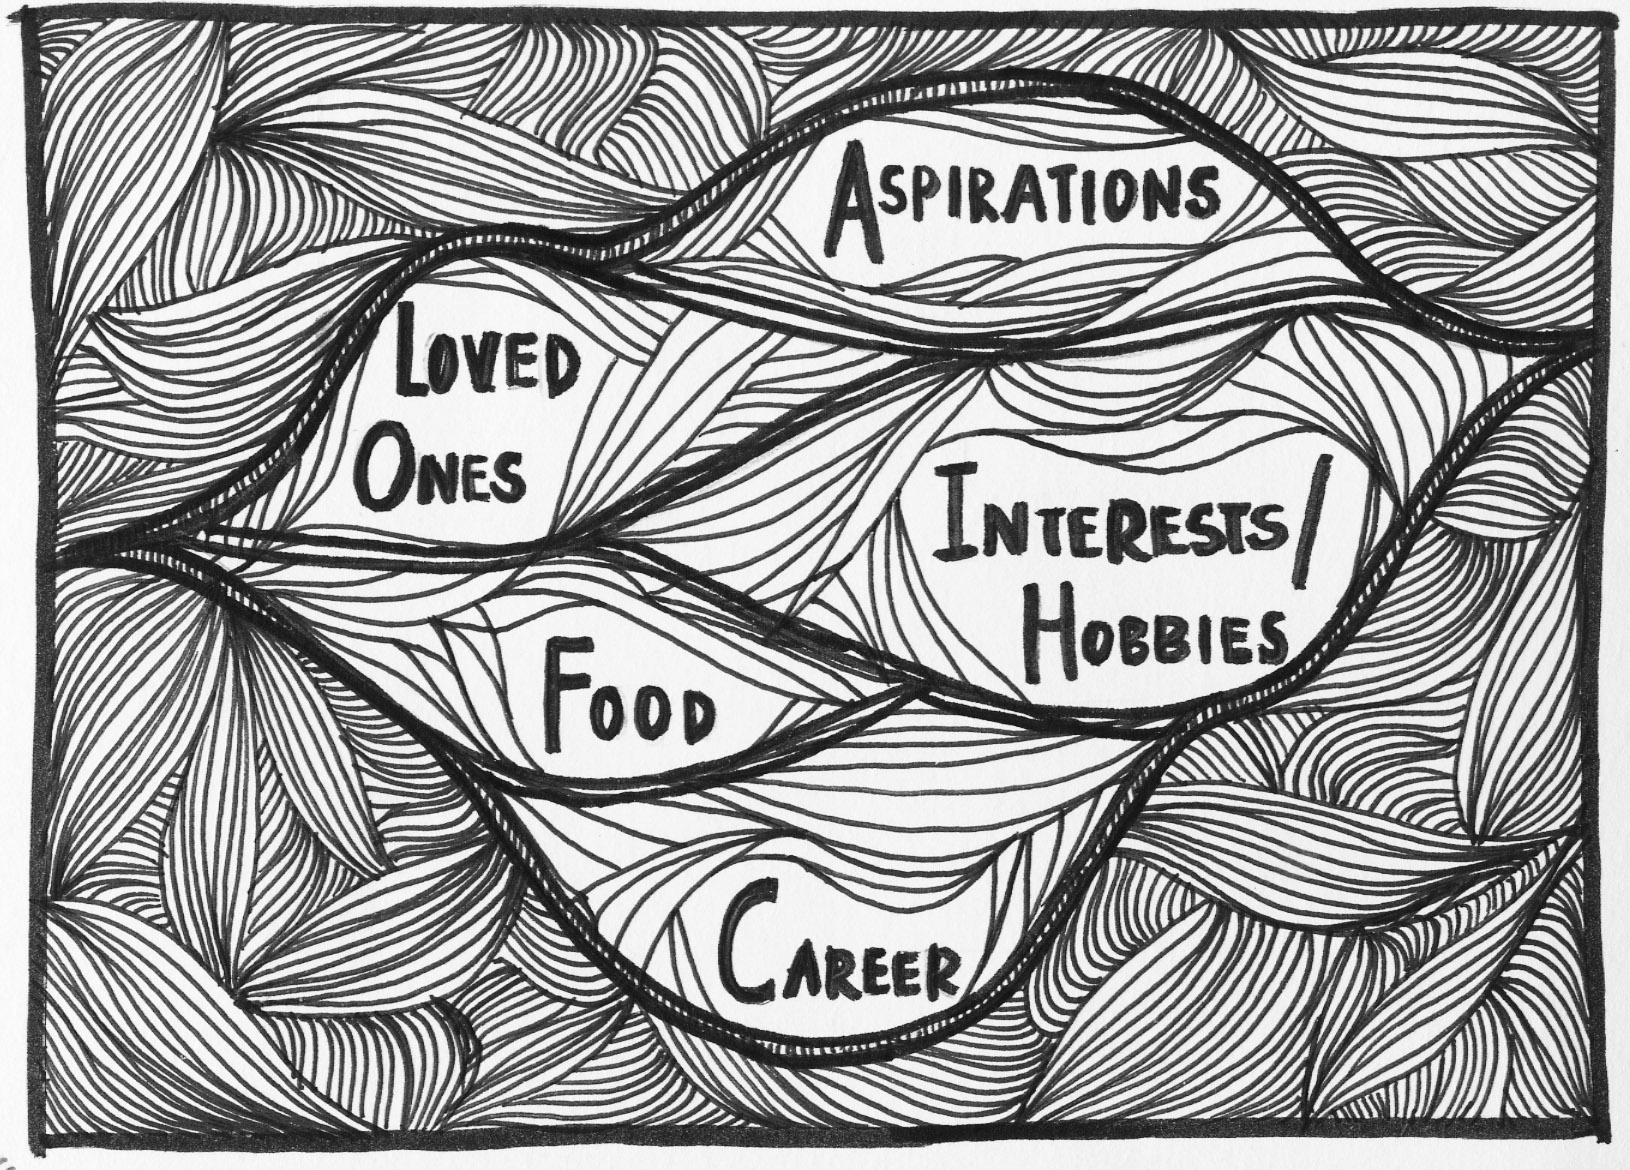
You can find my postcard based on the Zodiac Man below! I’ve split them up into the five categories that I feel are important and representational of me.