data visualising references + progress

datavis01 datavis02 datavis03

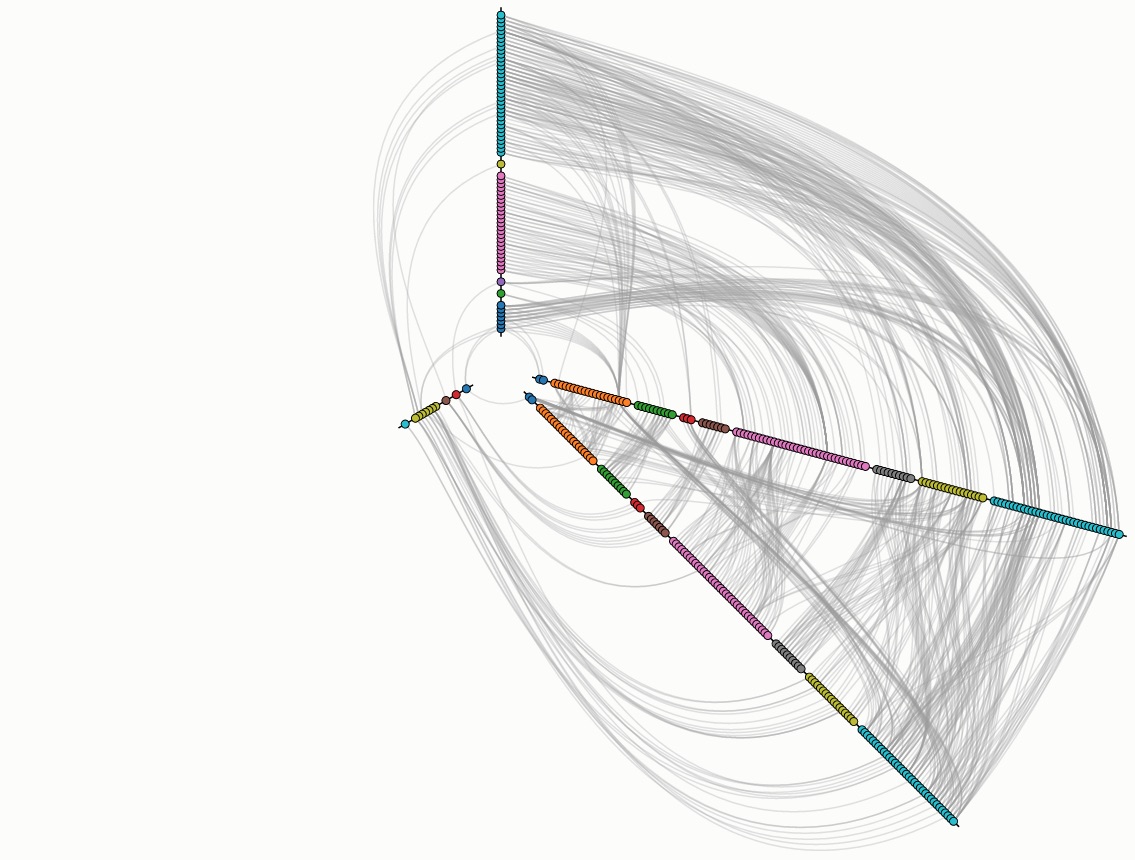
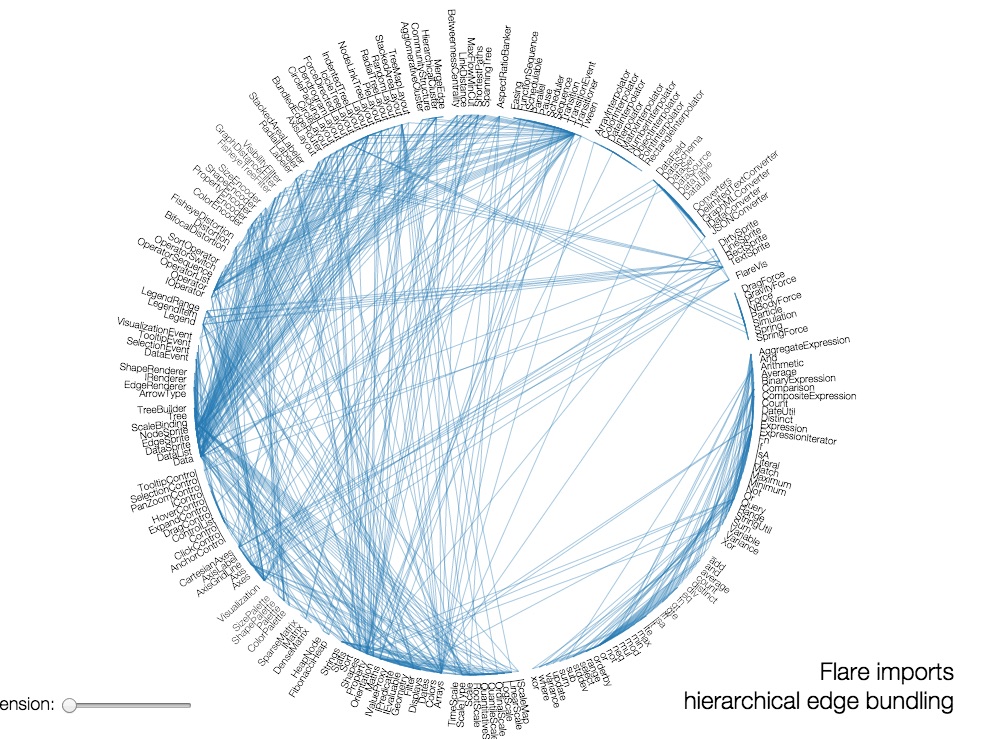
Here’s a good link that I am going to bookmark for when I get a hang of javascript. This gallery on Github displays a great variety of data visualising scripts. I have not figured out how they work, specifically, but they all come with some very handy tutorials.

I find this to be a wonderful alternative to building a WordPress theme from sketch. I mentioned in my previous entry that I have trouble importing all of my blog posts to my own server, so I cannot make use of the WordPress plugins anyway, as a large percentage of my entries will not be accounted for.

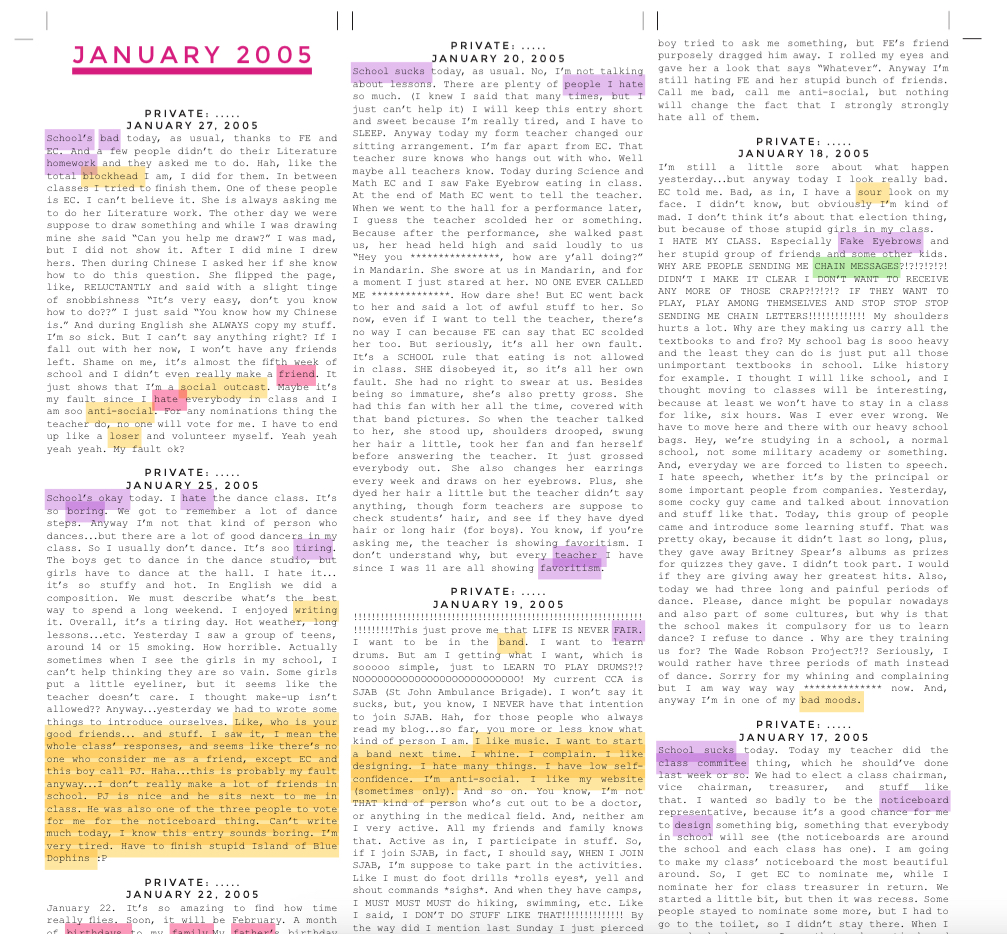
I spent the day drawing out some general statistics from January 2005 – May 2005. Here’s a sample:

word01

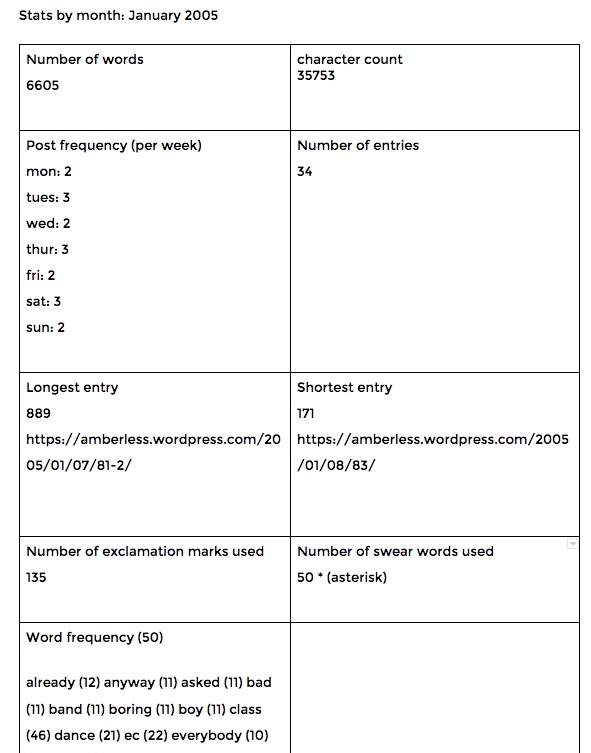
I did this for each month.


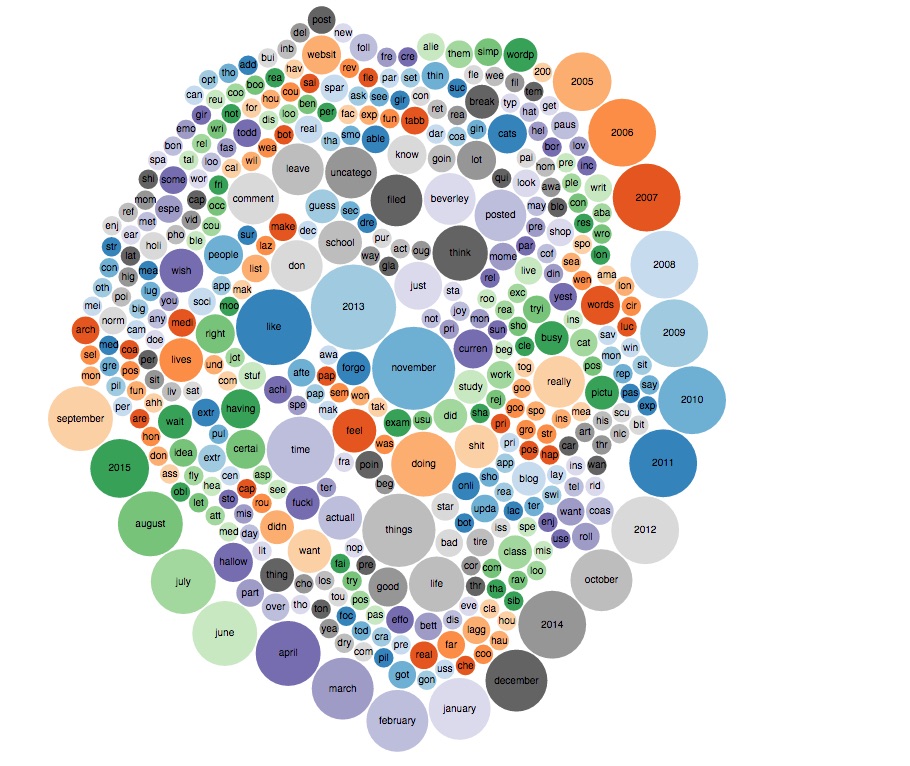
My main purpose for doing this is to sieve out the metadata so that I can tell a story with these figures and tags. I don’t intend to show any of my blog entries, as I feel that they don’t necessarily describe my relationship with blogging. Also, working with metadata helps to build my work around the bildungsroman theme by offering a bird’s eye view of the topics that I write about, taking into account the frequency of details like exclamation points (which I later renamed to “emotional punctuation”) after I notice that I used to end my sentences with lots of !!!!! and !?!!?!??!? whenever I feel frustrated. Words can also be associated with certain kind of lingo which will define some of my hobbies, like ‘skin’ and ‘layout’, for example. These words were used to describe the my blog themes then.

I find some of the examples of data visualising techniques on the Github gallery are pretty engaging. They also look really amazing. I think that I can definitely work the script to my advantage and incorporate my illustrative style to make my work more engaging.

data visualising techniques

data03

I found this website with a gallery of beautiful data visualising techniques, which (at last) gives me some ideas on how I can break down my data. I haven’t done much since recess week and am struggling with how to make use of my data. Tagcrowd is particular useful as I can take a look at the taxonomy of my blog posts, at a glance, from any period that I pick. So I don’t have to go through every single post to draw it out. It can be done, although it will be a feat because I’m not looking at book.

I think I have been putting it off for a bit because I got started with highlighting the text according to categories I made up and at one point I was like WHAT ?!?!?! and it was rather scary and overwhelming and I think I might not be able to continue doing for each and every post (I have 2,700 entries), and the content might become way too arbitrary to fit into just one or two categories. Also, going through what I have written when I was 13 was particularly embarrassing at times, even though I do take a step back and look at the text from a systematic point of view… still can be a struggle, because I did write them after all, and I’m not analyzing something that’s written by someone else or something that is purely fictional. I find this psychological part of doing this project something that I can also expand on, perhaps later, or as part of the process journal. The act of going through one’s journals and looking it from a third-person point of view.

Anyway, this is where Tagcrowd comes in handy for just sieving out words like “school”, “people”, “art”, just to highlight some broad categories immediately, and then under these umbrella of terms, I can then go into the entries and pick out some of the significant words I use to talk about these things.

I might start with some numbers for example, just to get me started. Just plain old figures. I got here a quick list I made just now:

  1. Number of words in my archive
  2. Total number of entries
  3. Post frequency
  4. Day of the week with highest posts
  5. Day of week with lowest posts
  6. Longest entry
  7. Shortest entry
  8. Number of exclamation marks used (Thought of this when I saw some particular angsty entries… ha ha)
  9. Number of swear words used (After the above)

Please let me know if you have more ideas 🙂

I can’t believe it took me a week to get this entry out. I’ve been feeling quite stuck and I have been bumming around. I should have just written this out. It got me out of the rut a little.

collecting data

data01

It’s not easy to work with data, I think, especially when I have absolutely no experience with it. Here’s what I got so far. I highlighted the text according to categories (school/self/etc). I’m not sure how I might go about deconstructing the text. I got a book about data visualising, so I’m currently reading through it.