tactile approaches to net art and aesthetics

One of the key things I want to explore through my visuals is to find the sweet spot between tactile art making and digital art. I’ve saved a collection of images to my Pinterest.

KEYWORDS

Throughout 2015, I was a little obsessed about finding a balance between making words and pictures. I feel that they have always been very separate processes. In the last few months, I think I’ve started to find a way to fuse them together. These are some of my thoughts and reasonings behind my visual output. I am paying close attention to how these areas are linked.

These are some works I found online by a Melbourne-based artist Rashee:

2_2_670 1_670 1_670-1 3_670-1 2_670 2_670-1 3_670 1_1_670

Rashee uses graffiti, painting and drawing to create artworks. His imagery is borrowed from system errors. What I like about his work that he takes a little inspiration from his borrowed imagery and let it expand into an abstract piece of shapes and beautiful mark-making. As a standalone piece, it is beautiful. It allows you to see the patterns that exist in these errors as marks made by the computer in an automatism fashion.

betwixt festival 2016

sarahmamt1 sarahmamt2 sarahmamt4

I was interested to see the Betwixt Festival at the Art Science Museum. I am unable to make it down to see the works (it was a crazy week) but I went online to do more research on the works. I find it encouraging that there is increasing exposure to the public about software and net art. One of the works that I found on the website is #dataselfieme by Sarah Mamat. That was the only work with the most information I can find. The project makes use of the self-tracking app called Moment, which is designed to help you keep track of the amount of time you pick up and use your phone. She combines the information with a GPS app to track her movement around Singapore in a day. Anyway this project makes me think about a couple of things that I personally feel I should look out for in my own work:

1. drawing with data: I find that the use of GPS drawing is quite a cool concept. I just feel that there could be more to these abstract lines than well… just abstract lines. Perhaps it is a matter of presentation, but many times, these minimal lines look good just because. I think that there is more than can be done for these GPS lines to enhance their meaning. If this work was interactive/animated, there will be more potential for such abstract linework to be put in a more meaningful context that is relevant to the theme.

2. being relevant vs context of the work: I struggle with this in my own work and I see this issue existing in this work as well. The exhibition describes the work as a “contemporary digital self-portraiture”, which I am not sure if it is at all a good description of the work. On the artist’s website, she describes this it as a “portrayal of detailed movement while capturing the essence and totality of the artist, presenting it in a different perspective.” I think what we can glean from the work is that the artist picks up her mobile phone pretty often throughout the day, and certainly this is relatable for most viewers, because it is not uncommon for us to pick up the phone plenty of times. Through her documentation in the few months, I find the data quite repetitive. It makes me think about what makes a good piece of data visualisation and why it works for the really good ones: that it is really important to find something meaningful to highlight from the dataset and tell a story from there. The dataset can always be made available, as something separate from the work, to provide a more detailed insight. In the case of this work, it is a lot of info that doesn’t translate to much, especially about something that we do everyday, and so often. It’s not really a strong dataset that could simply exist on its own and carry its meaning well.

3. lingo: I feel that when it comes to making works using apps that we make use of in our everyday life, there is always a tendency to self-reference by peppering the work with trendy buzzwords. I am a slight detractor of the use of hashtags. I think it has its place on social media platforms and it is part of the language there, but other than that, taking it out of that context often seems like a contrived need to keep up with being relevant to our world today.

That said, I think I also need to pay more attention to how I can properly context my work so that (as far as possible) it doesn’t fall trap to these things. I’m generally concerned about how some parts of my work is deemed ‘trendy’, something that I only quite recently discover why, thanks to Chloe and Qixuan who shared with me some interesting articles and websites. I think it’s the imagery that I’ve been using: screenshots of dated, defunct applications, which are also part of the visual vocabulary of a Tumblr subculture that makes references to those applications. Being able to easily find these screenshots was really helpful for me to try and illustrate the idea of the impermanence of technology, particularly of tools such as Microsoft Word and Microsoft Paint, where most people my age probably started with in making any digital art. I hope to make this point a little more clearly so that people don’t confuse this with an existing Internet art trend and then trivialise the nature of my work by the associated (negative) connotations of making Tumblr-inspired artwork.

free flow writing: introduction

I am working on writing about my work a little more freely, here’s an attempt at doing the introduction. Just to be more comfortable and forget about that structure for a bit.


Introduction

My project is an ongiong research about understanding my art practice and how I have lived my own life so closely with this process. The key concepts that surrounds my work is looking at the source material, raw data, and the process as a form of narrative and art. This report is a conclusive summary of the ideas that influence and drive the conceptual process.

My project is an ongoing research about understanding my art process through remixing and experimenting with the source material that is my blog archive.

My project is an ongoing research and exploration of the important of self-documenting through primarily virtual methods, using the soruce material that is my blog and making sense of the raw data that is the unedited voice of my youth. My personal art practice, my attitude and perspective on life and art is driven by the need to do a personal rebranding of the self, as a way to forget/move on/heal from the experiences of adolescence. Inspired by the literary genre of the bildungsroman, this project takes on a more experimental approach in narrating the traditional coming-of-age story. The bildungsroman refers to a novel dealing with one person’s formative years, focusing on the psychological and moral growth of the character. Writing in my blog actively for the last ten years of my life makes me attached to the memories and the experience of documenting my life in this virtual journal. The act of writing compulsively becomes both a liberal feeling and a burden to my memories. As my blogging activity declines in my university years, I have pinpoint the reason to be the need to fully rebrand myself, both internally and externally, in light of the experiences of my teenage-hood, in an attempt to move forward.

The source material is an art by itself. My objective in this body of work is to present a personal truth, maintaining an artistic voice that is true to the unedited and spontaneous nature of self-documentation and journal-writing.

My approach to the project is reflective of the interdisciplinary processes of my art practice, of skills I’ve learned over the years, combining a mix of traditional and digital methods to narrate this story of personal transition and also to place emphasis on the virtual, web-based nature of my story and my art.

My project is an ongoing research and exploration of self-documenting through primarily virtual methods, using the source material that is my blog, and making sense of the raw data that is the unedited voice of my youth. My art practice, attitude and perspective on life, is emcompassed by the need to reinvent and rebrand myself, in light of the negative experiences that i have been through in adolescence. Inspired by the literary genre bildungsroman (a novel that describes the formative years of a character), my project takes on an experimental and interdiscplinary approach to the traditionally linear format of telling this story. My objective in this body of work is to present a personal truth and maintaining a voice that feels as genuine as possible to the source material – my blog which I’ve written actively for the last ten years. The act of compulsively writing becomes both a liberal feeling in helping to alleviate some of the negative emotions, but also means that it becomes a burden. As my blogging activity decreases in my university years, I have pinpoint the reason to be a need to fully rebrand myself, to change my outlook in life and the way that I present myself, such that it doesn’t suggest any past struggle. The outcome of the project is reflective of the interdisciplinary processes that surrounds my art practice, combining a mix of traditional and digital methods, and aims for a further discussion on the impact of the Internet culture on today’s youths.

Concepts

This section looks at an array of interconnected themes in my project.

Source material as art

My project is an autobiographical work-in-progress that involves mining the digital terrain for source material. My personal blog is a rich source of experiential content, a database that holds not only my own personal thoughts but also nostalgic virtual memories. This is a fundamental difference between the blog and the traditional journal. The multimedia nature of the digital space means that we are able to surf for information in a variety of formats, collect them and exhibit them in a space that is more than just a diary website (mark amerika ‘what is a blog). Looking through my blog archive, I am able to find traces of what I refer to as “virtual nostalgia”, of bits and pieces of certain websites and applications that have since shut down which were used by many like me, during their teenage years.

By highlighting this virtual nostalgia, I am learning to find out what these online data and activity means for our own experience of memory. Vannevar Bush said it best in his 1945 essay As We May Think: “…trails that are not frequently followed are prone to fade, items are not fully permanent, memory is transitory”. Each Internet application, website or even devices have a sense of built-in obsolescence. For most average users, personal data that holds some significance for our memories are transient in nature. Technology changes quickly to better suit our needs: web applications become obsolete quite quickly, therefore we might not find traces of our virtual past as easily. There is also a shift in conversation: a gradual, increasing need to express ourselves without words. At the heart of this change, I find a need to rediscover what conversation means on the Internet and to examine the psychological impact of instant gratification, and the arbitrary concepts of acceptance and approval that comes along with such wordless conversations.


report update

*I just lost all the information I’ve typed here. So upset 🙁 Trying my best to remember what I’ve written.

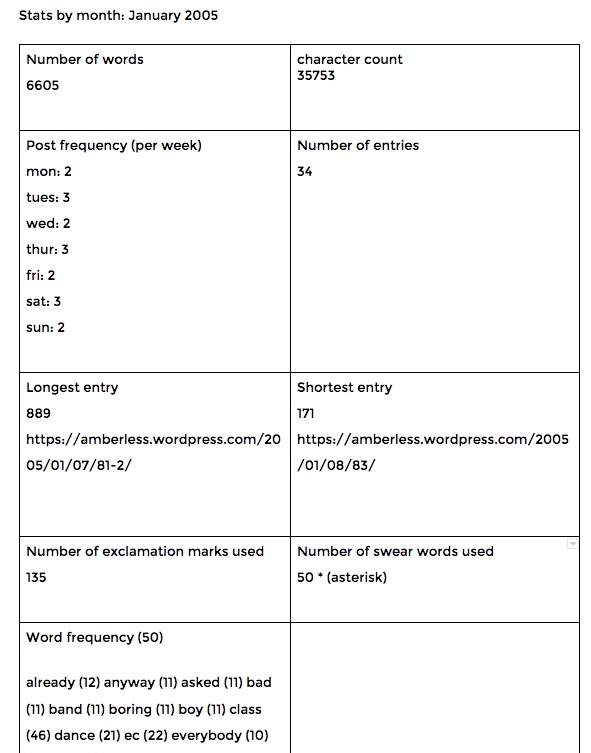
I wanted to spend more time on the report because I feel that my project is driven much more by the process that goes behind making the work, rather than the work itself. Over the weekend, I combed through my notebooks to see what I’ve previously written about my project since last year. There are a lot of ideas and each one of them is still relevant to my project at this point. So the outline below is an updated ‘system’ that I made to illustrate my thought process.

I feel that my project has become more than just a mere documentation of my teenage blogging journey, but also about what the Internet and the virtual community means to me and my artistic practice during those years. Beyond this, there is potential for a broader discussion and exploration on how that virtual network has changed, and expanded. The genre of Net art is constantly evolving, especially in communities such as Tumblr, where new virtual identities, phases and trends are always emerging. I feel that this is an evolved mode of self-representation and online persona, vastly different from the kind I experienced in my teenage years, where the lines between the virtual and real life identities are slowly merging together. All of this are really something to look at, and I hope that my project will, in some way, expand the discussion on what the virtual life means for the teenage generation now.


Introduction


My project is an ongiong research about understanding my art practice and how I have lived my own life so closely with this process. The key concepts that surrounds my work is looking at the source material, raw data, and the process as a form of narrative and art. This report is a conclusive summary of the ideas that influence and drive the conceptual process.


My project is an ongoing research about understanding my art process through remixing and experimenting with the source material that is my blog archive.


My project is an ongoing research and exploration of the important of self-documenting through primarily virtual methods, using the soruce material that is my blog and making sense of the raw data that is the unedited voice of my youth. My personal art practice, my attitude and perspective on life and art is driven by the need to do a personal rebranding of the self, as a way to forget/move on/heal from the experiences of adolescence. Inspired by the literary genre of the bildungsroman, this project takes on a more experimental approach in narrating the traditional coming-of-age story. The bildungsroman refers to a novel dealing with one person’s formative years, focusing on the psychological and moral growth of the character. Writing in my blog actively for the last ten years of my life makes me attached to the memories and the experience of documenting my life in this virtual journal. The act of writing compulsively becomes both a liberal feeling and a burden to my memories. As my blogging activity declines in my university years, I have pinpoint the reason to be the need to fully rebrand myself, both internally and externally, in light of the experiences of my teenage-hood, in an attempt to move forward.


The source material is an art by itself. My objective in this body of work is to present a personal truth, maintaining an artistic voice that is true to the unedited and spontaneous nature of self-documentation and journal-writing.


My approach to the project is reflective of the interdisciplinary processes of my art practice, of skills I’ve learned over the years, combining a mix of traditional and digital methods to narrate this story of personal transition and also to place emphasis on the virtual, web-based nature of my story and my art.


My project is an ongoing research and exploration of self-documenting through primarily virtual methods, using the source material that is my blog, and making sense of the raw data that is the unedited voice of my youth. My art practice, attitude and perspective on life, is emcompassed by the need to reinvent and rebrand myself, in light of the negative experiences that i have been through in adolescence. Inspired by the literary genre bildungsroman (a novel that describes the formative years of a character), my project takes on an experimental and interdiscplinary approach to the traditionally linear format of telling this story. My objective in this body of work is to present a personal truth and maintaining a voice that feels as genuine as possible to the source material – my blog which I’ve written actively for the last ten years. The act of compulsively writing becomes both a liberal feeling in helping to alleviate some of the negative emotions, but also means that it becomes a burden. As my blogging activity decreases in my university years, I have pinpoint the reason to be a need to fully rebrand myself, to change my outlook in life and the way that I present myself, such that it doesn’t suggest any past struggle. The outcome of the project is reflective of the interdisciplinary processes that surrounds my art practice, combining a mix of traditional and digital methods, and aims for a further discussion on the impact of the Internet culture on today’s youths.

Concepts


This section looks at an array of interconnected themes in my project.


Source material as art


My project is an autobiographical work-in-progress that involves mining the digital terrain for source material. My personal blog is a rich source of experiential content, a database that holds not only my own personal thoughts but also nostalgic virtual memories. This is a fundamental difference between the blog and the traditional journal. The multimedia nature of the digital space means that we are able to surf for information in a variety of formats, collect them and exhibit them in a space that is more than just a diary website (mark amerika ‘what is a blog). Looking through my blog archive, I am able to find traces of what I refer to as “virtual nostalgia”, of bits and pieces of certain websites and applications that have since shut down which were used by many like me, during their teenage years.


By highlighting this virtual nostalgia, I am learning to find out what these online data and activity means for our own experience of memory. Vannevar Bush said it best in his 1945 essay As We May Think: “…trails that are not frequently followed are prone to fade, items are not fully permanent, memory is transitory”. Each Internet application, website or even devices have a sense of built-in obsolescence. For most average users, personal data that holds some significance for our memories are transient in nature. Technology changes quickly to better suit our needs: web applications become obsolete quite quickly, therefore we might not find traces of our virtual past as easily. There is also a shift in conversation: a gradual, increasing need to express ourselves without words. At the heart of this change, I find a need to rediscover what conversation means on the Internet and to examine the psychological impact of instant gratification, and the arbitrary concepts of acceptance and approval that comes along with such wordless conversations.

learning with stefanie posavec: day 2

thumb_IMG_8649_1024Today we learn how to visualise data. Some basic techniques are introduced, as well as some general rules of thumb as a guideline.thumb_IMG_8652_1024  thumb_IMG_8651_1024

Using statistical knowledge to work with design. Looking for an overarching conclusion may help make your work more meaningful. Patterns and rhythms in data can be translated visually – using various methods like analog, coding, etc.

Have a spreadsheet! Use Google sheets. It helps you to identify patterns.

Take notes on what you find: rate of change, hierarchal relationships, and so on. Get to know your data.

Select your focus. Form your message, find the highlight.

Assign visual variables to data (shape, tonal values, texture, orientation of a line, etc)

IMG_8662  IMG_8660 IMG_8659

Stefanie highlights the elements that makes for a strong data visualisation:

  • Good architecture + arrangement
  • Annotate appropriately: labels, legend, titles, axis, units, sources, attributes.
  • Don’ts: improper scaling, truncated axes, differences in perspectives (particularly in 3D visuals)
  • 3 to 8 groups or categories is good enough to communicate

IMG_8658

This form of visualisation is the basis for her style of visualisation: the node link tree diagram. It’s good to research on data visualisation styles to give you a headstart.

IMG_8674

IMG_8673

Do a sketch first: how it works, then add graphical elements, and then annotations.

IMG_8665 IMG_8664 IMG_8663

Critiquing bad data visualisations: it should not be too confusing.

Lastly: some methods to organise data:

  • grouping information according to location (geo-spatial data)
  • alphabetical order
  • time
  • category (comparing categorical values)
  • hierarchy (relationship between entities)

Jacques Bertin’s visual variables

Gestalt laws of grouping.

That’s all for today! We are to work on an individual project for this program as well. I won’t be using my FYP for this due to the time constraint of the program. I’ll share more as I go along.


learning with stefanie posavec: day one

Photo 2-11-15, 11 55 21 AM
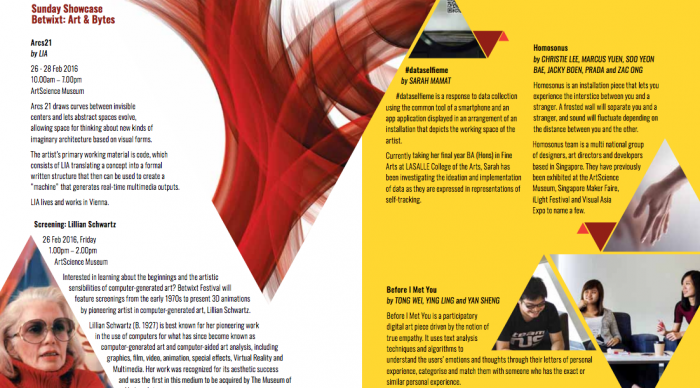
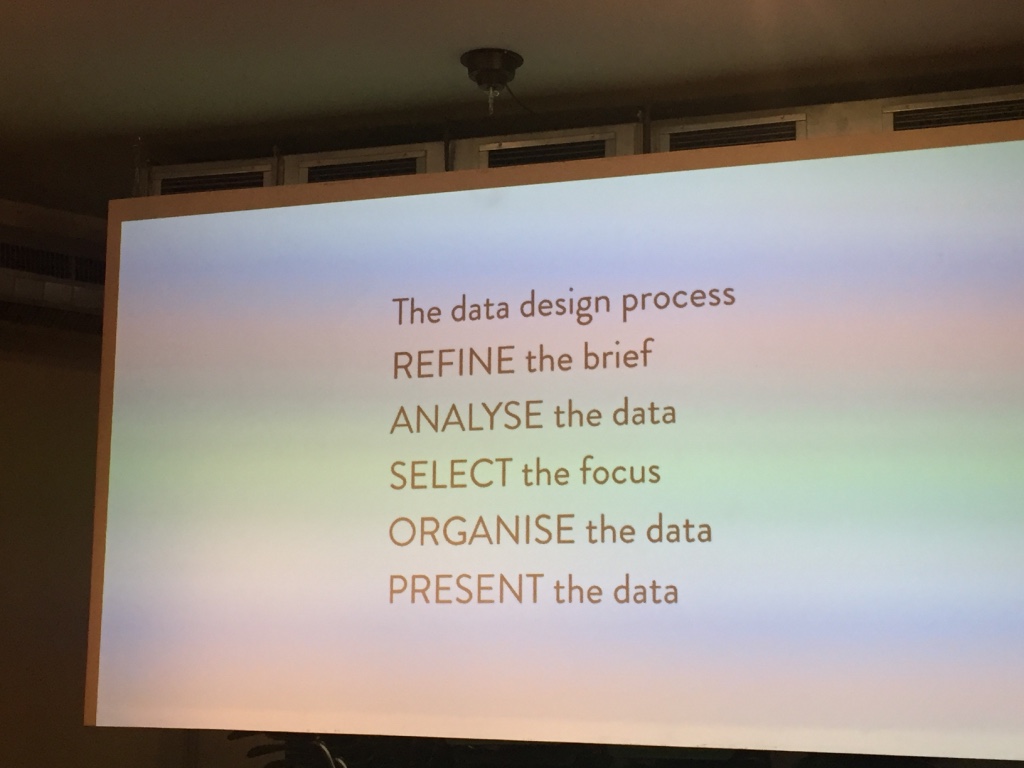
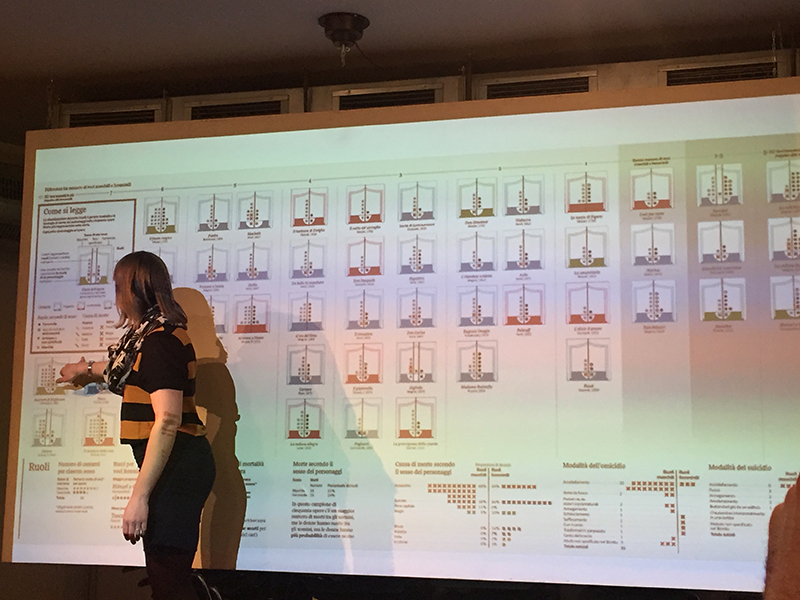
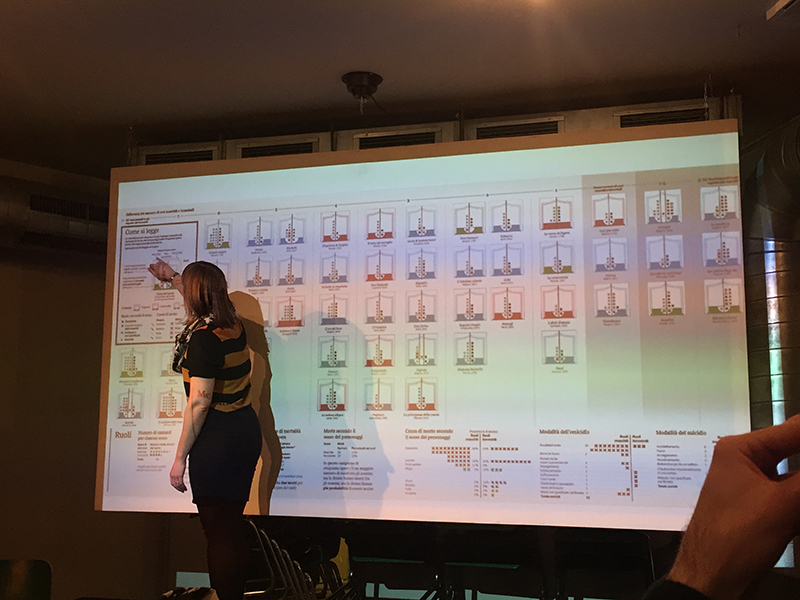
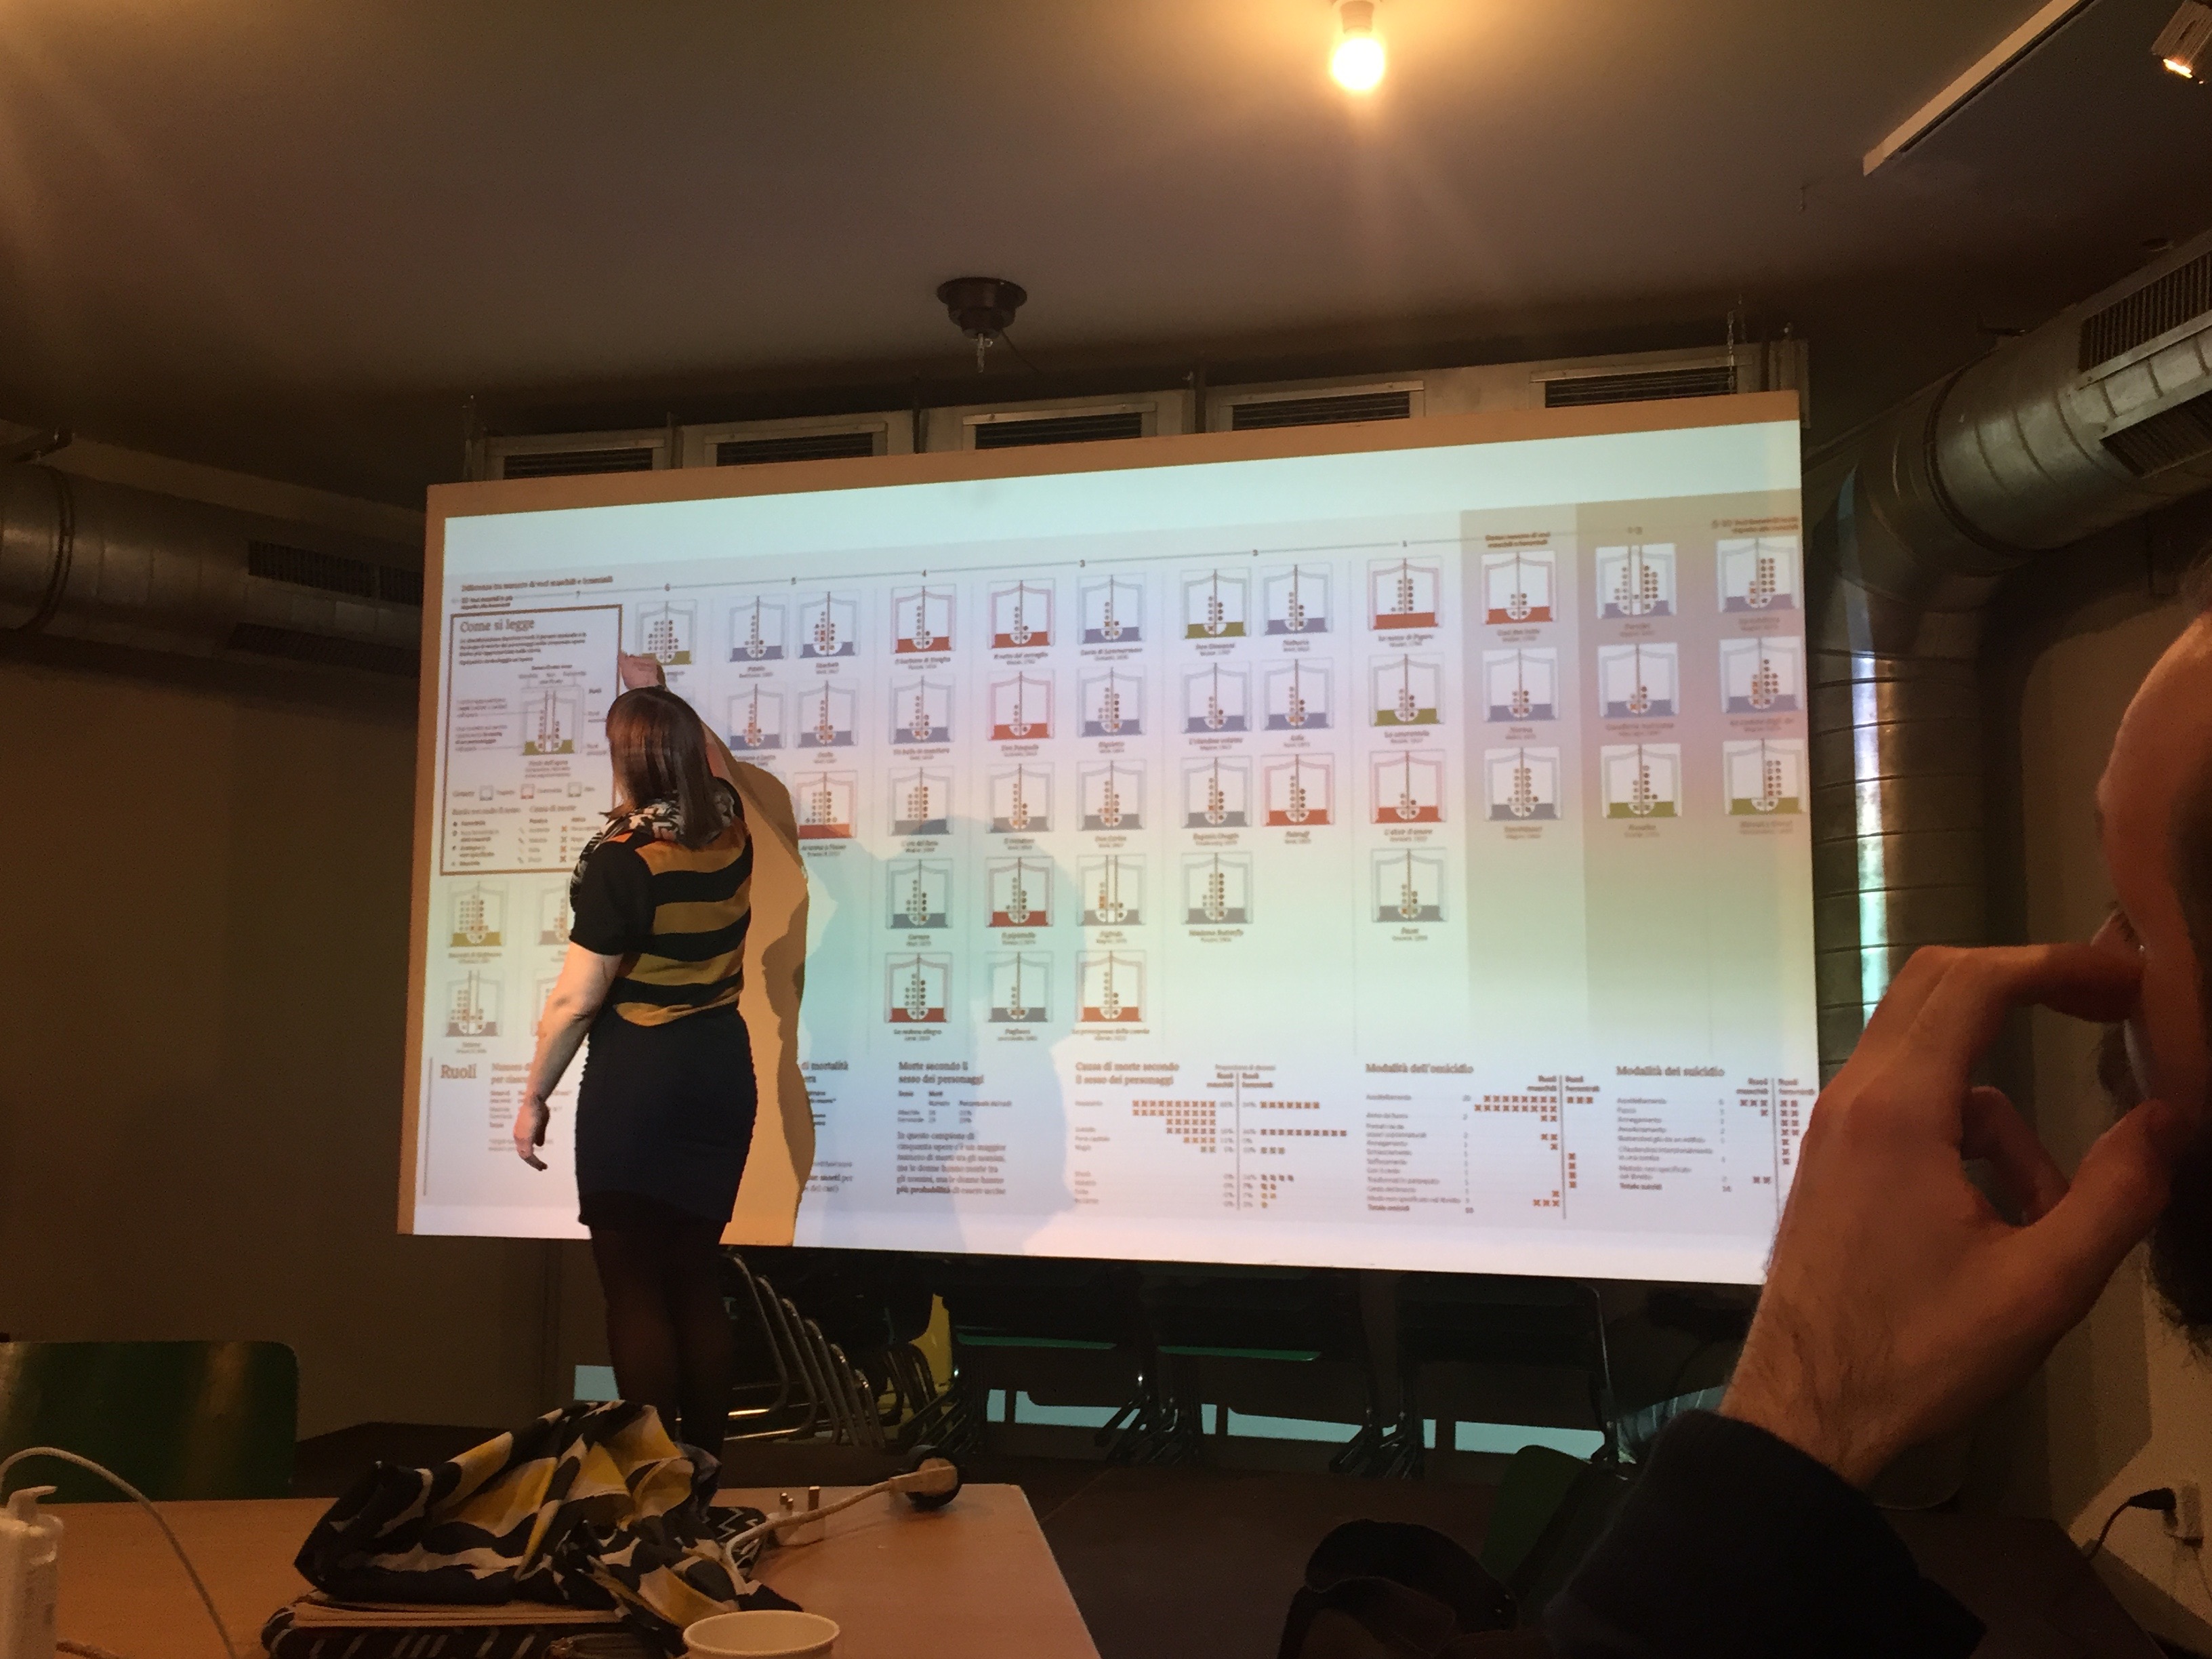
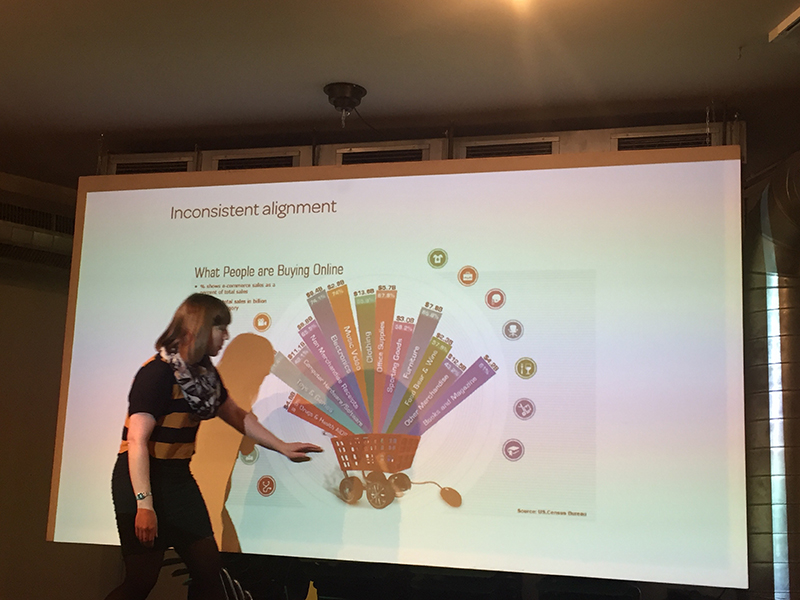
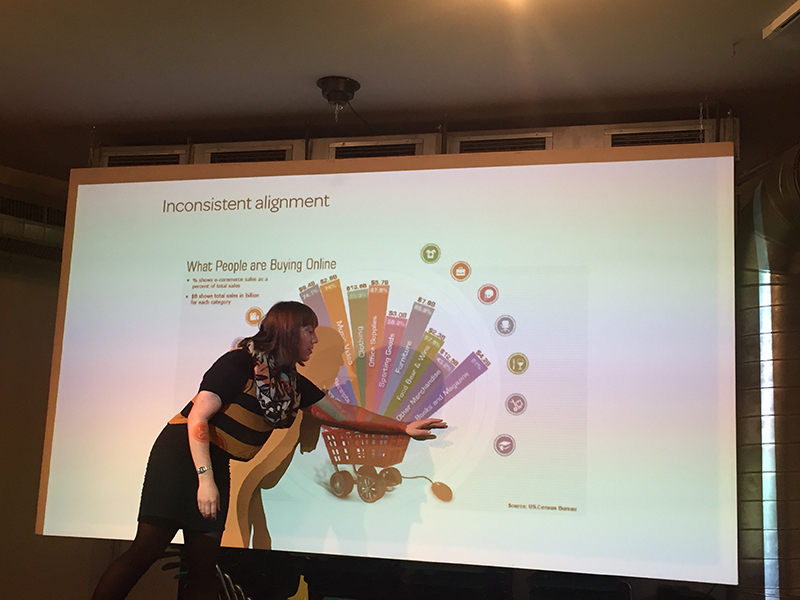
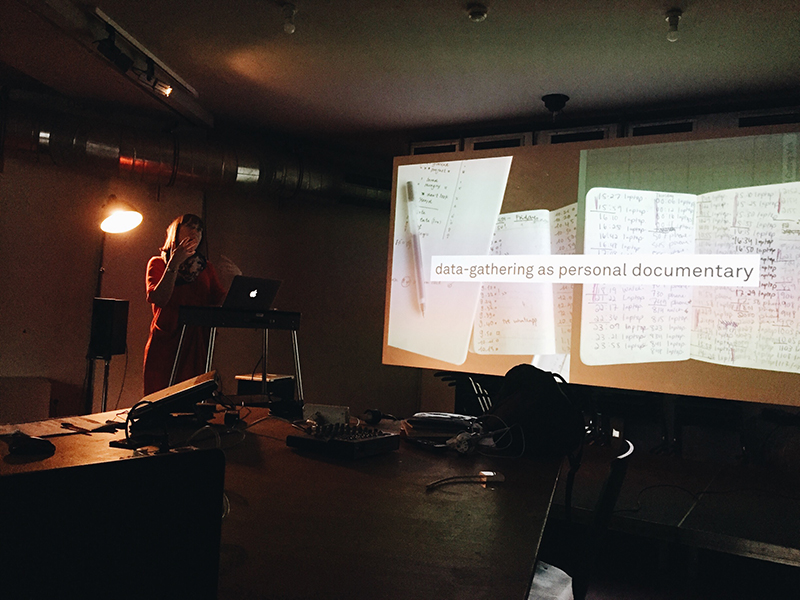
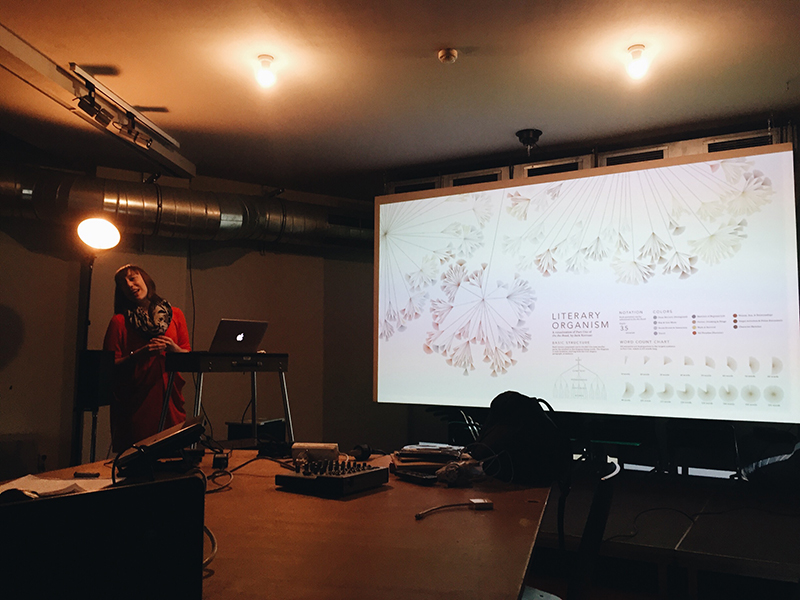
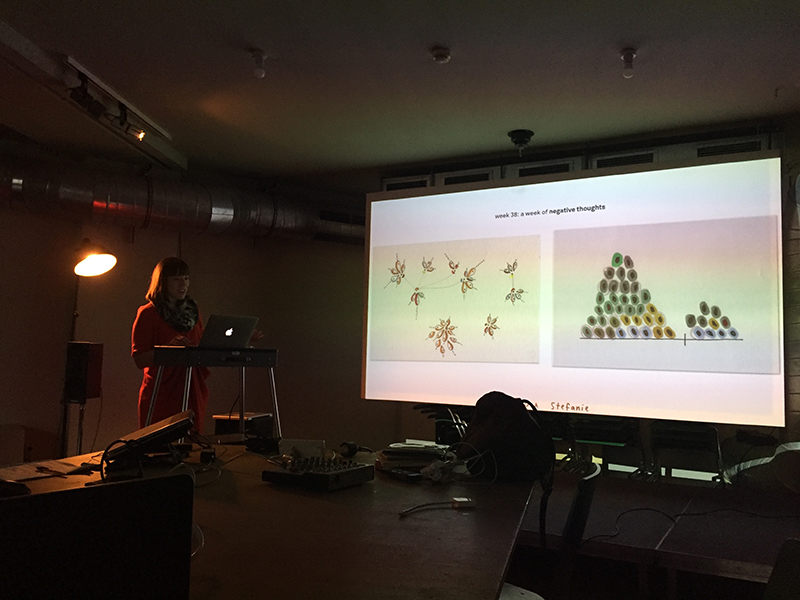
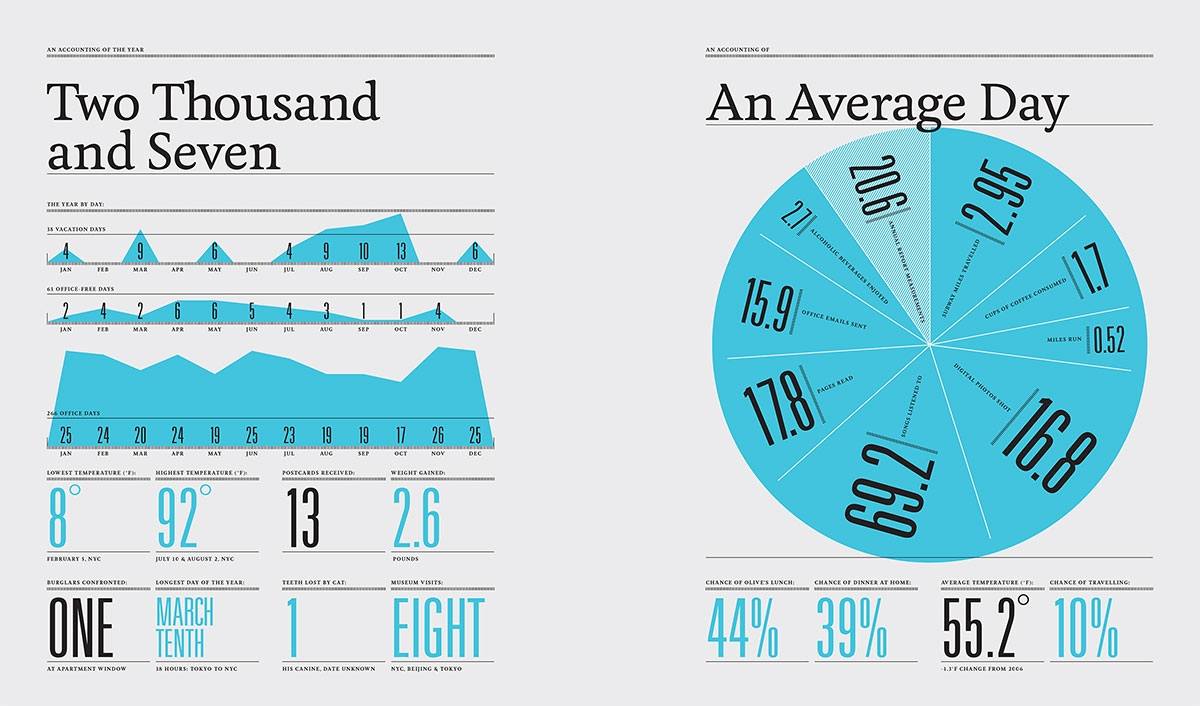
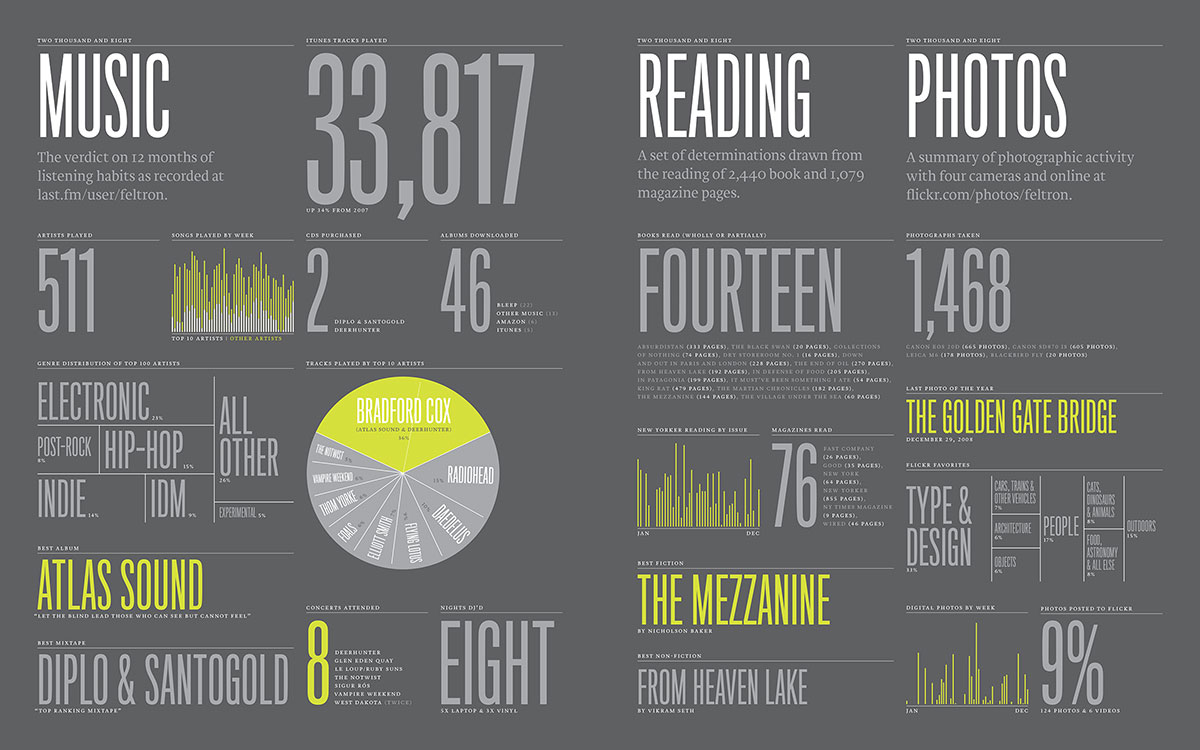
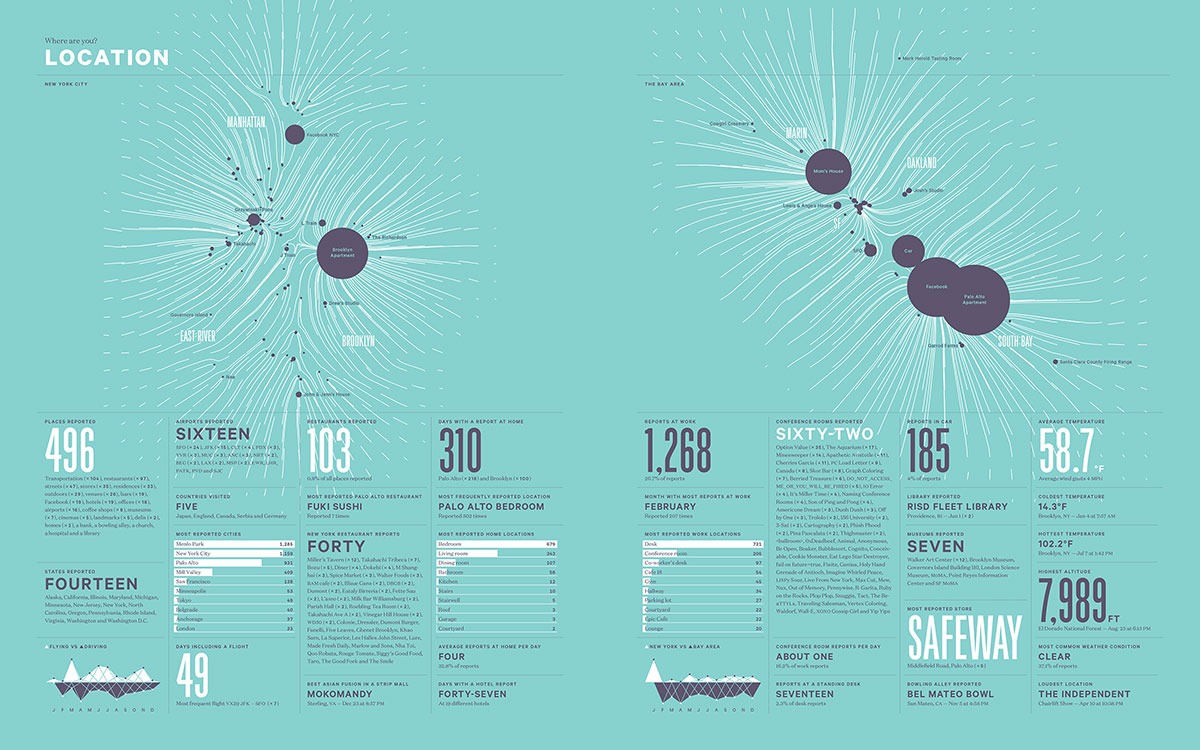
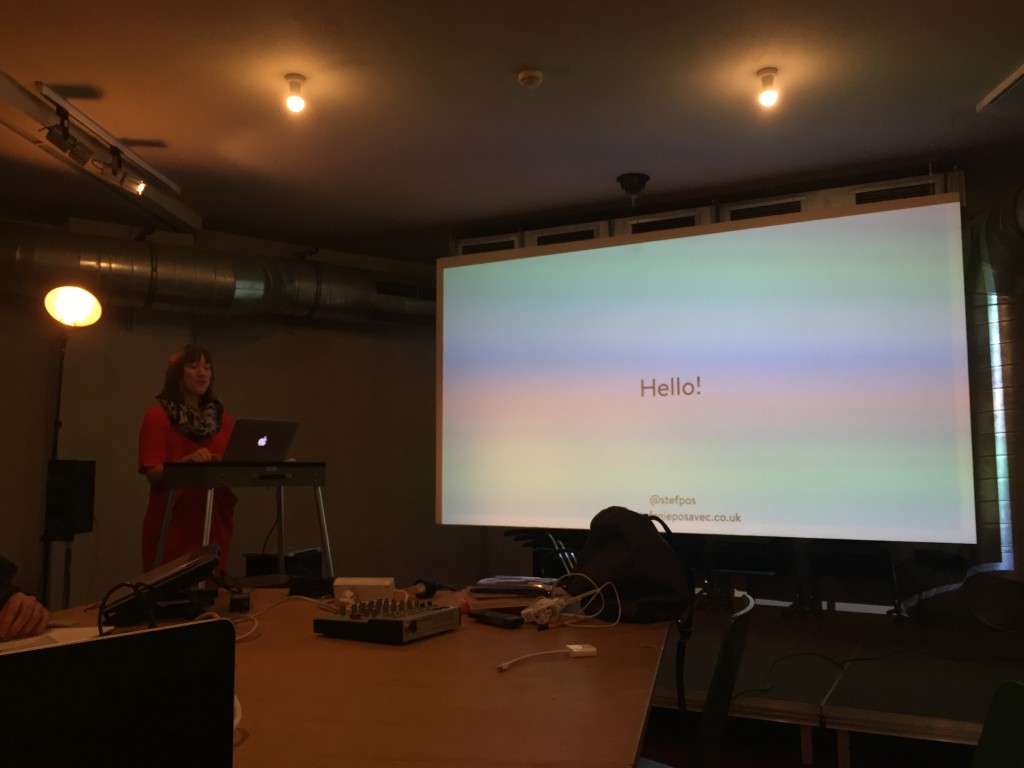
The first week of the program is kicked off with a series of lectures and workshops by Stefanie Posavec. What a wonderful way of begin the program, because it was her work that really pointed me in the direction of my FYP.

An interesting note: she’s my flatmate too. We share the apartment of our host Rachel, and on the first day we went to school together. It was a really ~wow~ moment, and as much as I wanted to, I didn’t ask too much of her work and things like that because I didn’t want to sound too eager and fangirly… I told her a bit about what I am doing, that’s all. Also, the stuff I wanted to ask her was all covered in her presentation in the morning.

Processed with VSCOcam with a6 preset

Talking about Dear Data: this project is about quantifying everything around and visualising it in analog form. The result is 52 weeks of 2 different visualisations. This is currently in the midst of being printed into a book so yay… we will get to see this in its full printed glory. Stefanie says it was challenging to do this, it took around 8 hours of her week, and making a conscious effort to take down notes about each week’s theme.

Processed with VSCOcam with a6 preset

Stefanie sharing her work Writing Without Words.IMG_8533

Even though this is the first week of the program, I am pretty certain this is quite the highlight already, being able to hear Stefanie share her working process, the ideas that go behind the works that she’s known for. Most artist/designer’s portfolio websites are often pretty straightforward, telling the work like it is, so it’s a real opportunity to hear her own thoughts about the work. She mentions that Writing Without Words was a project that she made almost ten years ago, which really directed her to her current career path as a data illustrator. It got really big on the Internet, and people were really receptive and curious about that work. This is really inspiring to hear, because you might never know that you’re on to something that people would be incredibly supportive of, and might open doors to much more exciting opportunities.Photo 2-11-15, 11 56 54 AM

The first part of her presentation addresses her identity as a designer – Stefanie calls herself a data illustrator, and uses data as a material to create a graphic and to tell a story. She shares her data visualising skills and process from a designer point of view, and she often collaborates with someone who’s trained to do research and statistical analysis, like Miriam Quick, (who will be us next week to share with us how to work with datasets – the technical stuff) and they work in tandem to create a data story using graphics.

Some key takeaways from her presentation about using data as part of art and design:

  • data visualising aims to communicate beyond the data – it is therefore important to make sure the visualisation is effective.
  • as a designer, you can look for patterns within the data and translating them into visual language. Data as an aesthetic output.
  • data gathering can be used as a personal documentary: data is everywhere in the physical world, and it’s not impossible to visualise them.
  • a good dataset is interesting, rigorously researched by you, or from a reliable source. Honesty and integrity is key.
  • dataset can be a souvenir (referring to her work Dear Data with Giogia Lupi)
  • the process of collecting data can be performative, an endurance test, a self-portrait.
  • data can inspire feelings. It’s not all dry facts!
  • data is a scientific and cultural material.
  • data visualisation explains, explore, exhibit.

Next post will be about the visualisation techniques.

big questions

I did a trial run of my presentation and as I read aloud my thoughts, I find that there are some big questions that might need to be answered about my concept.

  • I need to talk more about the concept. Presentation should consist of 90% concept. 10% on outcome as I’m sure this is subjected to change.
  • I am going to do a “10 things in 10 minutes”, where I will address key concepts in a suitably paced manner.
  • Place more emphasis on the idea of “private vs public” in the context of social media. Blogging is a very early form of social media and I’ve used it as a very public display of my private self. It would be helpful to expand on this thought.
  • Be clear in approaching my project from a critical point of view so that I don’t fall trap to sounding self-indulgent. I’m also trying to do more readings about this to substantiate my work: books by Sherry Turkle.
  • Allow my work to set a stage for a meaningful discussion on our relationship with social media, about reclaiming conversation with ourselves in the digital age, about using it in a meditative, enriching manner to come to terms with our personal struggles.


Research Critique: Feltron Annual Report

FAR07_02 FAR07_03 FAR07_05 FAR08_02 FAR08_03 FAR08_04 FAR12_02 FAR12_03 FAR12_04

(images from Nicholas Felton’s website)

Since 2005, Nicholas Felton have been collecting data on almost every facet of his life and presenting his findings in a series of beautiful graphical posters. Each poster focus on the statistics that makes up a topic. For example, while looking in to his relationships, he breaks down the frequencies he meet people, who he communicates with most often, the amount of time he spends socialising and more. All of these data is presented in a variety of graphs and charts. Through this project, Felton hopes to explore how to graphically encapsulate a year.

Felton is inspired by the concept of annual reports, which are often generated by corporate companies at the end of each business year, as a comprehensive document that charts the company’s activities, earnings and progress. The Feltron Annual Report project is a very refreshing and humorous take on a typically corporate documents. Through my part-time job, I’ve had the opportunity to work on annual reports before, and truth be told, they are not the most interesting project to work on. Looking at Feltron’s Annual Reports really made me think of the annual report in a totally new way.

Felton’s approach to making these personal reports is exactly what I hope to do with my own blog, conceptually. He pairs the impersonal, corporate style of annual reports with personal details of his life, and through the various infographics embedded in each poster, we piece together activities and life in each year. It is a really brilliant example of how data can be used to tell a story.

FAR09_03

What I also observe in this work is that Felton weaves in his sense of humour in this work, which you can see from the titles he give to each statistic group. “Most Common Relationship? Friend.”

Felton uses a variety of tools to help him log in data: some are apps which are available commercially, and some he built himself. He also acknowledges that while it is possible to collect data on almost everything, what can be done with the data is almost endless.

“The data set itself was messy and overwhelming, and filled with enough information for several more reports. There are inherent shortcomings (like the unrepresentative amount of water recorded), and endearing strong suits (like the exploration of mood).”

Felton on report 2009

In the span of this ten year project, each report progressed from collecting information about everything to focusing on just one area. For example, in the report 2013, Felton explores his communication data, which breaks down his usage patterns from sources like texting, calling, emailing and being on social media. In the report 2011, he explores how his personality varies in different settings or with someone.

Overall, I find the Feltron Reports a very inspiring way for me to look at how I can work with the data from my blog for each year, by highlighting some of the more interesting details and experiences. I also observe that he each year, his infographics take on a fresh, new style. This also inspires me to use graphic design as a way to sum up my year, and to include (in a subtle way) my graphic influences along the way. I think it can be part of my narrative as a visual artist.


data visualising references + progress

datavis01 datavis02 datavis03

Here’s a good link that I am going to bookmark for when I get a hang of javascript. This gallery on Github displays a great variety of data visualising scripts. I have not figured out how they work, specifically, but they all come with some very handy tutorials.

I find this to be a wonderful alternative to building a WordPress theme from sketch. I mentioned in my previous entry that I have trouble importing all of my blog posts to my own server, so I cannot make use of the WordPress plugins anyway, as a large percentage of my entries will not be accounted for.

I spent the day drawing out some general statistics from January 2005 – May 2005. Here’s a sample:

word01

I did this for each month.


My main purpose for doing this is to sieve out the metadata so that I can tell a story with these figures and tags. I don’t intend to show any of my blog entries, as I feel that they don’t necessarily describe my relationship with blogging. Also, working with metadata helps to build my work around the bildungsroman theme by offering a bird’s eye view of the topics that I write about, taking into account the frequency of details like exclamation points (which I later renamed to “emotional punctuation”) after I notice that I used to end my sentences with lots of !!!!! and !?!!?!??!? whenever I feel frustrated. Words can also be associated with certain kind of lingo which will define some of my hobbies, like ‘skin’ and ‘layout’, for example. These words were used to describe the my blog themes then.

I find some of the examples of data visualising techniques on the Github gallery are pretty engaging. They also look really amazing. I think that I can definitely work the script to my advantage and incorporate my illustrative style to make my work more engaging.