google sheets

Screen Shot 2015-12-18 at 6.47.30 pm

In the past month, I’ve worked a lot with Google Sheets. It helps me to organise my categories and tags easily.

Due to the scale of the project and the personal, arbitrary nature of journal entries, it can be tedious and tricky to build the database of tags and categories. Here’s how I tagged my entries.

– Tags: subject matter, activity, event, names

After a review of my Sheets, I am on the fence about using Categories as part of the database narrative. Categories are more general than tags, which can be very specific, and as a rule, I categorised my entries based on the general tone/subject matter of the entry, which can be quite tricky because as I’ve said, entries can be arbitrary. I thought about how my dataset could work for me and I find that tags may offer a better solution. A combination of say, tags + time, will project quite interesting visualisations, and definitely more effective as well. Categories would become an extra set of variable, and because they can look rather similar to tags, it would be really confusing too.

Here’s an overview of my Sheets. This is from January 2005 – 2015. There’s a lot of cleanup to be done, for sure.

Screen Shot 2015-12-18 at 6.47.34 pm

Sorting of Categories.

Screen Shot 2015-12-18 at 6.47.37 pm

All the tags, before they are sorted. Tags in the colour columns belong to a bigger category, while those on the left side are more specific.Screen Shot 2015-12-18 at 6.47.39 pmScreen Shot 2015-12-18 at 6.47.41 pmFor my Facts & Fictions final, I narrowed down the categories and tags and worked with these.Screen Shot 2015-12-18 at 6.47.43 pmScreen Shot 2015-12-18 at 6.47.48 pm

Sketches of my visualisation, using Google Sheets.


writing a wordpress theme

Spent the last few days working on making a WordPress theme. Progress could be better if I am not interrupted periodically… but I am quite pleased with where I’ve gotten so far. The screenshots don’t really show much, but I am getting better at understanding how a theme comes together. Also, doing this is a real refresher course on working with PHP again.

I used the WordPress Codex for help on theme development. Having imported a good percentage of my blog posts for my Facts & Fiction project (the january project) gives me a good base to work with, in terms of theme development. It is definitely useful to have some posts there rather than working on an empty blog. This December, I’ll be working a couple of things: developing the dataset for my blog, create a skeleton theme for the final, and think of a meaningful way to make the data visualisation. The dataset is created by tagging and categorising all my blog entries and forming the database narrative. More on this part on my next entry — I am also excited to show the progress of that part of my project as well as my outcome for Facts & Fictions. All of this will come in the next few days. So many things to do, and I’m eager to share along the way.

In this screenshot, you can see the very basic skeleton of a theme. At this point, I felt a sense of achievement. Getting the posts and categories to show up. I also added the tag cloud (didn’t have a screenshot), and I could see something developing there, with just January’s worth of entries. I’ve mentioned before that it’s not my intention to share the blog posts, but to use meta data to tell the story. By developing my own theme, I can get down to the specifics, and decide what part of the blog I want to show on the front page. I am able to hide the posts, and work with just the tag and categories.

Screen Shot 2015-12-08 at 6.23.51 pm Screen Shot 2015-12-08 at 6.23.57 pm

Here are a couple of screenshots from my Google Sheets, which I’ve used for my final project in my data vis course. More on that for the next post. These are the information that I get from important my entries into WordPress. Using WordPress and Google Sheets in tandem is really useful for my process. With this in mind, I am also considering how I would like my physical outcome to look like as well. I’ll think about it as I go along.

Screen Shot 2015-12-08 at 6.05.42 pm

Having built a skeleton theme, I made a copy and installed another blog on my server. As I am also working to revamp my own personal website, I am taking the opportunity to learn more about what I can do with WordPress themes. All of this is good practice for my virtual outcome, and I am trying my best to do as much as I can over this break, while not letting anything I do go to waste. This screenshot shows a WordPress blog with no posts, just pages. What I am doing with this WordPress theme is to put all my content in WordPress pages, which would be a breeze for updating. The php function allows the pages to be displayed as they are on the wp-admin, which is a fantastic option – you can see the various things nested under the parent page of ‘works’ It’s been useful to work on these two sites for now as I explore what I can do with both posts and pages and consider how I can best incorporate their key functions together in my final theme development.

“january” progress

no noo

I’m finished with tagging entries up till 2010, although only entries up to 2009 have been uploaded on the site so far. The rest are on the Textedit file on my computer. I’ve been working with really unstable network connection and it’s driving me up the wall. I think this is one of the drawbacks of moving your work around and doing it on the go.

Also, I am quite frustrated with the amount of spam comments that are generated by my blog, even more so with the fact that Akismet offers the service for a ‘minimal fee’. I went with the free option anyway, but it does not make sense to pay to get rid of spam comments.

On the website, you will see a grid image. It’s meant to be a filler image at the moment. I will be writing a WordPress theme for this website, something close to a sketch I made a while ago. The entries are available for viewing (under the read more tag). I am still interested to have the metadata as the narrative. You can see that my tag cloud is quite specific.

The next step for my project is to plot in the number of entries per category/tag into Google sheets and creating a skeleton for a visualisation using the charts.

I am also paying attention to how I feel as a result on embarking on this project. It didn’t make me feel good to look at my own writing and experience in such close detail. I have the same feelings when I worked on the ‘dictionary’ project last semester. At that point of time, I felt mortified at some of the entries. I become more aware of myself, and that some of my flaws have been apparent for a long time, and I may not have looked into them or addressed them at all. But this are more personal reflections of my project that I think I’m not ready to share right now, without going through a long story about the roots of my angst, etc. I’ve been writing down some of these reflections as I do my work, and I hope to put them together as part of the conclusion for the project. All of this is a work in a progress, my personal self, the project… at the end of the day, I would like to be able to look at this project and know that I have made something good out of what I’m not proud of.


visualising january: part one


This week we begin preparing for our final project for Facts & Fictions. I’m taking this opportunity to apply my newfound skills to my current project by visualising the entries from January over the period of 2005 to 2015 (January x 10). The amount of data over this period is a good size to work with for the final project (which will culminate in a group show in another 14 days), and I think it is a perfect chance for me to try visualising a part of my FYP.

These are some of my process shots:blogtagging01

Filtering entries from January 2005: there are 17 items, of which I am going to individually tag and categorise them. In 2005, I was still on Blogger, and the blogging platform is very simple, and I don’t remember tags or categories existing on Blogger then. So it was quite a good thing that my entries are left un-tagged/categorised, now I can be very specific about how I want to label the entries for the sake of this project.

blogtagging02

I am also doing tagcrowding again, with the help of Miriam Quick, who does research for information design. With her guidance, I learned how to use Tagcrowd in a more resourceful manner. She also taught me how I can use Google Sheets to my advantage, by showing me lots of cool stuff that can be done with Sheets. After running through my text in Tagcrowd, I went on to omit common words, and made a list of frequent words I use. This is different from individually tagging my entries, which I feel is something I would have to do manually if I really wanted to be specific about the topics that I wrote about, and I think there’s no shortcut to this part. Tagcrowding would be useful for highlighting linguistic details like: lingo, swearing, emotive words, and even names. This could be an interesting area to visualise on its own, so at the same time, I am also creating an additional dataset for that aspect.

blogtagging03 blogtagging04

I’ve installed WordPress on my own site again, for this January project. Currently, there’s nothing fancy there yet, but I think the taxonomy is taking shape and I am very excited about it. I’ve just finished importing entries from January 2005. You can take a look at it as I update it with more January entries, although I must warn you that some of the entries are very juvenile. Please bear with my 13 year old self. Haha.

Overall, this whole process of creating the metadata is far less agonising that I expected it to be. Before embarking on the January project, I read through all the January entries in the ten years, which left me in a very sombre and nostalgic mood, but all of that is gone when I go all technical about the work. That really gave me an idea to write a reflection piece after I have completed making these datasets for my archive. It would be interesting to include in my process book.

I’ll share more when I finish making the datasets for each year, and also my process on how I will visualise everything.


WordPress Theme Sketch

Theme URL: http://bever-gif.com/theme/

This theme aims to present data in a single-page, long form manner. The data is my blog entries from 2005-2015, which I’m currently breaking down and building the tags by hand. (literally!) I would call this an experimental theme, that does not aim to function as a working theme, where new entries can be added and viewed. The theme uses existing WordPress widgets and the structure of the blog as an interactive way of presenting information. This is what I hope to achieve in the virtual part of my work. 

Here’s the outline of the theme:

(Note: this sketch is meant to be as simple as possible. My aim is to try and work out the function, before I add in the visuals.)

calendar

calendar

At the top of the theme is a calendar. Think of this as the big cloud that holds all the entries together, from various years. The entries are grouped in months rather than years, for example: January 2005, January 2006, January 2007, etc. The months are links: upon clicking them, more specific entries will show up.

month

month

Let’s take October for example. When October is selected, a tag cloud will show up.

tagcloud

tagcloud

The cloud describes the topics that are written in this month, over the years. This is the key feature of this theme as the tag cloud is an overview of how the content in my blog have progressed in the span of the time I’ve been writing it. A click on the tag will bring up even more specific entries.

tag

Let’s select the word ‘computer’. The theme will then list all the entries written about ‘computer’ in October, over the years.

years

years

When a specific tag is highlighted, it will list the years with this topic. *I forgot to add, but next to the year, there should be a number that displays the amount of posts.

entries

entries

Upon clicking the year, the entries will finally show up.


blogspot.jodi

jblog_01 jblog_02 jblog_03

During 2006 and 2007, Jodi made the work <$blogtitle$>, based on the social publishing tool Blogger, from Google.13 <$blogtitle$> looks like a Blogger page in a broken state. The pages generated by Jodi’s (mis)usage of the tool are either filled with gibberish or in ruins. It’s hard to say: perhaps you are looking at back-end code.

Jodi indeed plays with different language systems, for instance the visual and the non-visual source (code) of the Blogger software. Template formats such as the title of the blog, the post headers and certain blog addresses in the link list appear all in ruins, while Blogger-specific images like comment-icons, dates and additional otherwise functional visual elements are now reduced to theatrical objects.

glitch’s formal fragmentation signifies that the work is ‘open’ to inter- pretation and meaningful engagement.

By ruining the Blogger medium, Jodi’s use of formal fragmentation opens the platform itself up to deconstruction, interpretation and further active engagement. As a result, the meaning of the ruined work is never finished, whole or complete.

However, for the reader to actually give meaning to the ruins, they must take the initiative of imposing (their own select) new constraints, new frameworks of analysis and limitations on other possibilities.

this openness also had a negative consequence: Blogger interpreted the blog as a malicious spamblog and consequently blocked it. This act could be described as a rather rigorous ‘death of the author’, in which the meaning of the work is not negotiated, but instead dismissed and deleted.

<$blogtitle$>, Jodi shows that a glitch can be com- pletely constructed (by the artist), but also that such constructs can in turn reveal the con- structedness of software-generated knowledge and expression.

— Rosa Menkman, The Glitch Moment(um)

Jodi.org is the brainchild of two Internet artists, Joan and Dirk. Keying jodi.org into your address bar spawns a series of webpages that are rather crazy, like they are taking over your browser. Some of the effects generated by the website include: constant page redirects, flashing images, auto-downloads, wacky URLs. Their style of internet art/glitch art have been described by Wikipedia as “the work of an irrational, playful, or crazed human.”

One of the side projects that resulted from Jodi.org was the duo’s experiments with Blogger pages. I came across the work while reading Rosa Menkman’s Glitch Moment(um) essay.

Jodi deconstructed the standard Blogger pages, causing it to look broken. The pages looked like what would happen if you enter the source code of the pages and remove some important parts of coding, that renders certain functions useless (i.e incomplete HTML coding to display an image, that resulted in a broken image icon).

I find this work quite an important point of reference for my WordPress theme sketch, which Boyan, Cynthia and I are working on, especially when I think about how I can deconstruct my blog archive by manipulating the functions of a WordPress blog: perhaps altering how categories/tags are being displayed.


Something about virtual reality

I was going to crawl to bed after my night shower, body loosen up by the heat of the water, phone in my hand, notifications pinging. Wanting to rest, but unable to. I decided to turn on my computer instead and be productive. I still like to work on a desktop. A desktop computer means business. You get too comfortable with the mobility of a laptop.

Two days ago, I decided to delete my Instagram application and say a virtual goodbye to an audience I don’t really know. But in my quest to deactivate myself from social media, I am still inevitably stuck with it because of work commitments. I now have a Facebook account just for class and work. Work accounts are okay, it filters out a lot of crap that are usually on personal news feed. I started to think about why I needed to deactivate myself, always, from social media, and what it means to do that, and how that would influence the virtual part of my project.

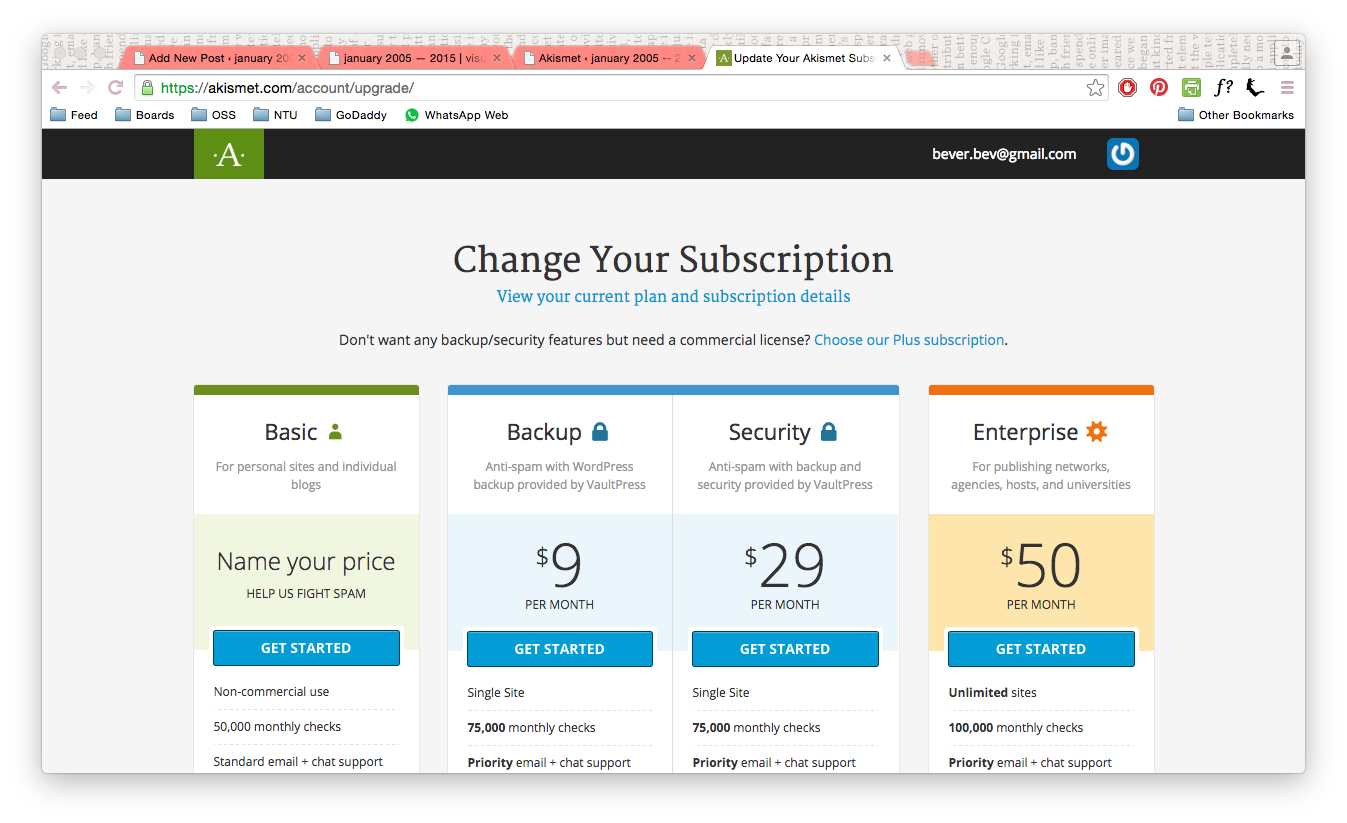
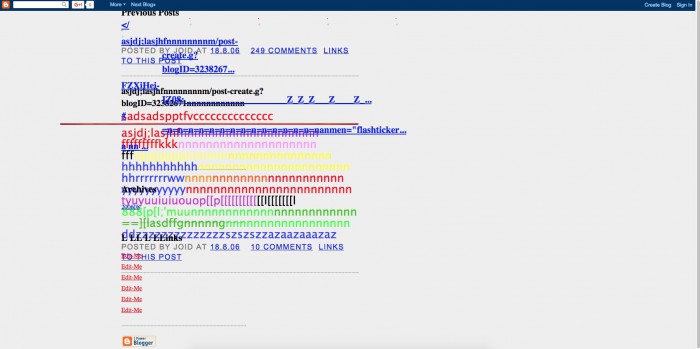
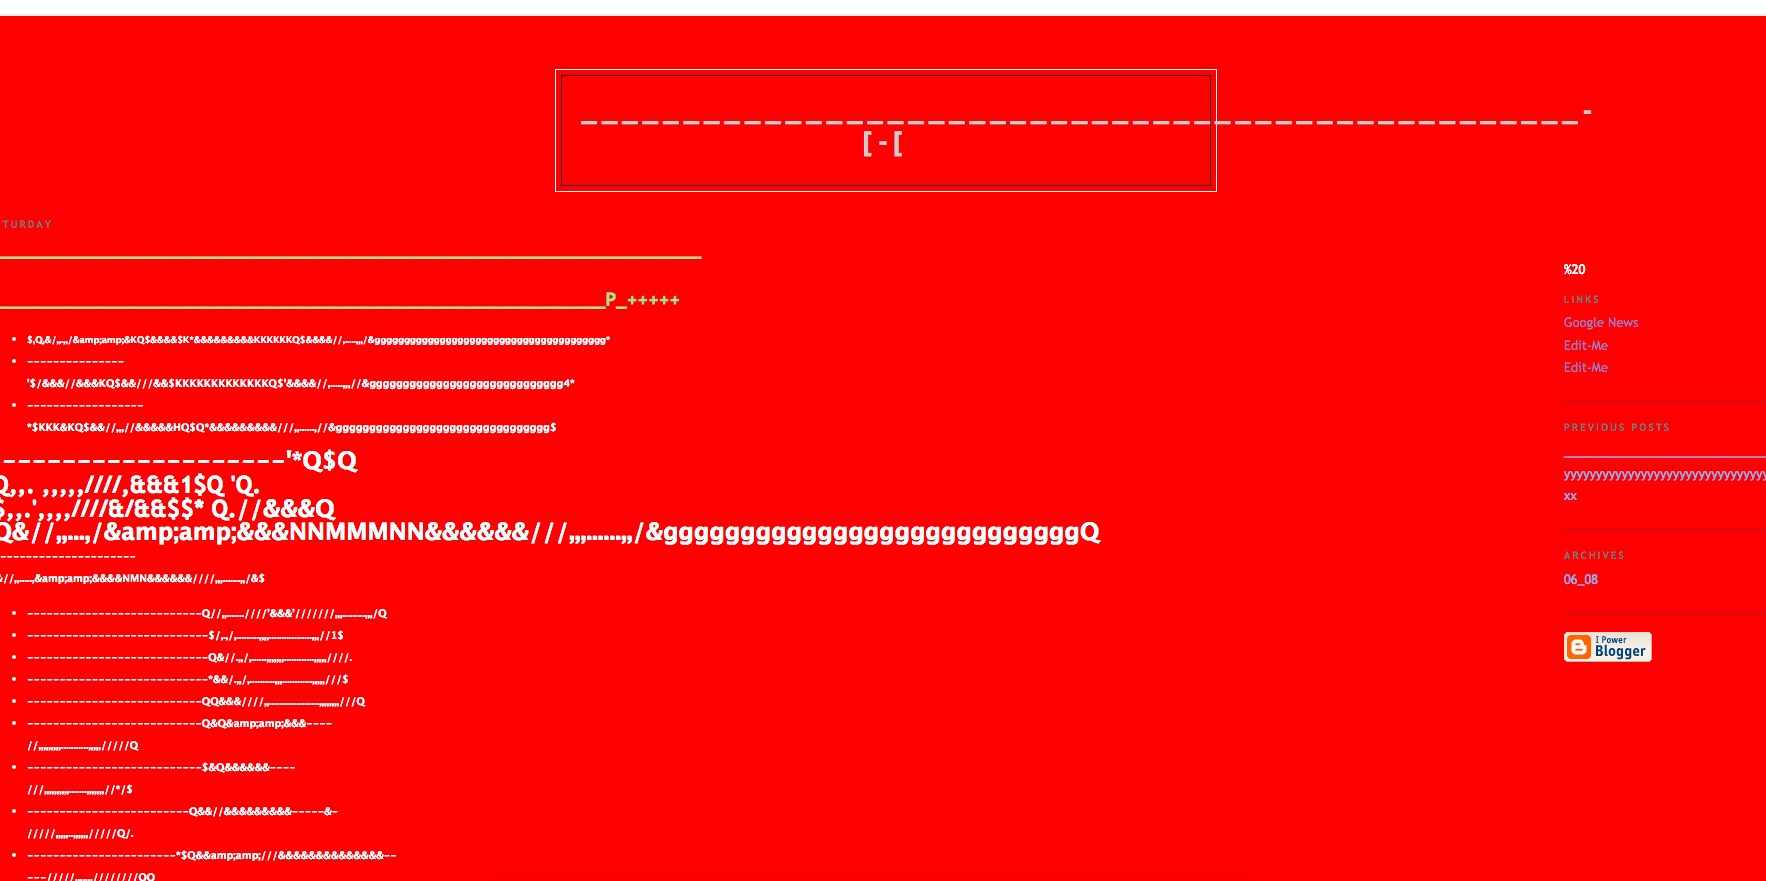
This evening we had a little chat about WordPress. The plan was to strongly encourage students to use it to share their work. I thought about WordPress and my long-term use of it for a while tonight, and what the Internet means to me in this project. It begins with blogging. I really enjoy using WordPress. I was a user of Blogger, until I bought my own domain and wanted to transfer my blog to my domain. Unlike WordPress, Blogger cannot be installed on a personal web server. But you could easily install WordPress on your cPanel and create wonderful themes around the script. Creating a blog theme (no matter what blogging website you use), is not as difficult as it sounds. I like to build what I call a skeleton theme, something that is very pared down to the basic elements of a blog: date posted, blog entry, user. Then depending on the purpose I had at the time, I’ll turn the skeleton blog layout into something else.

Through learning how to make my own blog layouts, I met many interesting online friends. There were other girls who made beautiful websites, (which were essentially some well-made themes) and we would comment on each other’s efforts. I got to know them better by reading their blog entries. We all discuss our daily lives, each one of us residing in a different corner of the world, and shared our experiences in making the blog themes. I think that’s why WordPress stayed with me for so long. I have very fond memories of those times. I also like that WordPress didn’t change to something else. It was quite the only bit of the Internet left that I cared about and use frequently. It was media without the social part. There were no heart symbols at the end of my entries inviting my invisible audience to like the post I’ve written. There is no reblogging link for them to share my post on their blog. When I make a theme later on this semester for the virtual part of my FYP, I’ll not be making one that fits people’s mobile phones or to include any of these social quirks. I don’t really care. I know mobile phones are really convenient to view web content quickly. But if you couldn’t spare the time to take a look at what I’ve made on a real computer then it’s quite a waste. I’d want to invite my audience to go to the trouble of creating a username and leaving an actual comment. I think that is akin to leaving someone a handwritten note, in this age.

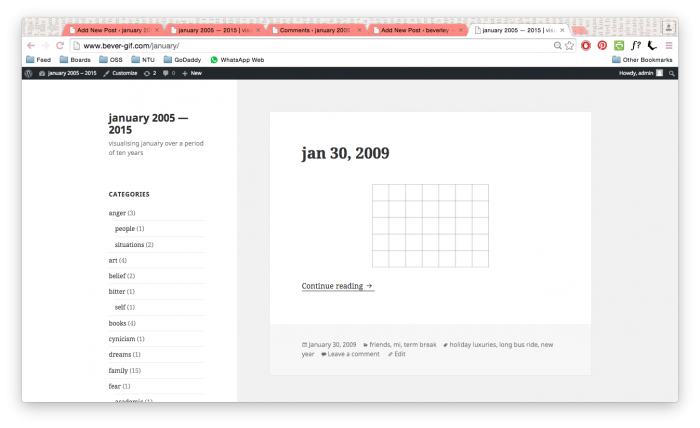
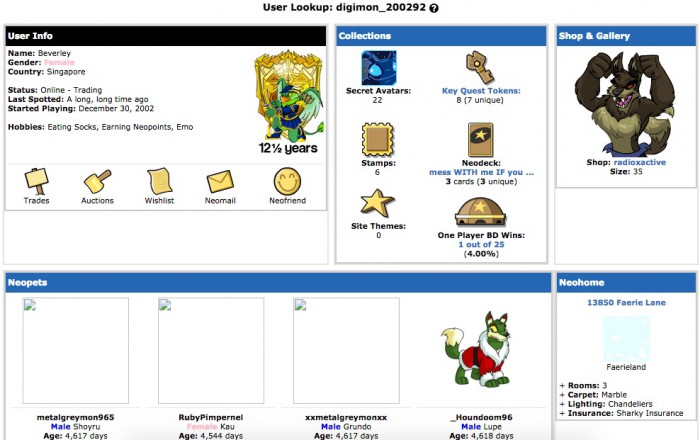
So I would like to propose that the virtual part of my project is a celebration of these “analog” things before the crazy advent of likes and follows. I think many people of my age would resonate with that. Before followers are called followers, they were called ‘friends’ (i.e Livejournal user profiles) Before stalking someone’s Facebook profile, there was Friendster profiles. And way before that, there was also stalking someone’s user lookup on Neopets. I want to combine these things and my blog content, to create an artwork, as a response of sorts to the question “what did you do online when you were a teenager”?

I also want to be clear about not referencing to social media for this. I won’t be making a Facebook page about this. I don’t want social media to heavily influence the outcome of my work, or to even be a part of the conversation. Perhaps in my project report, I will discuss further about this aspect, but I don’t want to work to have any of these.
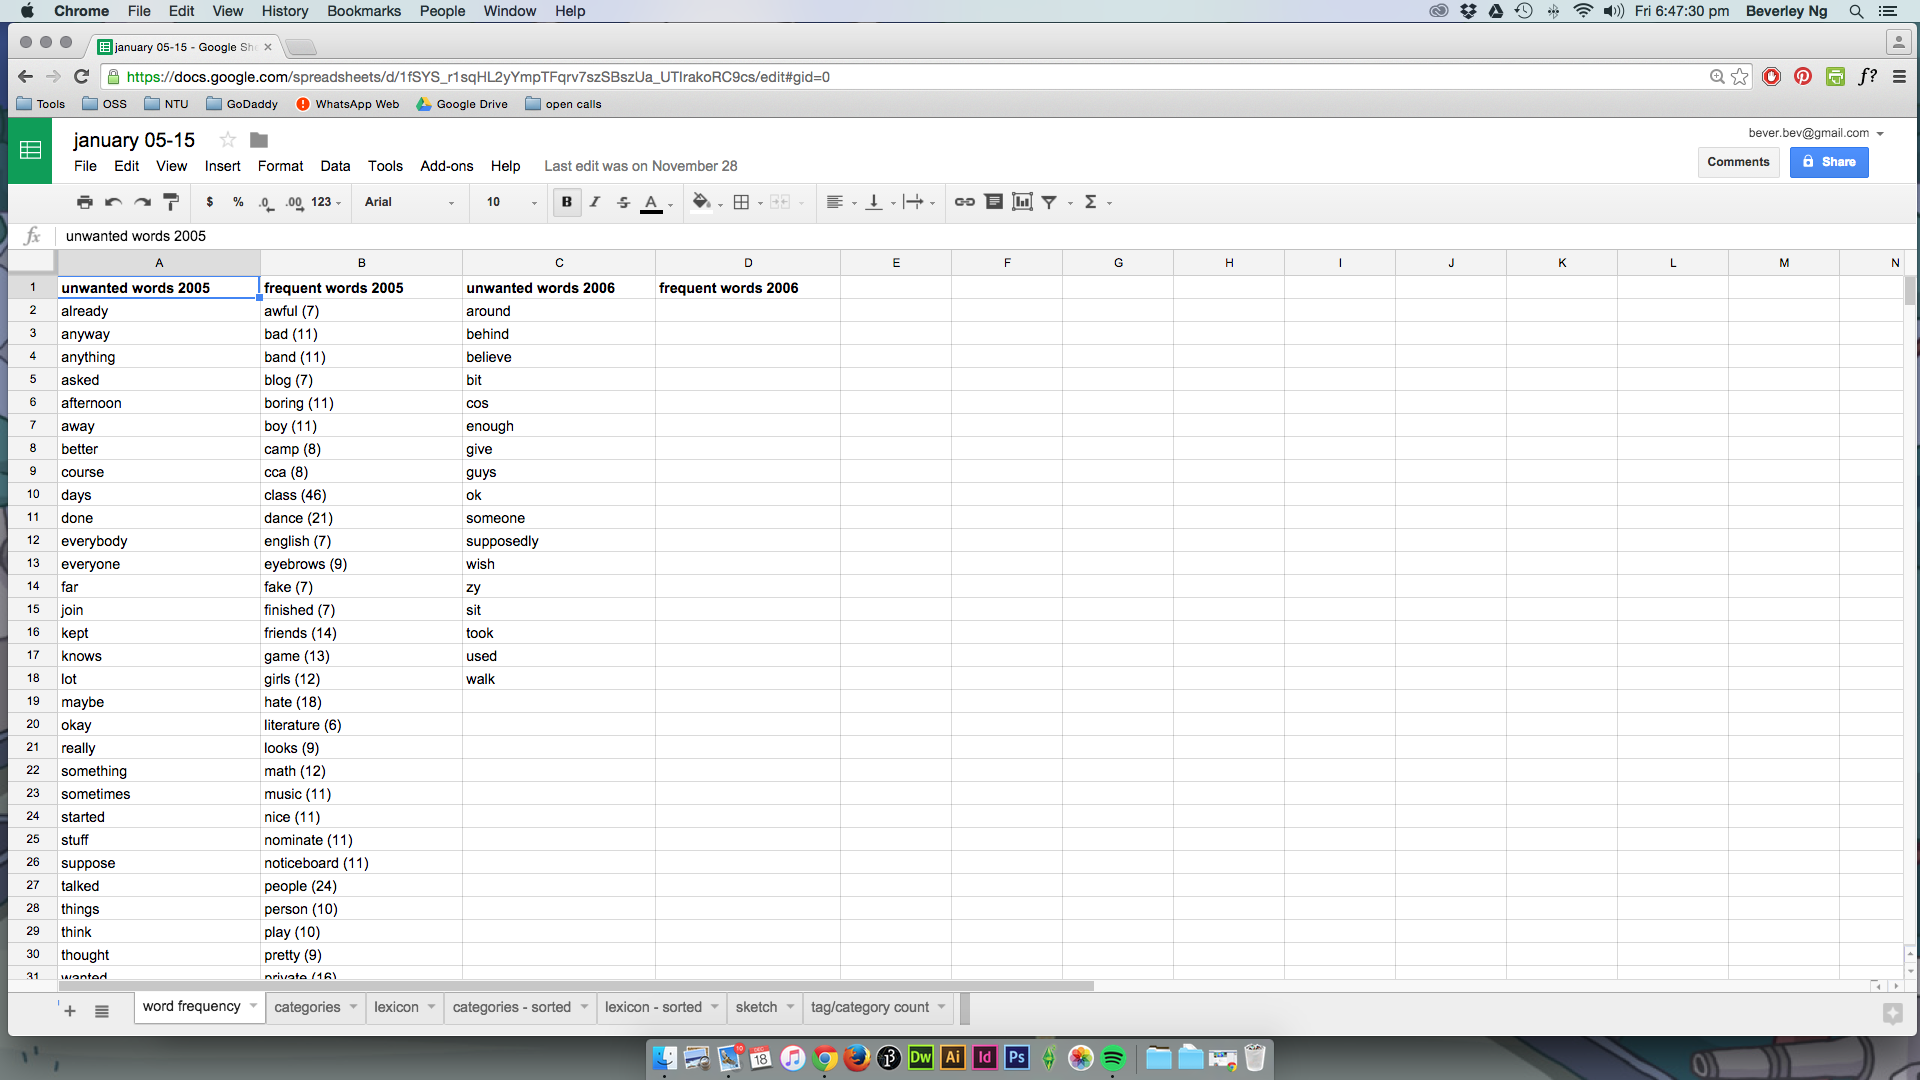
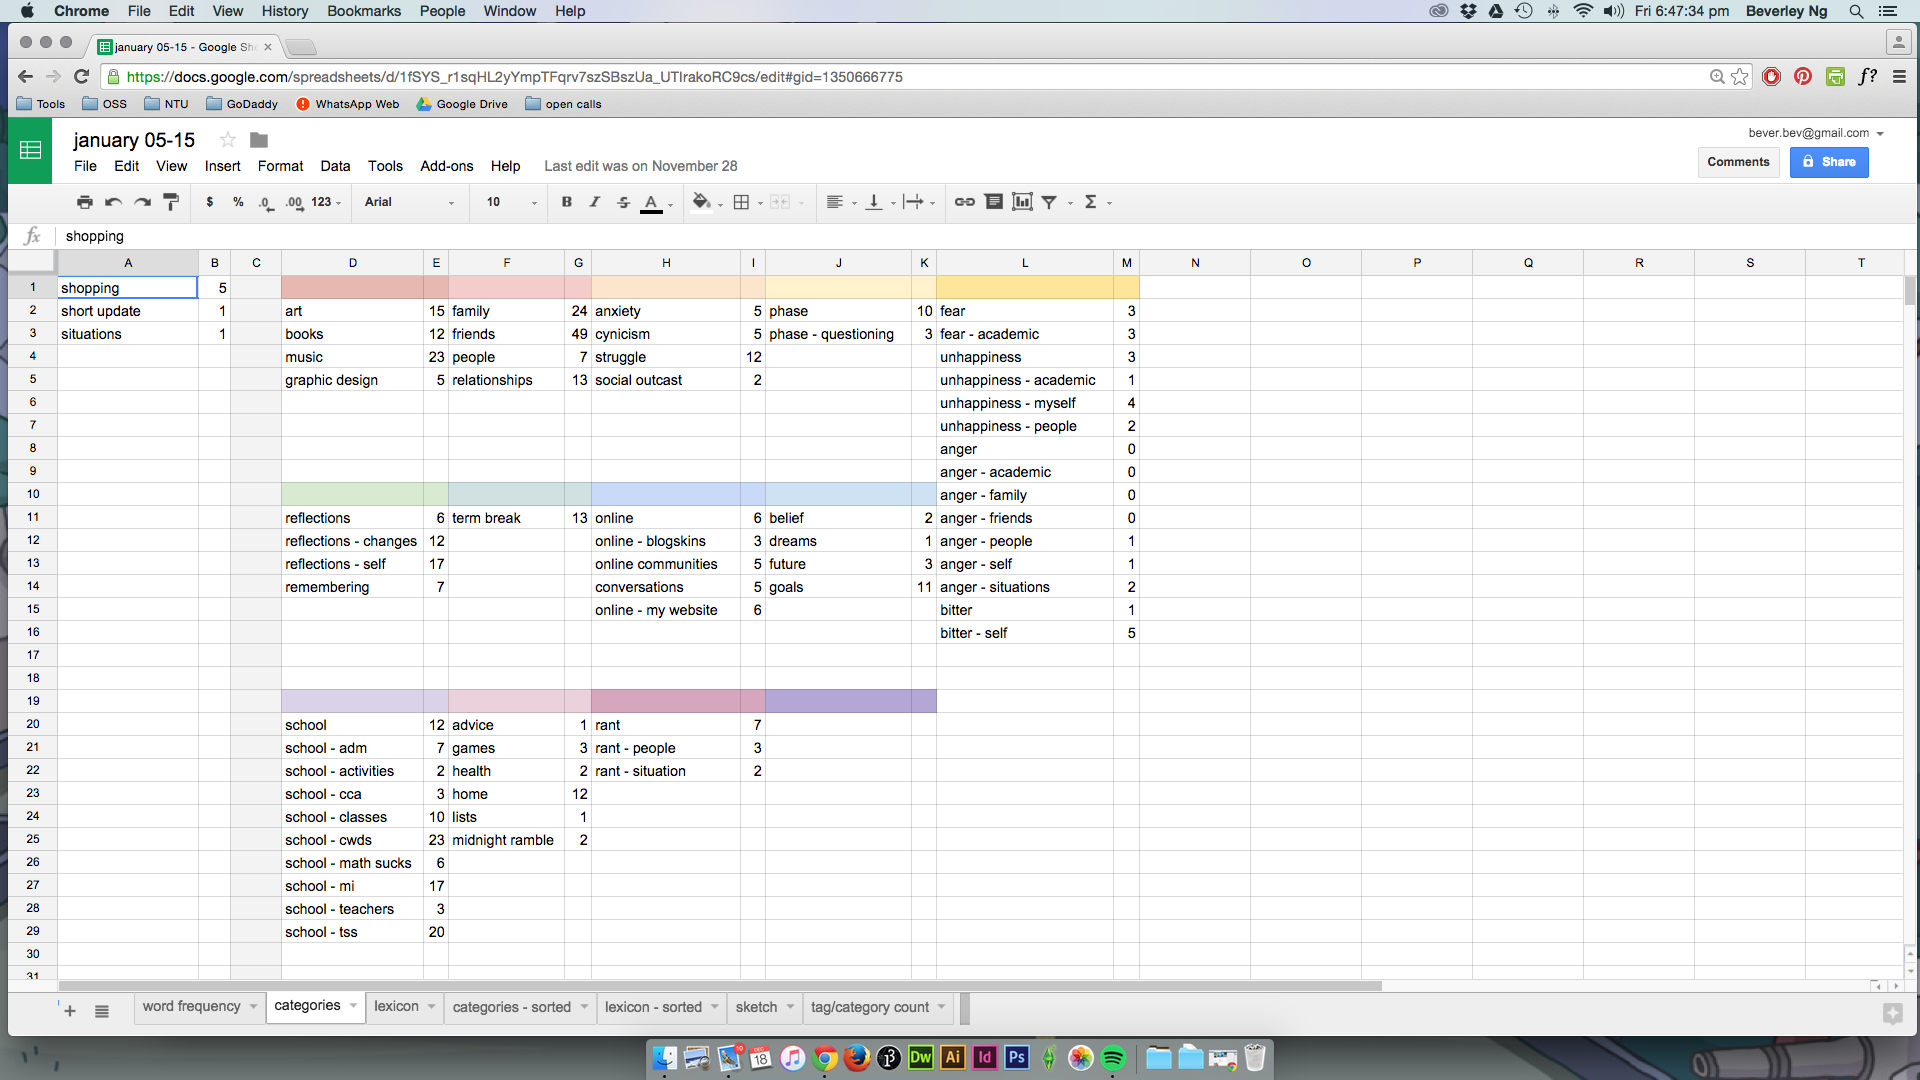
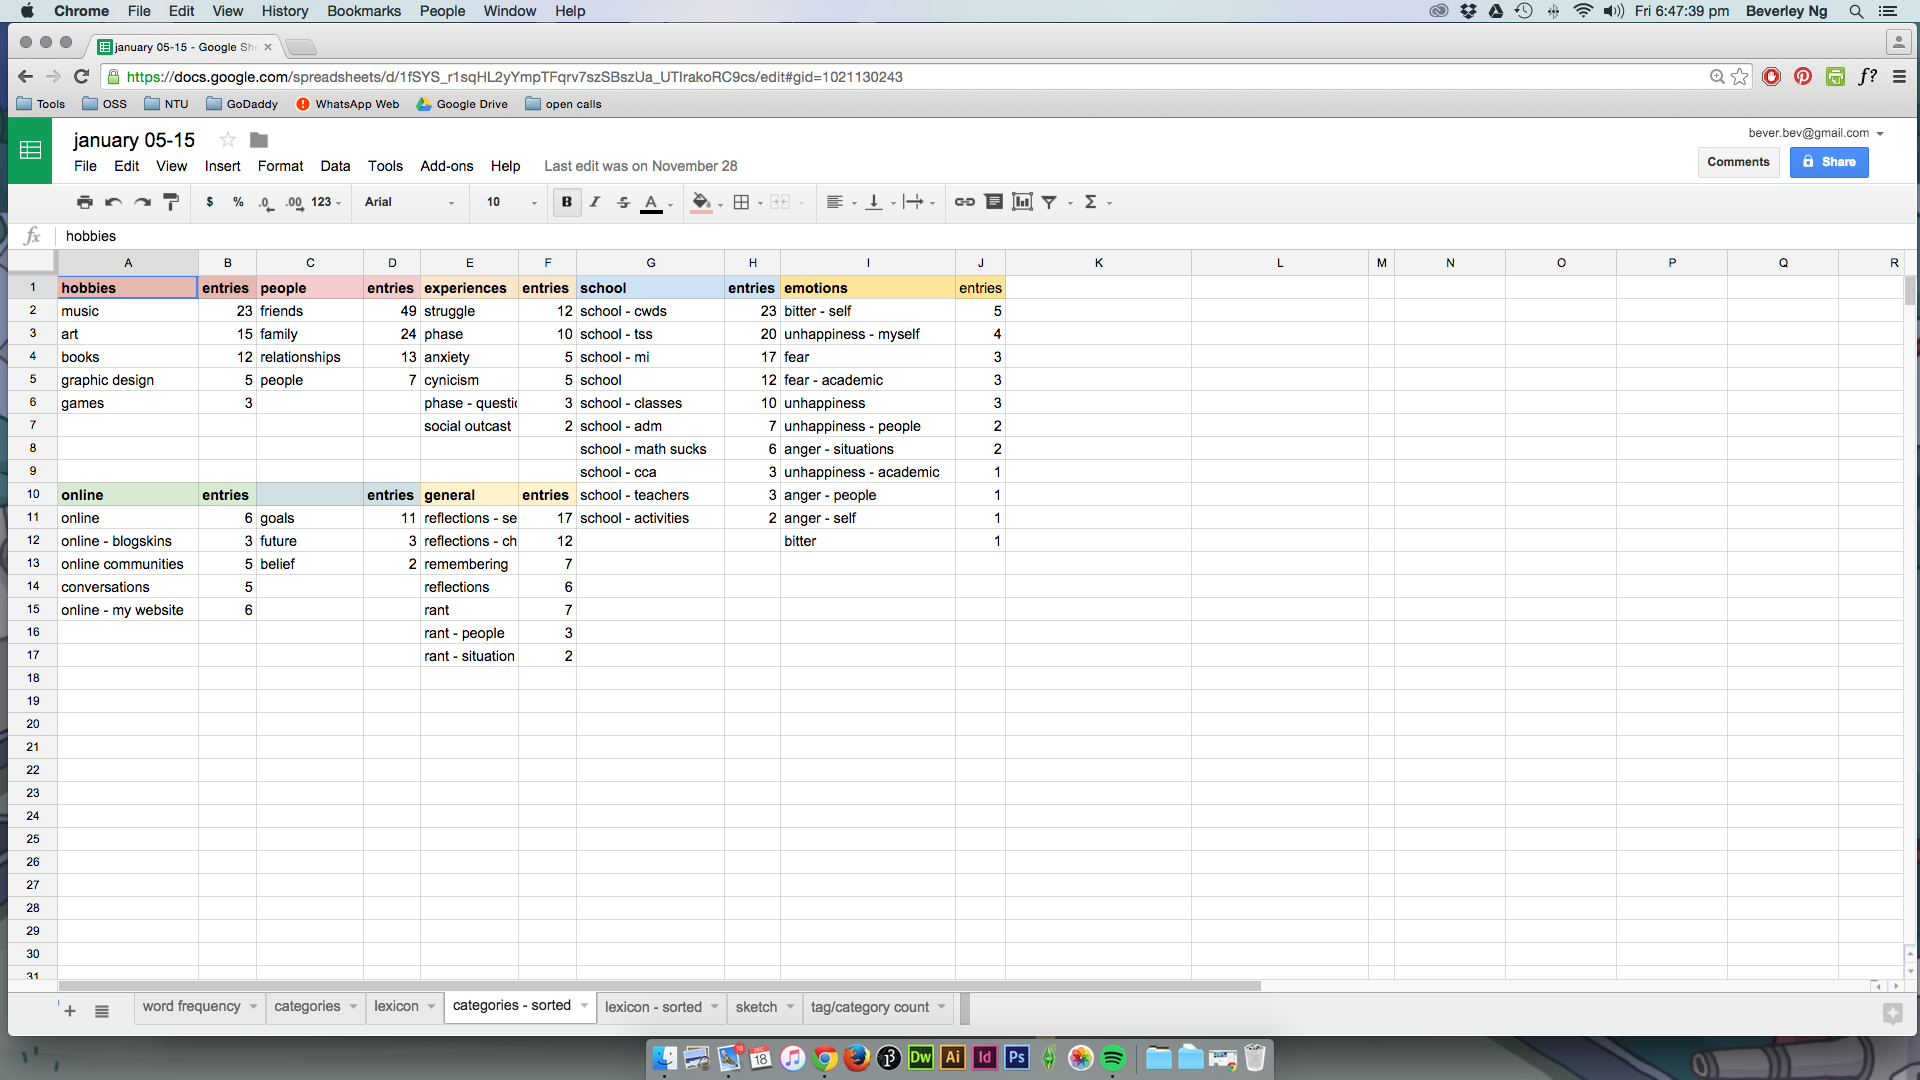
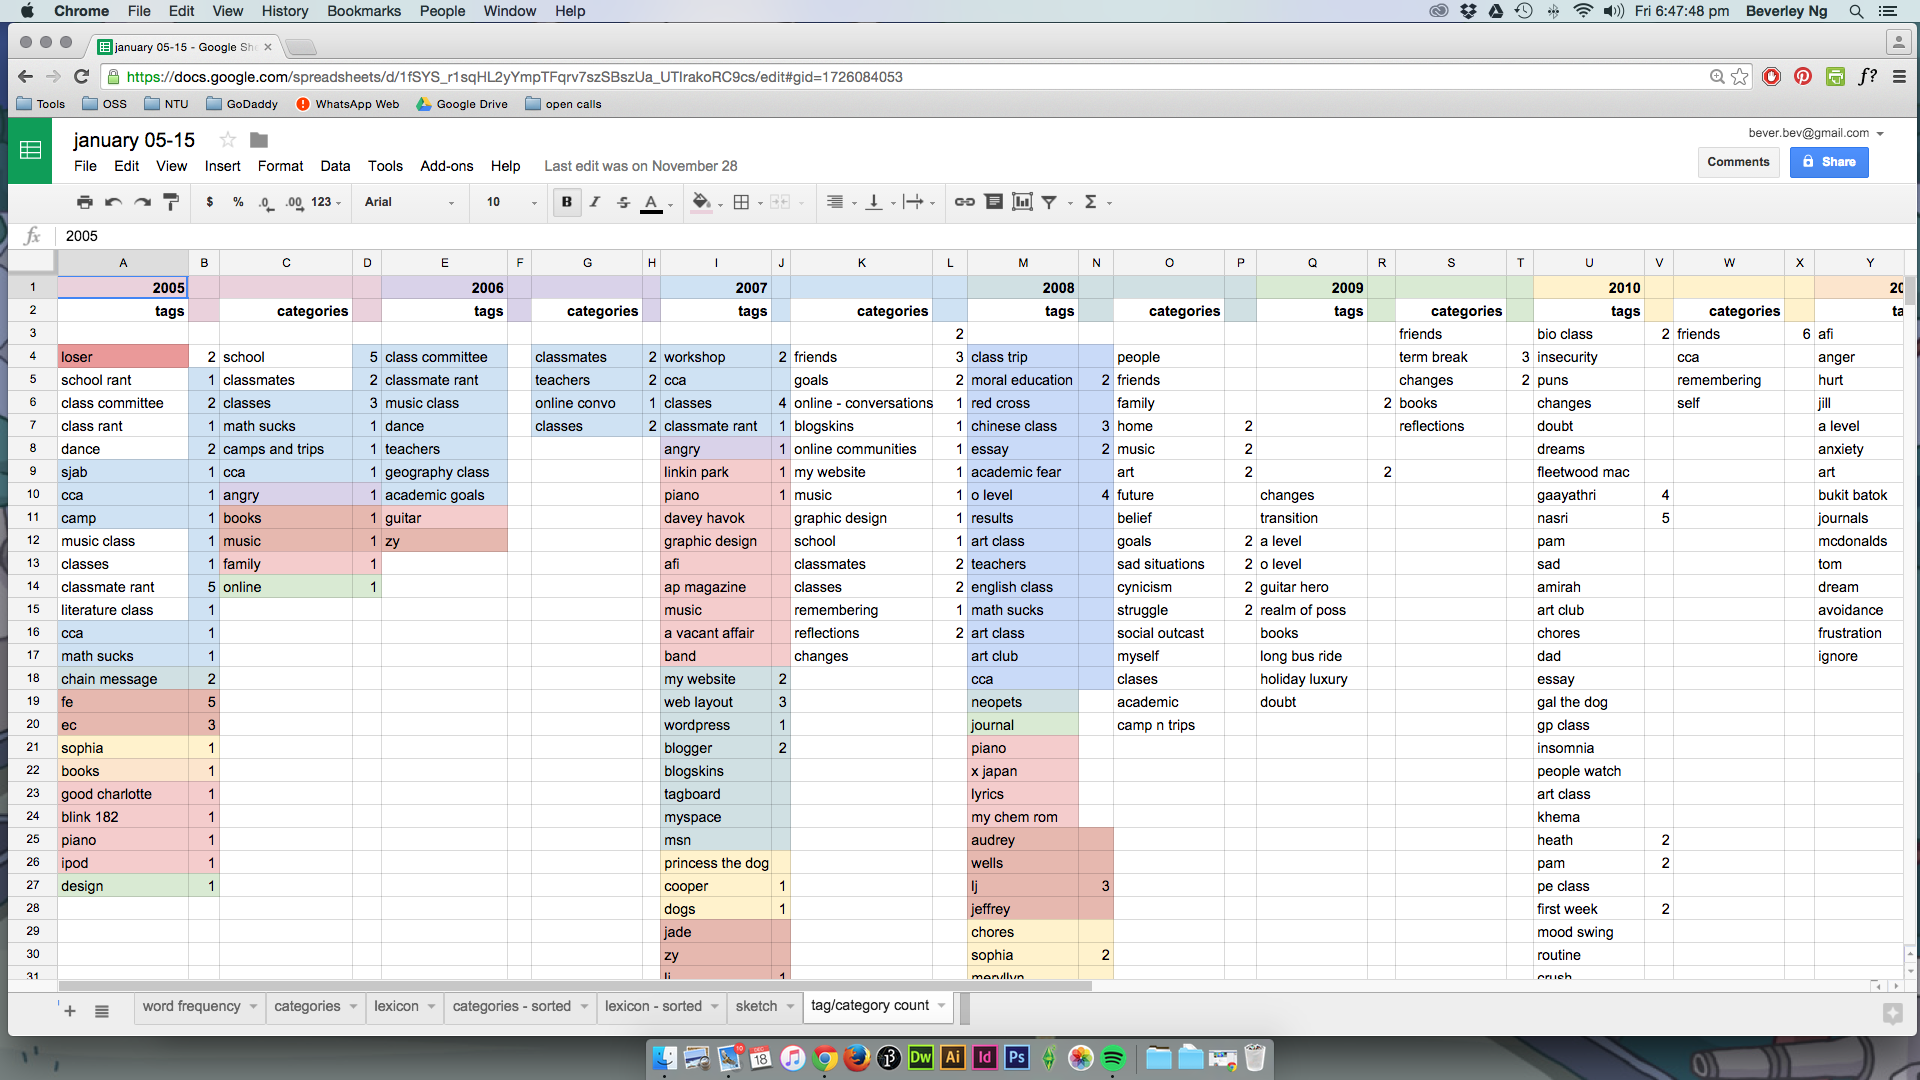
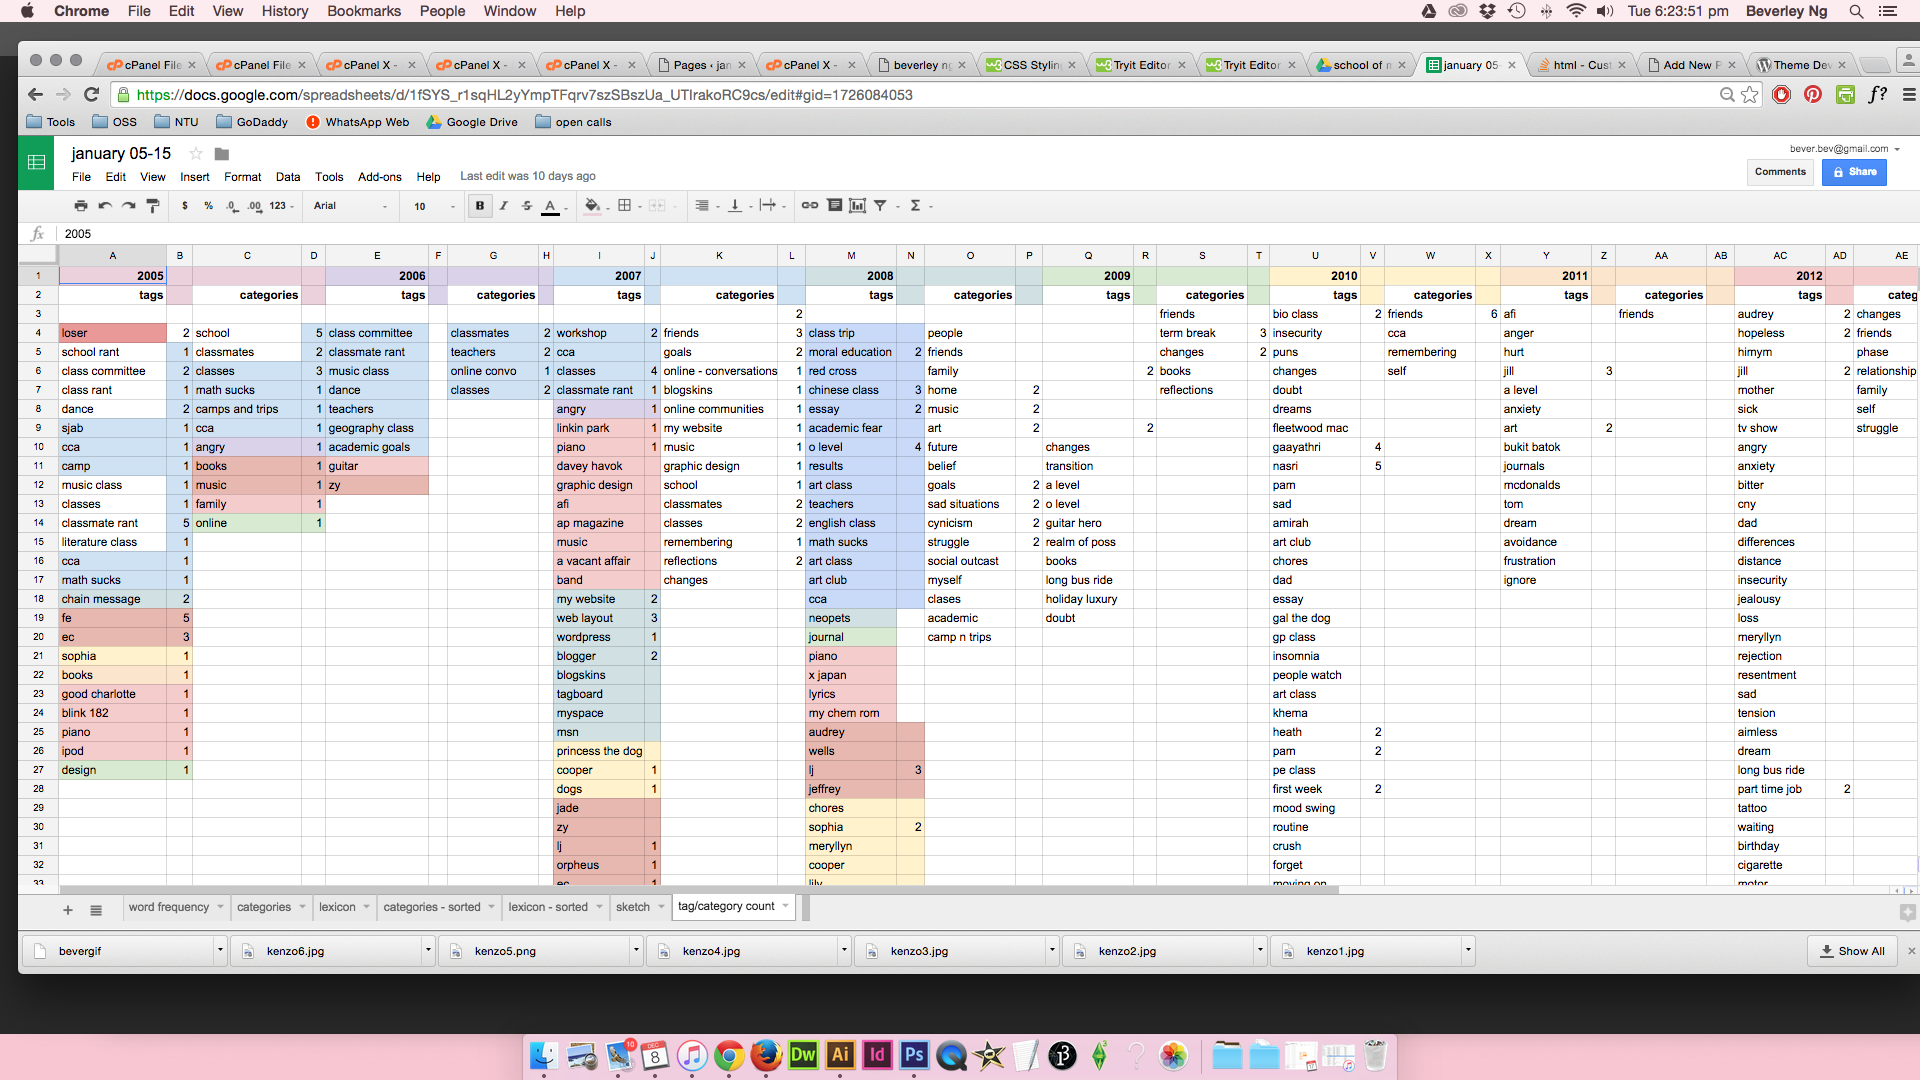
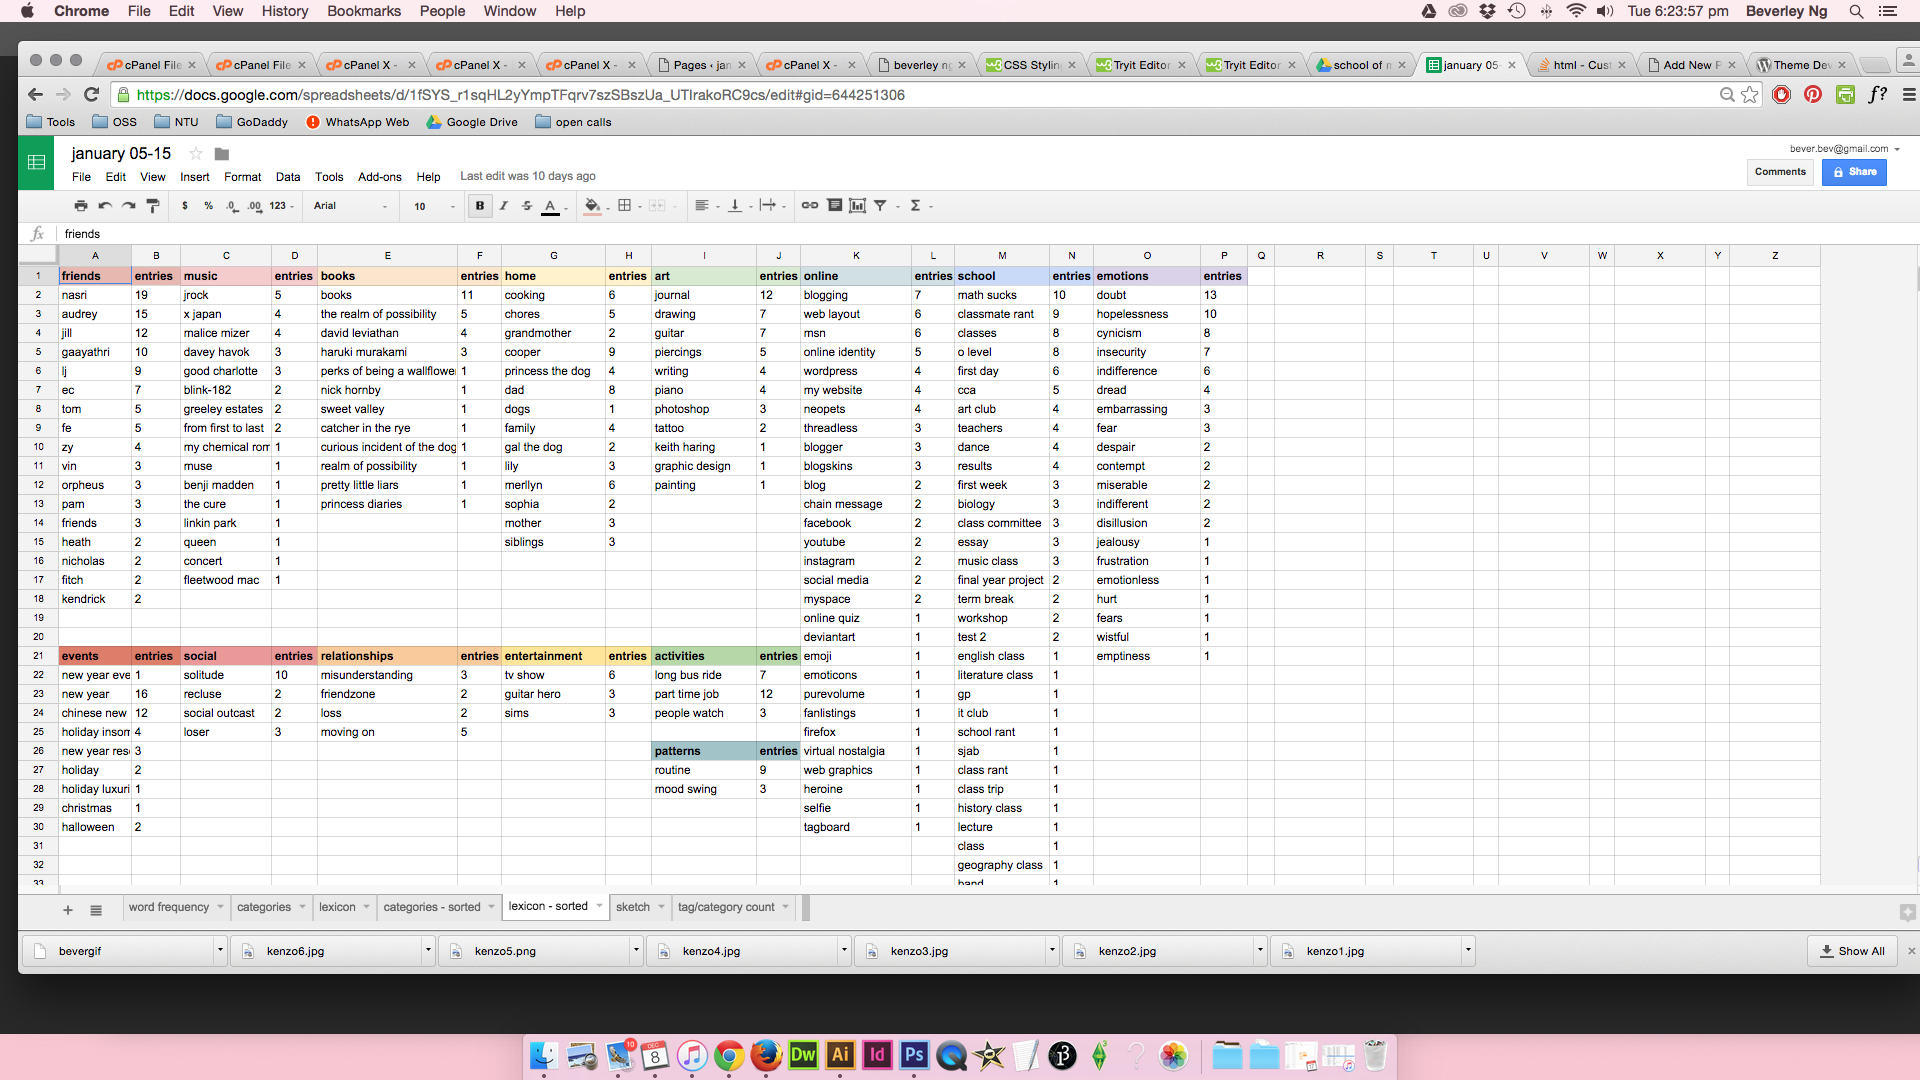
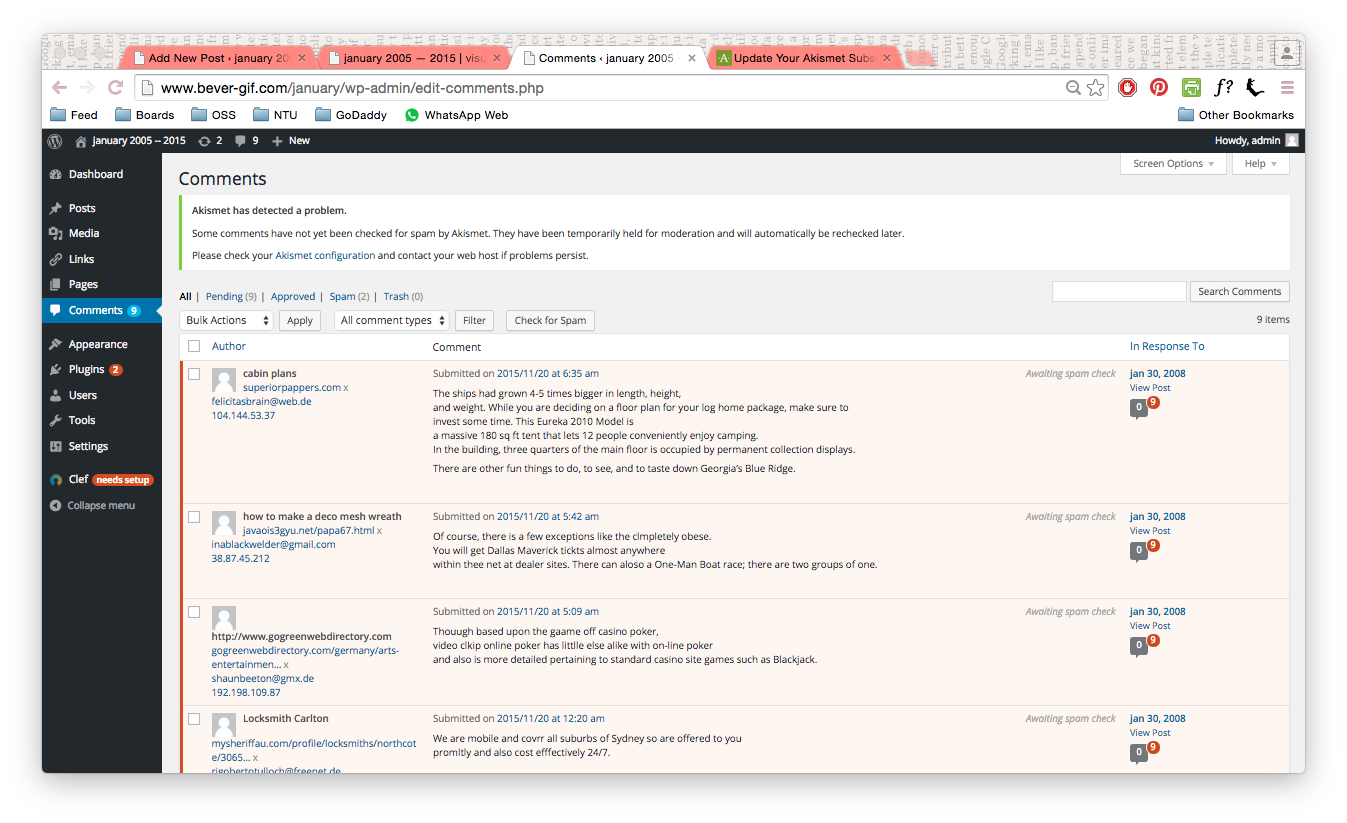
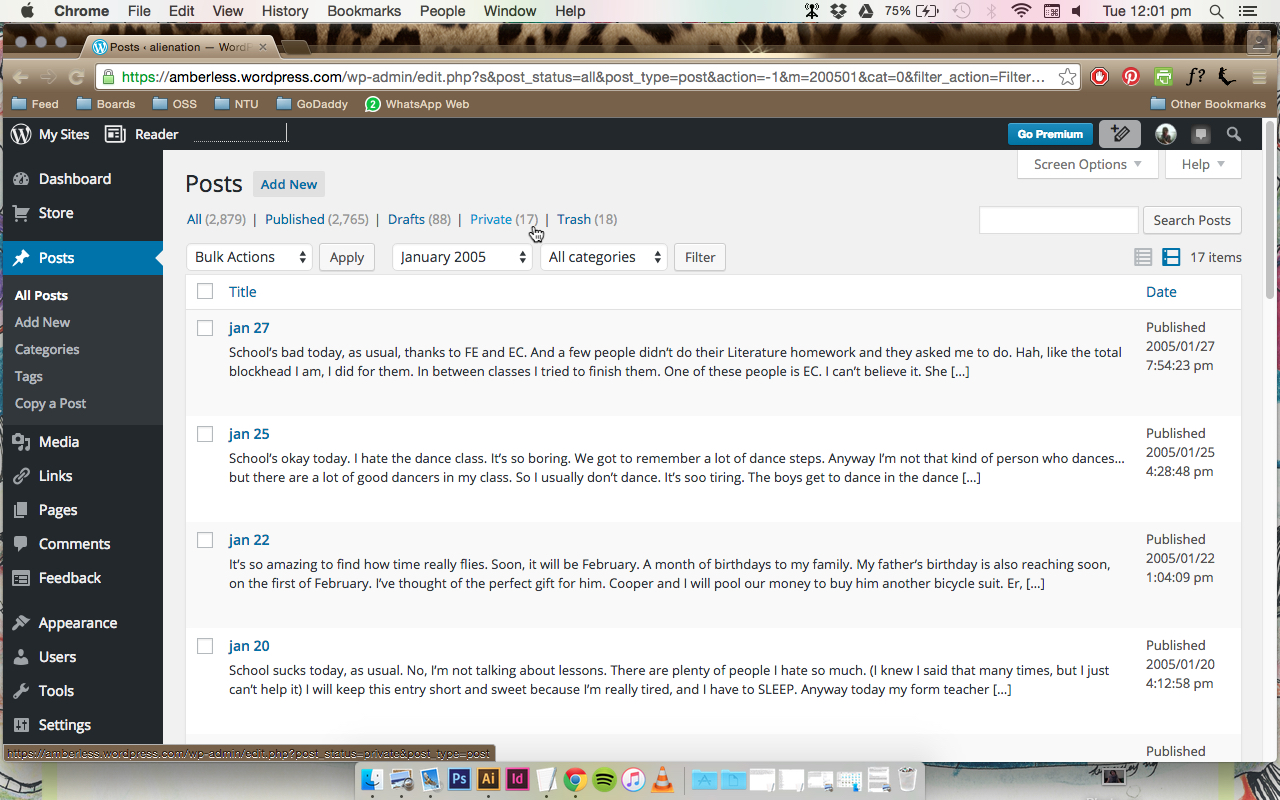
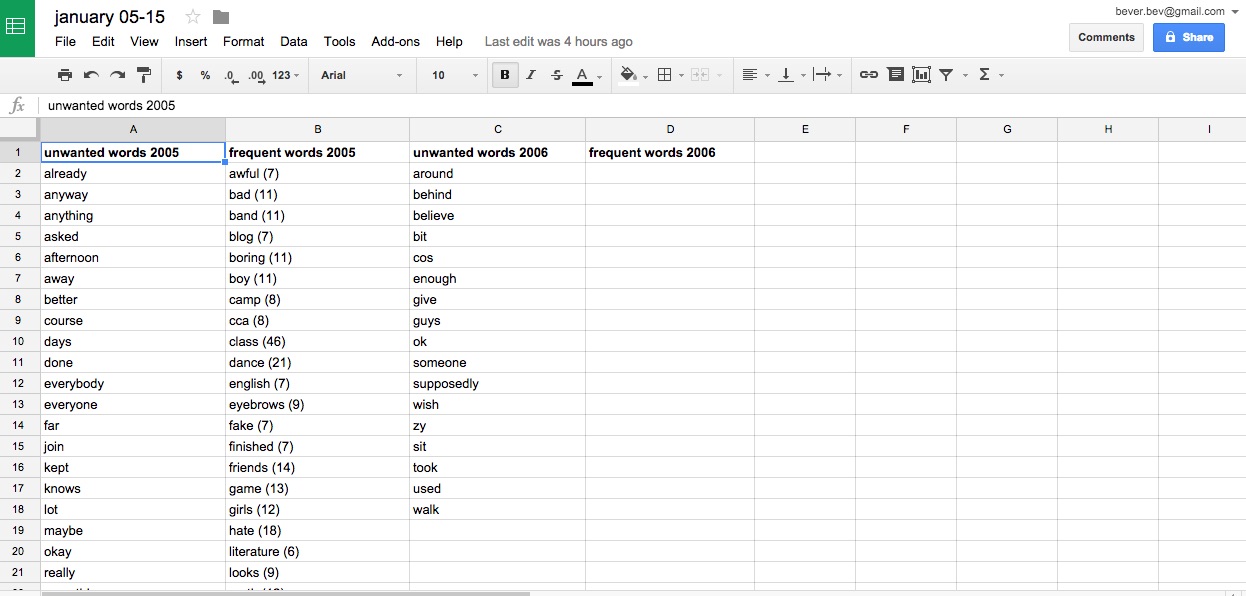
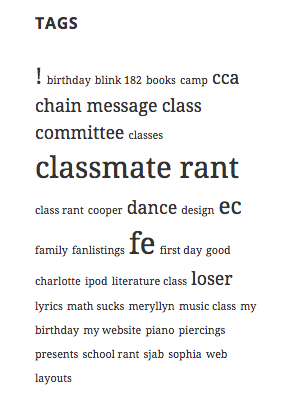
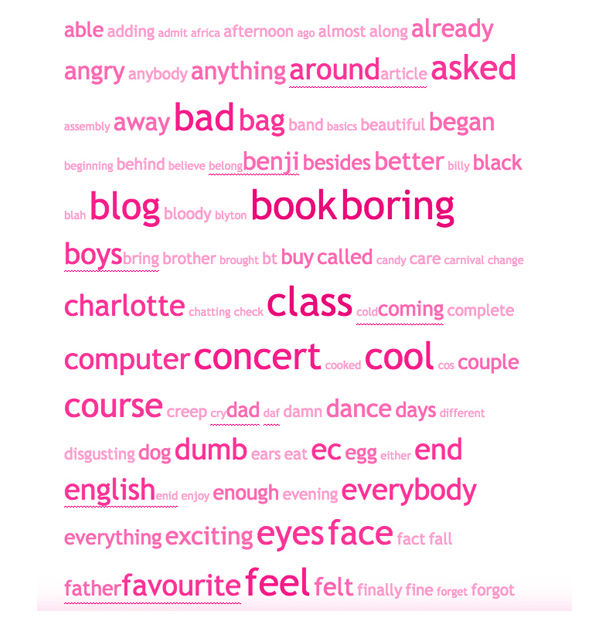