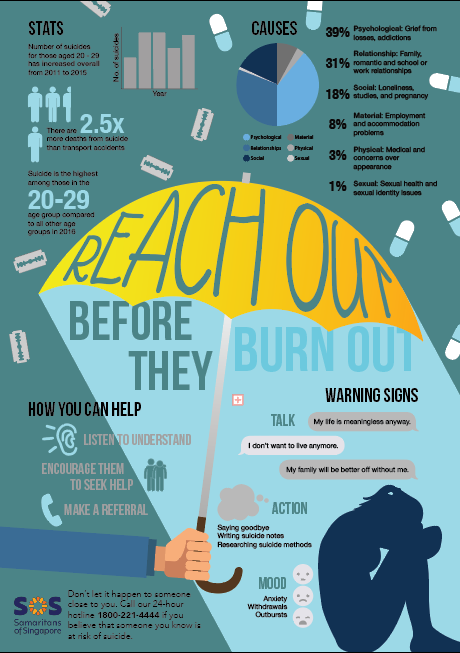
After collecting data, I decided that my infographic needed to have information, and helpful tips for a call to action. Hence, I categorised the data into 4 categories: Statistics, Causes, Warning Signs, and How to Help.
SKETCHES

FIRST DRAFTS
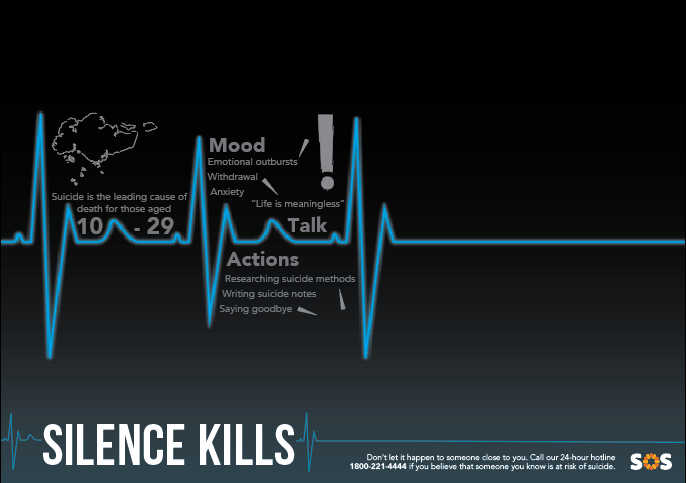
I started out with two ideas. The first one being a heartbeat, where it starts out beating fine, but slowly flatlines. This would indicate the death of the individual. I also tried putting in some information to visualise how it would look like but I didn’t like the outcome.
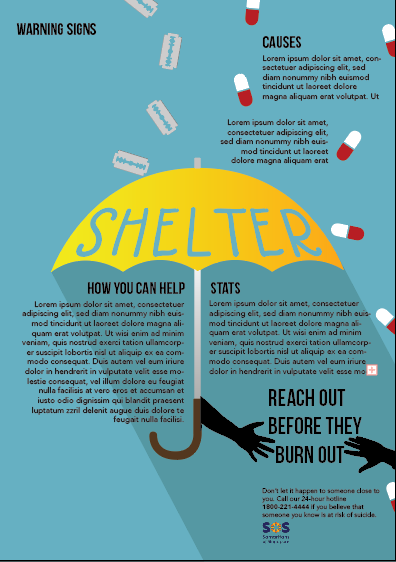
The second idea was using the umbrella as the main imagery, as a sign of shelter. I also added the 4 categories but used placeholder text just to get a feel of the overall outcome. Michael commented that it might be better if there was a hand holding out the umbrella towards the other such that the act of reaching out is clearer.
OTHER DRAFTS

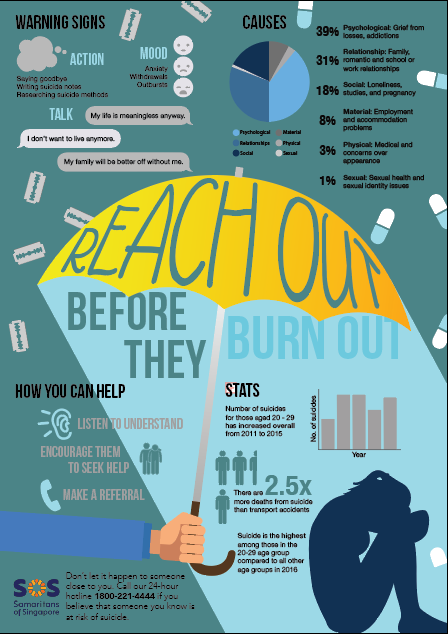
For this draft, the word “shelter” seemed to be fighting for attention with the quote at the bottom “Reach out before they burn out”. Hence, I decided to take away “shelter” and also changed the shade under the umbrella to be a brighter ray of light to symbolise hope.
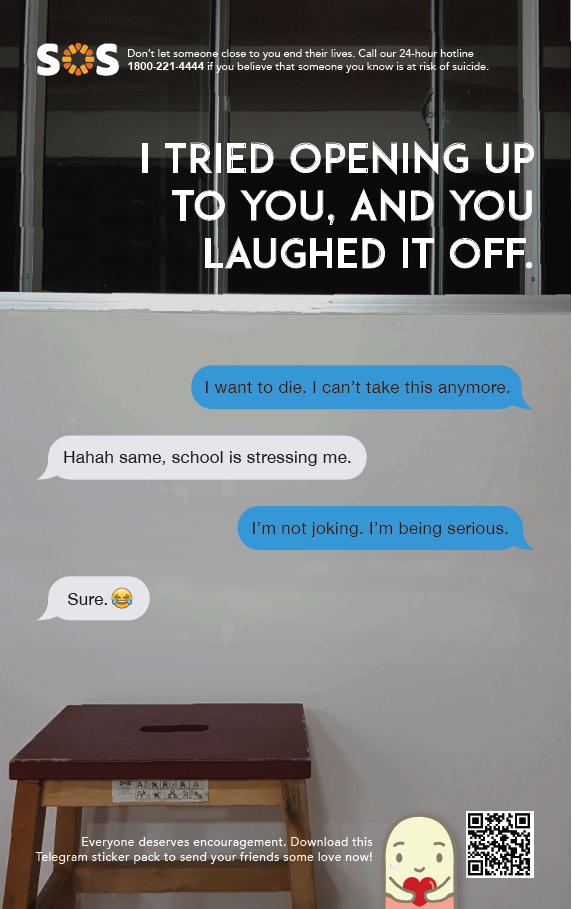
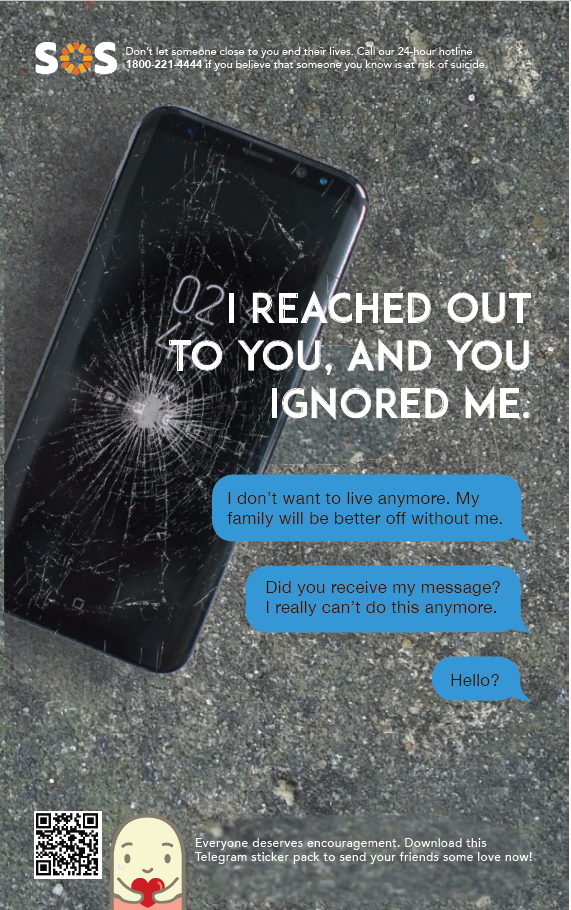
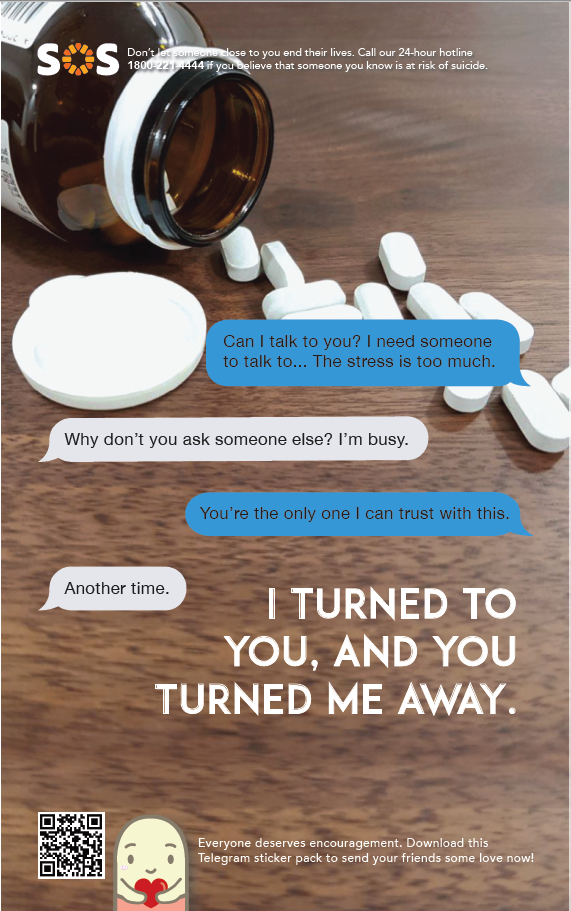
FINAL